
Uncover the mystery of satiety with our comprehensive guide on the Satiety Index. This eye-opening exploration sheds light on the Food Satiety Index Score, a key to unlocking sustainable weight loss.
Bid farewell to insatiable cravings as you delve into a world where feeling satisfied doesn’t come with a calorie-heavy price.
Learn about the foods that keep you full longer and embark on a journey towards better health, armed with the knowledge of the satiety index.

The Most Satiating Foods Per Calorie
Our satiety analysis demonstrates that we achieve the greatest long-term satiety when we obtain more of the essential nutrients from the foods we eat.
While all the essential nutrients are important, protein, fibre, calcium, potassium, and sodium all have the most statistically significant relationship with eating less.
Foods and meals that contain more of these nutrients per calorie satisfy your cravings and empower you to feel satiated over the long term with less energy.
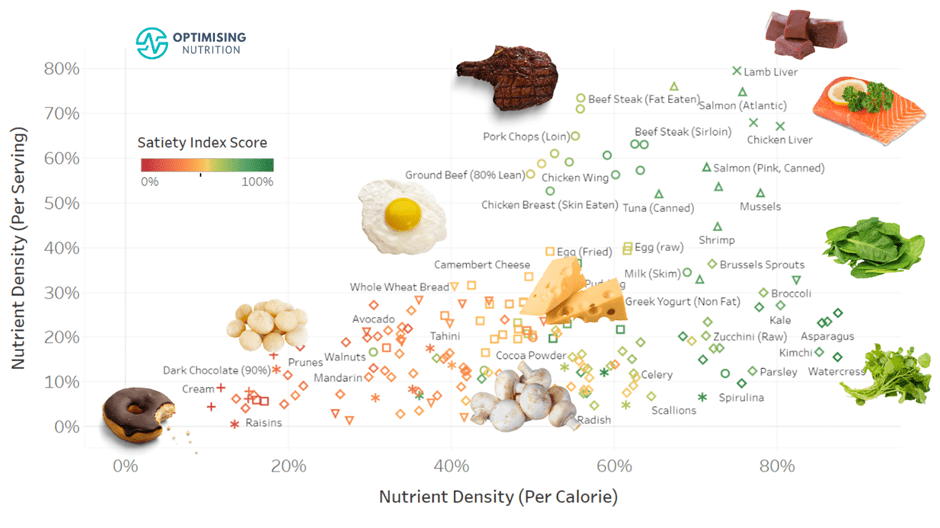
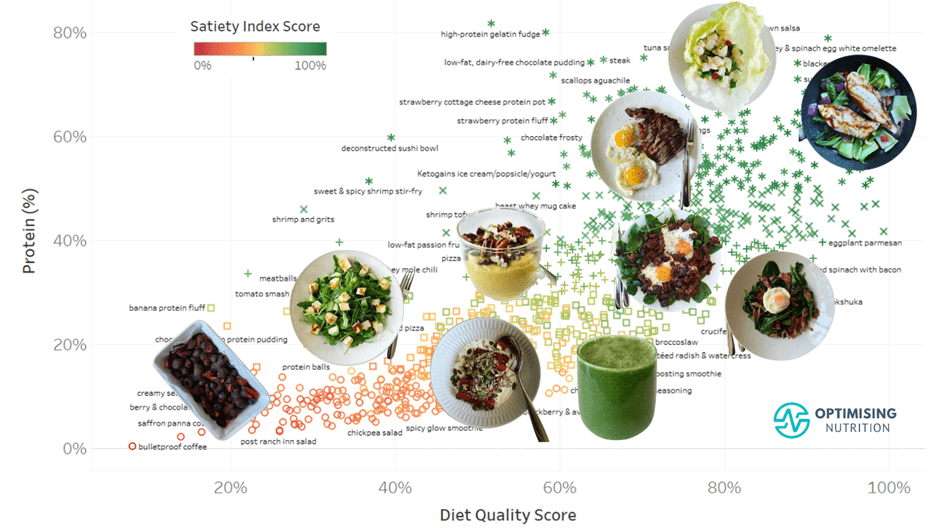
The chart below shows how this works using a range of popular foods.
- The horizontal axis is nutrient density (per calorie).
- The vertical axis is nutrient density (per serving).
- The colour coding is based on our Satiety Index Score.
- Foods in green have the highest Satiety Index Score and are harder to overeat.
- Foods in red towards the bottom left corner have the lowest Satiety Index Score and are easier to overeat.

For more detail, you can click here to dive into the interactive Tableau version on your computer. When you mouse over each point, you’ll see more info for each food. You can also use the tabs to see separate charts for animal-based foods, dairy, plant-based foods, and seafood.

The nutrient-dense foods towards the right of this chart contain a lot of nutrients per calorie. However, getting enough protein and energy from non-starchy veggies like spinach, asparagus, and watercress alone is hard. If you tried to only eat these foods, you’d find yourself craving energy-dense, nutrient-poor comfort foods — like the doughnut in the bottom left corner — before long. You also wouldn’t get a lot of nutrients because we don’t tend to eat these foods in large quantities.
Meanwhile, the foods toward the top of this chart provide more nutrients per serving. You can use these foods to build the foundation of your diet because they provide adequate energy and plenty of nutrients in the amounts we typically consume.
In our Macros Masterclass, we guide our Optimisers to prioritise foods towards the top of the chart to get adequate protein and energy to align with their goals. With the foundation in place, in our Micros Masterclass, Optimisers learn to prioritise more of the foods towards the right that fill their remaining micronutrient gaps and further increase satiety.
Overall, foods that contain more essential nutrients tend to have a higher Satiety Index Score. Thus, they satisfy our cravings more effectively than the nutrient-poor, low-satiety foods towards the bottom left.
If you’d prefer a simple printable list of optimal foods tailored to your goals and preferences, you can download our suite of optimised pdf food lists tailored for a range of goals (including maximum satiety) in our Optimising Nutrition Community.
To learn more about satiety and how we developed our revolutionary Satiety Index Score, read on!
The Food Satiety Index (1995)
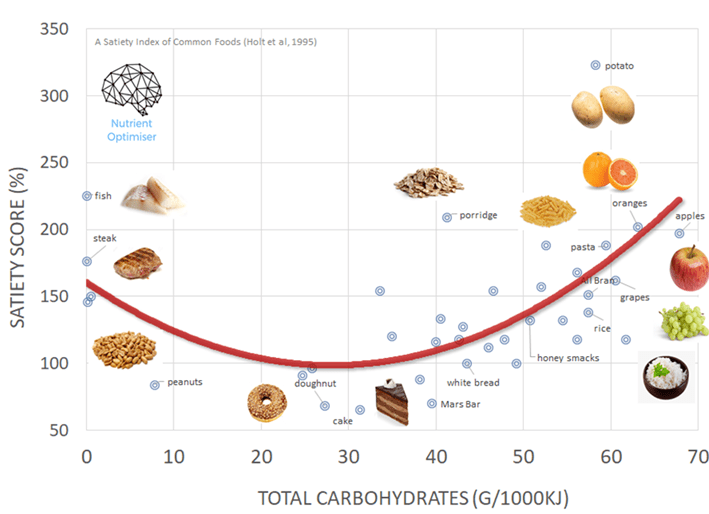
Given the critical importance of understanding our satiety response to food, little has been done to quantify it. Perhaps the most helpful study undertaken in this area thus far was A Satiety Index of Common Foods (Holt et al., 1995), performed by The University of Sydney in Australia.

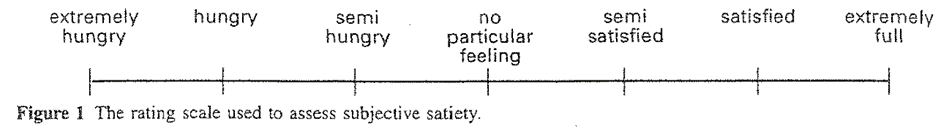
In this study, participants were fed 1000 kJ portions (239 calories) of 38 common foods. Researchers then measured subjective hunger and fullness every fifteen minutes over three hours, followed by how much they ate at a buffet.
In the Food Satiety Index, white bread was given an arbitrary score of 100%. So, any food that scored above 100% is relatively more satiating per calorie than white bread, and vice versa.
The results for the 38 foods are shown in the satiety index chart below. You can view the full satiety index list in the original paper here.
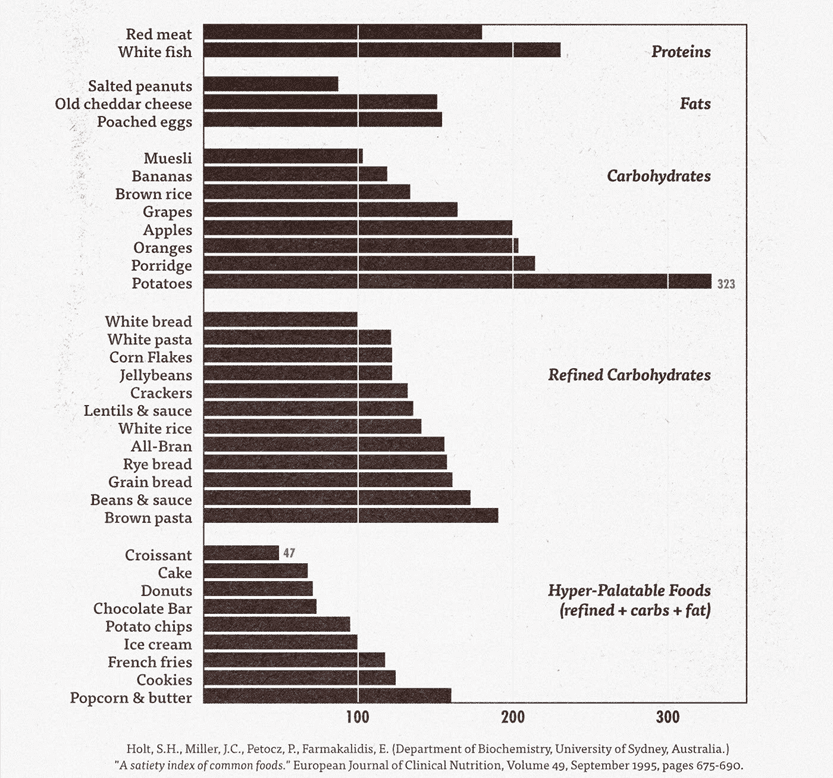
Unsurprisingly, processed carb-and-fat combo foods like croissants, cakes and doughnuts (shown towards the bottom of the chart above) scored poorly, while high-protein foods like meat and fish scored well.
But surprisingly, the cooked and cooled white potato (with no salt or oil) outperformed everything else with a score of 323! This off-the-chart value for the humble plain potato may be due to the satiety-inducing effects of resistant starch.
When I plotted the 38 data points, I found the following parameters aligned with greater satiety:
- lower energy density (i.e., fewer calories per gram of food);
- a higher protein %, or a higher per cent of total calories from protein;
- more fibre; and
- less fat.
But the satiety response to carbohydrates, starch, and sugar was not linear.
- Very high-carb, low-fat foods like rice, oranges, grapes, apples, or rice tended to be highly satiating during the three-hour test period.
- At the other extreme, low-carbohydrate, high-protein foods like meat and fish were also satiating.
- Meanwhile, foods that blend fat and carbs, like croissants, cake, doughnuts, and potato chips, had the lowest satiety scores.
Interestingly, in a 1996 follow-up paper, the same researchers noted that the foods that caused the most significant insulin and glucose responses led to the greatest satiety three hours after eating. This is because fast-acting carbohydrates rapidly top up the glucose reserves in your blood, liver, and muscles and send a full signal to your brain to stop eating until it can clear the excess energy.
That said, we also know that significant rises in glucose can lead to rapid glucose crashes before long, leading to greater hunger and overeating at the next meal. Rapidly falling glucose also makes you hungry, so you’ll likely eat again sooner. So, while you may be satiated in the short term, you may not achieve the long-term satiety you hoped for.

Overall, while intriguing, 38 data points are hard to draw robust conclusions from that we can use to apply to other foods and meals, especially given that this testing only quantified short-term satiation over the first three hours.
If only we had more data, perhaps we could make more sense of our satiety response to the various quantifiable properties of our food!
Nutrient Optimiser Data
In 2016 we stumbled on a dataset of 587,187 days of food diary records logged by nearly ten thousand MyFitnessPal users. Analysis of this data provided improved clarity on how each of the macronutrients — protein, carbs, fat and fibre — influences how much we eat.
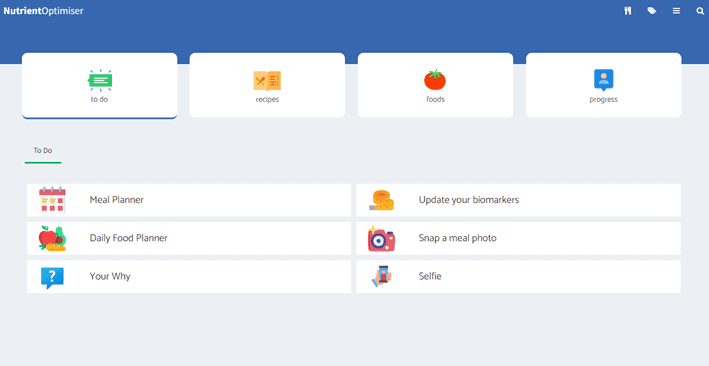
But in 2017, we created the Nutrient Optimiser app, which we use to guide our Optimisers to dial in their macronutrients and micronutrients in our Macros Masterclasses and Micros Masterclasses. In addition, many others have also taken our Free 7-Day Nutrient Clarity Challenge to identify the micronutrient gaps in their everyday diet and the foods and meals they can use to fill them.
We have now amassed 136,154 days of macronutrient and micronutrient data from 39,869 Optimisers worldwide.
Rather than simply measuring satiety and food intake after three hours in a laboratory, our Optimiser data gives an insight into how people eat in the real world for many days, weeks and months (not just three hours in a laboratory). This data allows us to understand how dietary patterns containing different mixtures of macronutrients and micronutrients contribute to helping us eat less or more!
As you will see, the analysis of this data gives us a robust insight into the long-term satiety response to the foods we eat.
Why Do We Eat?
Q: Why do we eat?
A: All organisms, including humans, constantly work to get the optimal balance of nutrients and energy they require from food.
This data analysis allows us to reverse-engineer our food and meal choices to achieve greater long-term satiety without overconsuming energy. In other words, it will enable you to get the most ‘bang for your buck’ to optimise your satiety, weight loss and metabolic health.
Foods and meals that pack in more essential nutrients per calorie satisfy our cravings and appetite with fewer calories. Rather than avoiding ‘bad’ things in food, these insights allow us to pack more of the good things we need. Rather than restriction and deprivation, we can change the nutrition paradigm to focus on nourishing our bodies with what they truly need—nutrients!
Why Do We Overeat?
In an environment where nutrients are diluted by excess energy from the hyper-palatable combination of fat and carbs, we have to eat more to get the nutrients we need. Unfortunately, changes in our food system over the past century have led to an influx of energy from highly processed carbs and fat and fewer nutrients we need to thrive.
As you can see in the chart below, the fat content in our food—mainly from industrial oils—has risen over the past century. Meanwhile, carbohydrates have been rising since the agricultural revolution in the 1960s. This hyper-palatable combination of fat and carbs provides more energy in our food system and dilutes the amount of protein and other nutrients. The end result is that our modern food provides less satiety per calorie.

Data source: USDA Economic Research Serving and Centres of Disease Control
For more on how our food system has changed, check out the article How the Biggest Trends in Nutrition Influence How We Eat Now.
What if Nutrition Was About Nutrients?
Unfortunately, most modern nutritional advice often revolves around what ‘bad’ things to avoid in the food we eat, like:
- cholesterol,
- saturated fat,
- salt,
- animal-based foods,
- fat,
- carbohydrates,
- anti-nutrients, or
- plant-based foods.
It seems everything we eat is out to kill us somehow, according to someone.
Commercial conflicts of interest, marketing, religious beliefs, and popular fad diets heavily influence our food choices. But, unfortunately, actively avoiding ‘bad’ things in food often leads us to low-satiety, nutrient-poor, ultra-processed food that we’re more likely to overeat. This is great for food manufacturers but not so good for our weight or metabolic health.
But once you give your body the nutrients it needs without excess energy, all the ‘bad’ things fall away and become irrelevant. When we emphasise the good things that we need from food (i.e., the essential nutrients), all the ‘bad’ things are crowded out.
Macronutrients
Most people are familiar with macronutrients (i.e., protein, carbohydrates, and fat).
A lot of disagreement in nutrition revolves around whether we should avoid fat or carbohydrates. But, as you’ll see, your carb vs. fat balance becomes irrelevant once you simply focus on getting adequate protein.
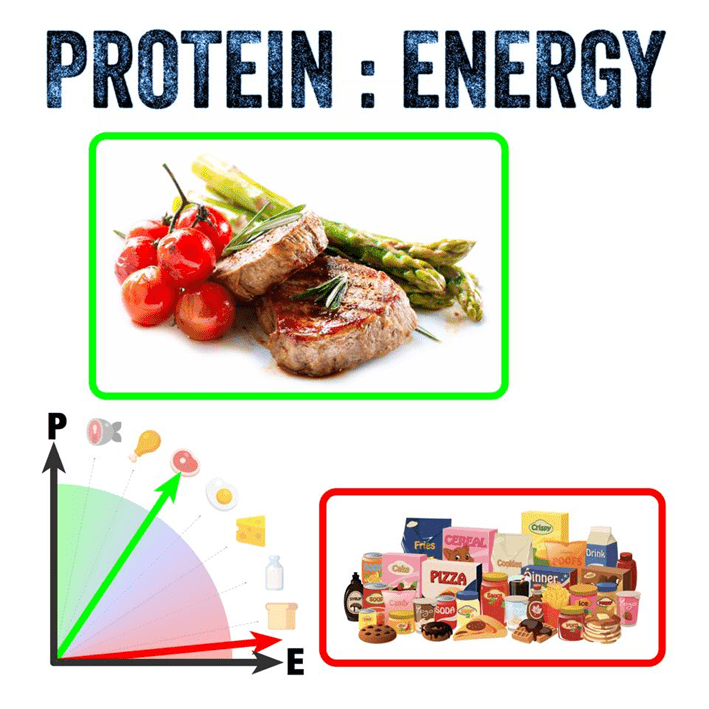
Protein Leverage
It’s well established in the literature that protein is the most critical food component driving satiety.
This is also demonstrated in the chart below, created from all our Optimiser data. To create this chart, we divided the daily food intake data into ten segments based on protein % and calculated the average calorie intake for each segment.
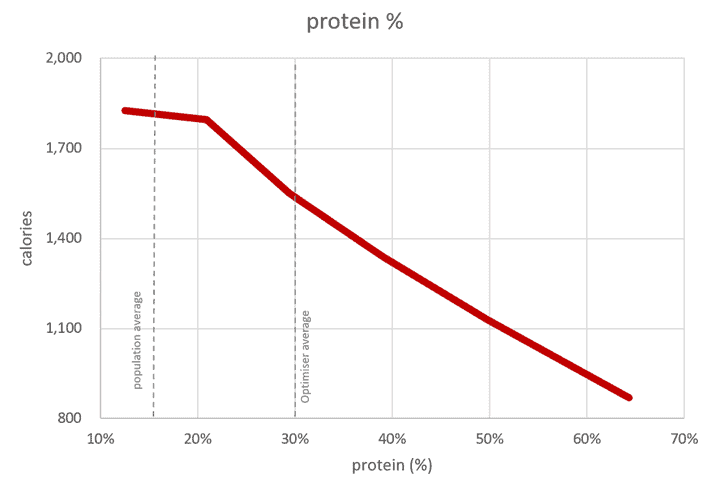
In this dataset, moving from the lowest protein per cent (13%), or per cent of total calories from protein, to the highest (64%) aligns with a massive 59% reduction in calorie intake!
Towards the left, you can see that the average population protein % aligns with the highest calorie intake. Ultra-processed foods that are low in protein are hard to resist when available, so we naturally gravitate towards a lower protein % diet.
In our Macros Masterclass, we find that it’s important to emphasise that it’s not simply about eating more protein. Instead, it’s better to focus on dialling back energy from fat and carbs while prioritising protein. This leads to an increase in the per cent of calories from protein.
It’s also important not to jump right into a super-high protein % and swing from one extreme to the other. Instead, you can think of protein % as a sliding scale. You only need to dial your protein % up (or down) enough to see the change you want. In our Macros Masterclass, we encourage Optimisers to nudge up their protein % just enough to achieve a steady 0.5-1.0% of weight loss per week.
The chart below shows protein % vs calories (blue line) and absolute protein intake in grams (red line) from our Optimiser data. Your protein intake will increase somewhat as you progressively dial up your protein %. This is important to increase satiety and prevent the loss of your precious lean mass during fat loss. However, it also coincides with a significant reduction in energy from fat and carbohydrates.

If you’re interested in learning how to find the balance between protein vs energy, check out:
- How Much Do You Need to Increase Your Protein % to Lose Weight?
- Calculating Your Target Macros: A Data-Driven Approach, and
- High Protein vs High Fat: What’s Ideal for YOU?
Our observations from the Optimiser data align with the work of professors David Raubenheimer and Stephen Simpson, who published their 2005 paper, Obesity: the protein leverage hypothesis, after they noticed a similar phenomenon regarding adequate protein consumption and satiety in slime, mice, insects, monkeys and humans. The following figure shows their compilation of data from human studies, which aligns nicely with the chart above.
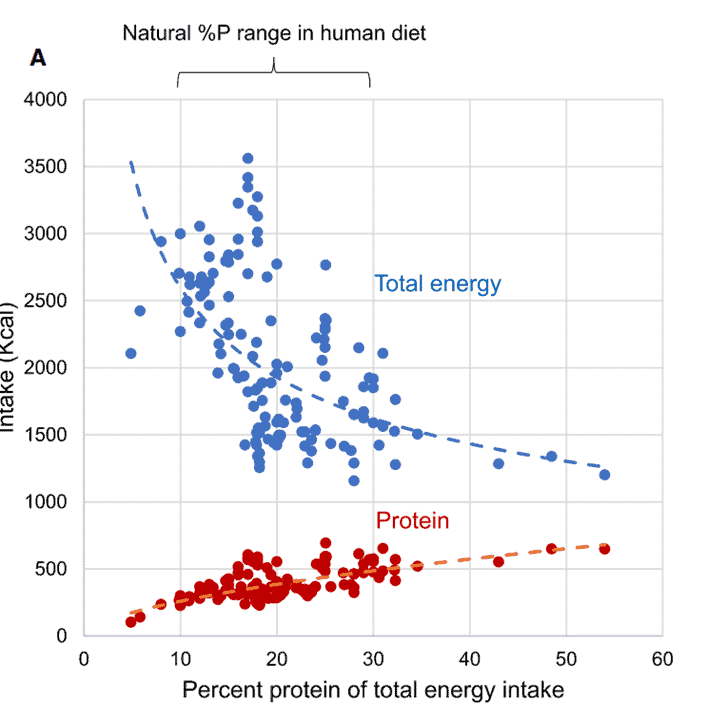
Figure from Protein Leverage: Theoretical Foundations and Ten Points of Clarification
To learn more about protein leverage, see:
- The Protein Leverage Hypothesis,
- The Carb-Insulin Hypothesis vs Protein Leverage Hypothesis of Obesity, and
- Protein Leverage | Professors Stephen Simpson and David Raubenheimer (podcast).
Satiety Response to Carbohydrates
Next, we come to carbohydrates.
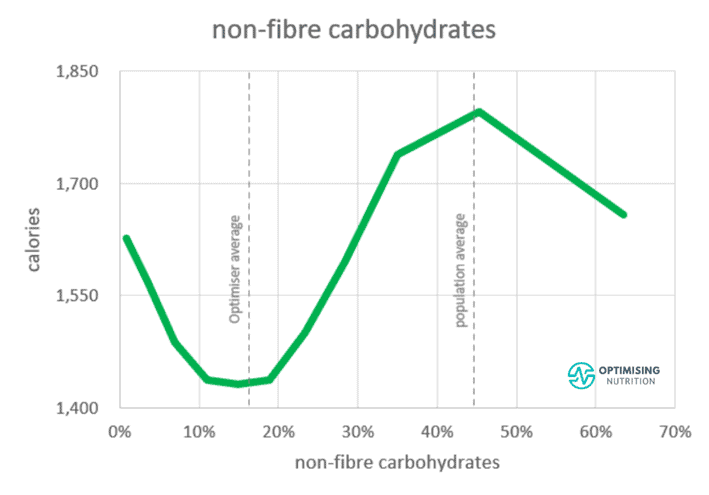
This is perhaps the most intriguing chart from this analysis, as we can see that:
- People eat the most when they consume a moderate carbohydrate diet with about 43% carbohydrates. Interestingly, this aligns with the average carbohydrate intake in the US and Australia, with most of the remaining energy coming from fat and a minimal amount from fibre and protein.
- Moving to a lower-carb diet (i.e., 10-20% carbohydrates) aligns with a reduction of 25% in calories. Reducing non-fibre carbohydrates eliminates most hyper-palatable ultra-processed foods and often increases protein intake.
- Towards the far left, we see that a very low-carb diet is not necessarily better for satiety than a lower-carb diet. We seem to have a specific appetite for each macronutrient (i.e. protein, carbs, and fat). Although our bodies can make glucose from protein, gluconeogenesis is an energy-intensive process, so your body would prefer to get at least a little glucose from the food you eat.
- Towards the far right, we see that people consuming more than 50% carbs and lower fat tend to consume less energy overall. It appears it’s hard to overeat carbs without added fat. As shown in the figure below, we also saw this trend in our analysis of half a million days of data from MyFitnessPal users.
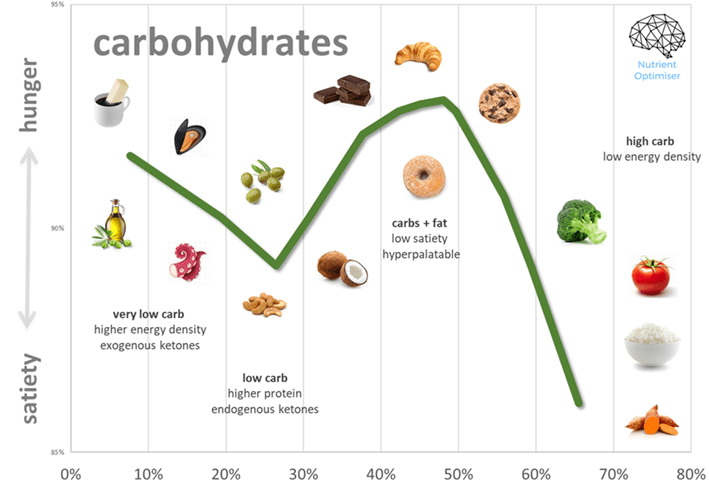
- Despite the limitations of the small dataset, our analysis of the Holt Satiety Index data also showed a similar trend, with the lowest satiety outcome aligning with carb+fat combo foods (as shown below).
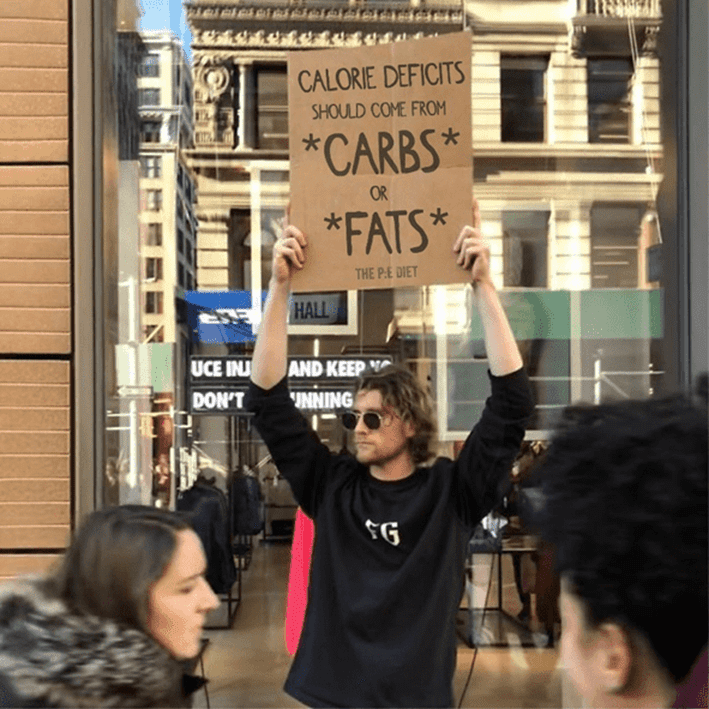
Overall, it seems that a low-carb or low-fat diet can improve satiety, so long as we stay away from the carb-and-fat danger zone.
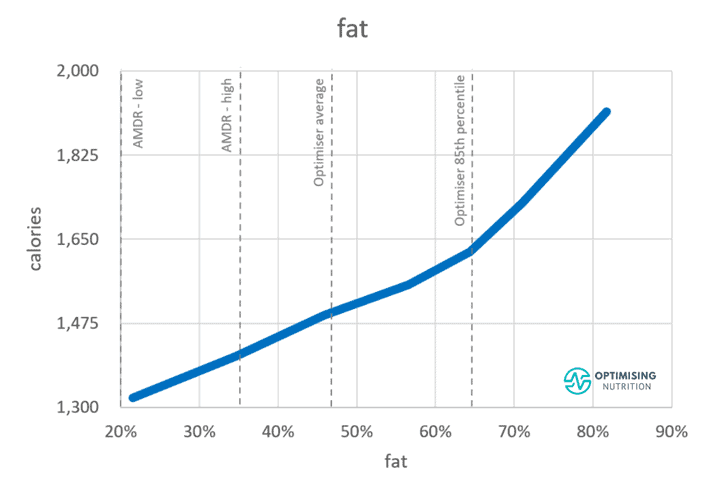
Satiety Response to Fat
Our analysis shows that a higher fat percentage aligns almost linearly with a higher energy intake. But because fat usually comes packaged with protein, so we can’t eliminate it.
To find the right macro balance in our Macros Masterclass, we guide Optimisers to:
- ensure they get adequate protein;
- reduce carbs if their blood sugar rises by more than 30 mg/dL (1.6 mmol/L) after eating to prevent reactive hypoglycemia; and
- use fat as a lever to get the energy they require or dialling it back if they want to lose body fat.
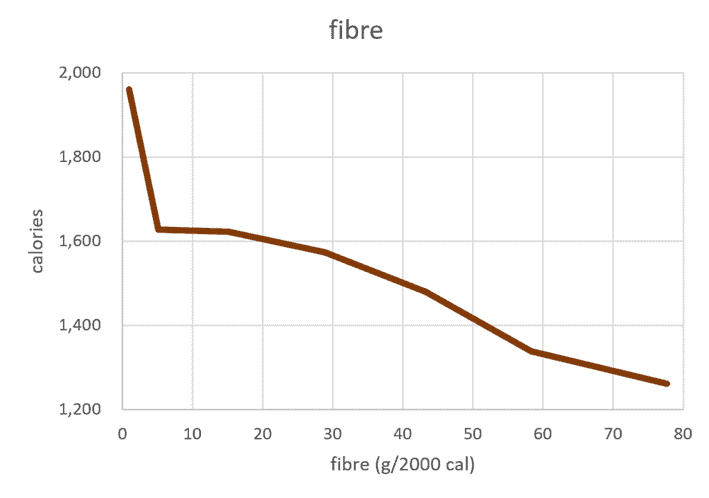
Satiety Response to Fibre
The analysis also showed that consuming more fibrous foods aligns with eating less. Higher-fibre foods tend to be whole foods that are digested more slowly and are harder to overeat.
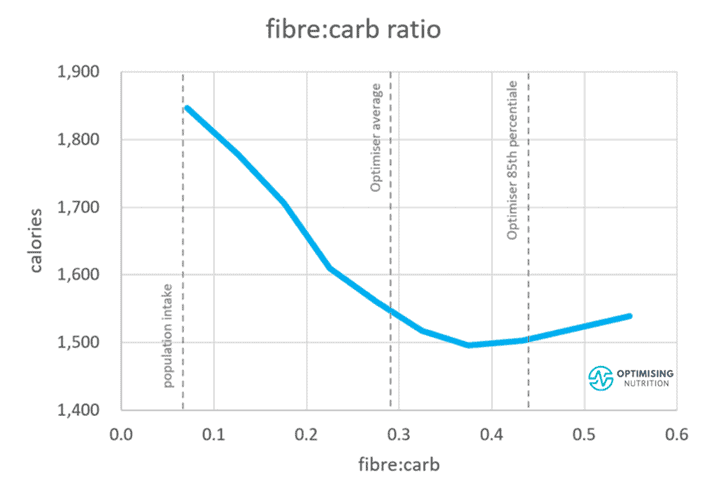
Rather than targeting the absolute fibre intake, you can also use the fibre:carb ratio. As shown in the chart below, we eat less when more of our carbohydrates are fibrous (e.g., when we eat non-starchy vegetables rather than refined flour and sugar.
In our programs, we don’t make a big deal of fibre because people chasing nutrients from whole foods tend to get plenty of fibre. However, foods that naturally contain more fibre also tend to have a higher nutrient density and a lower energy density.
For more, see Dietary Fiber: How Much Do You Need?
Multivariate Analysis
When I spoke with professors Raubenheimer and Simpson on my podcast, they suggested I run a multivariate analysis on our Optimiser data.
Multivariate analysis allows us to identify statistically significant variables in a complex system like our food matrix. While many factors correlate with eating less, multivariate analysis enables us to identify statistically significant parameters to focus on.
The table below shows the results of the multivariate analysis when we only consider macronutrients and fibre.
| Nutrient | Low | High | % |
| Protein (%) | 19% | 44% | -35% |
| Fibre (g/2000 cal) | 11 | 44 | -8% |
Note: ‘Low’ is the 15th percentile of the Optimiser data, while ‘high’ is the 85th percentile of the data for each parameter.
The multivariate analysis shows that when we consider macronutrients:
- moving from 19% to 44% protein aligns with a 35% reduction in calories;
- increasing fibre from 11 to 44 grams per 2000 calories reduces energy intake by 8%; and
- the balance of fat and carbohydrates is not statistically significant when we consider protein.
So, at the highest level, a diet prioritising protein and minimally processed whole foods that contain fibre and less energy from non-fibre carbohydrates and fat will provide greater satiety.
Specific Appetite
Before we dive into nutrient leverage and our satiety response to other nutrients, it’s worth touching on the concept of specific appetite.
Specific appetite (also known as specific hunger) refers to the desire or craving for a particular type of food or nutrient that the body needs to maintain proper functioning or to correct a deficiency.
The body’s appetite is regulated by physiological mechanisms that monitor its nutrient status and signal the brain to initiate specific food-seeking behaviours. For example, if the body is low on iron, it may crave red meat or other iron-rich foods. Similarly, if your blood glucose is low, you may crave sweets or sugary foods that quickly boost your blood glucose.
At the highest level, we tend to have an appetite to balance protein vs. energy by pairing complementary foods, like steak and egg, fish and chips, or bangers and mash.
The good news is that foods containing protein also tend to contain many other micronutrients. Our analysis of the Optimiser data shows that natural foods that contain more protein also tend to have riboflavin (B2), niacin (B3), pantothenic acid (B5), cobalamin (B12), potassium, selenium, cholesterol, and iron.
According to professors Raubenheimer and Simpson, animals—including humans—possess specific appetites for protein, carbohydrates, fat, and at least two micronutrients—salt and calcium. Their 2022 paper, An integrative approach to dietary balance across the life course, noted that specific appetites for other nutrients likely exist.
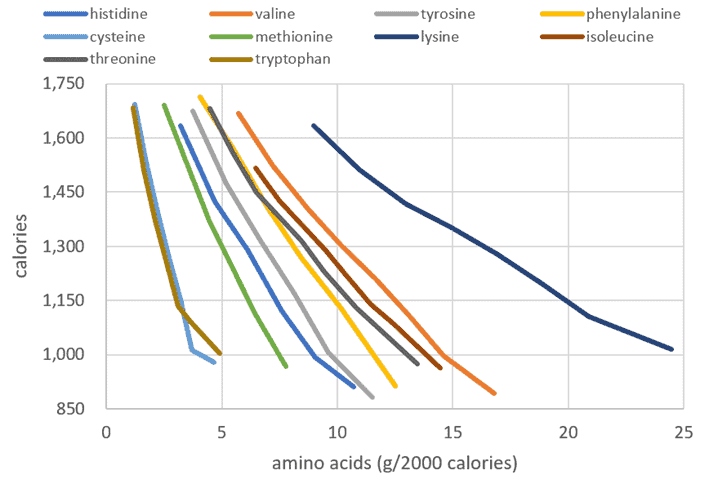
Various studies, like Solmns, 1969, Ganzle et al., 2016 and Beachamp et al., 2016, have shown that various amino acids have specific tastes. For example, glycine tastes sweet, while proline, isoleucine, and valine taste bitter. Glutamine provides an umami flavour, which is often added to processed foods (i.e., MSG) as a ‘protein decoy’ to make us eat more processed foods rather than foods that actually contain protein.
The figure below from our satiety analysis shows that consuming more of each amino acid per calorie aligns with eating less. Multivariate analysis of the amino acid data shows methionine has the most statistically significant correlation with eating less.
Salt—or sodium—is a mineral we have a robust conscious taste for. Thus, we crave it when we need more of it and stop adding salt once we get enough salt and our food tastes too salty. Ultra-processed food manufacturers exploit this phenomenon by adding salt to junk food. Hence we are often advised to minimise salt.
Calcium is another mineral that many believe we have an innate specific appetite for (Tordoff, 2001). We need adequate calcium to build our bones and move energy around our cells. We also need calcium for fluid balance, muscle contraction, and circulation.
We don’t seem to have a conscious taste for other minerals like potassium. According to experts like Dr Paul Jaminet, we evolved in an environment where salt was hard to obtain, and other nutrients like potassium were more plentiful in everything we ate, so we didn’t have to go out of our way to get it. But, as you will see, we seem to eat a lot less when we get plenty of potassium.
While we have an innate taste and craving for nutrients like protein and sodium, we can learn to associate the nutrients that alleviate deficiencies with the taste, texture and smell of foods that contain particular nutrients that we need more of (i.e., learned appetite).
Researchers like Dr Fred Provenza have shown that animals forage for just the right amount of complimentary nutrients and other substances from their food and associate taste with nutrients.
Provenza has also demonstrated that animals learn to associate a nutrient with particular flavours and seek out the flavours associated with the nutrients they are currently deficient in. However, this learned appetite is diminished in domesticated animals which subsist on fortified feed. This may also be the case in modern humans exposed to processed foods packed with flavouring, colours, and fortification that are designed to mimic nutritious food.
In the 1930s, paediatrician Clara Davis studied 15 newly weaned infants in an orphanage.. She gave them a wide range of weird and wonderful foods and noticed that each child selected various foods daily to meet their nutritional needs. This demonstrated what she called the wisdom of the body’. It seems we have an innate ability to seek out what we need.
In addition to an appetite for the nutrients we need more of, we can also have an aversion to foods that contain too much of a particular nutrient when we already have plenty (e.g., a food will taste ‘too salty’).
In their 2022 study, Micronutrients and food choice: A case of ‘nutritional wisdom’ in humans?, Mark Schatzker and Jeffrey Brunstrom set out to replicate Davis’s and Provenza’s work. They found that humans tend to select complimentary foods that provide greater micronutrient complementarity, demonstrating a variety seeking ‘nutritional wisdom’. However, once they had exceeded the daily recommended intake of a particular nutrient, participants preferred other foods that contained complementary micronutrients.
Nutrient Leverage
As we dug into the data, we noticed that getting more of each essential nutrient per calorie also aligns with eating less. So, given the intriguing research, I wondered if there may be a broader nutrient leverage effect rather than merely protein leverage.
With this data, we could perhaps identify the other nutrients we have an appetite for, either innate or learned, and use that information to satisfy our cravings for less energy.
The chart below shows the satiety response to all the minerals. While getting more of each of the minerals per calorie aligns with a lower calorie intake, larger macrominerals like potassium, sodium, and calcium tend to have a larger impact on calorie intake.
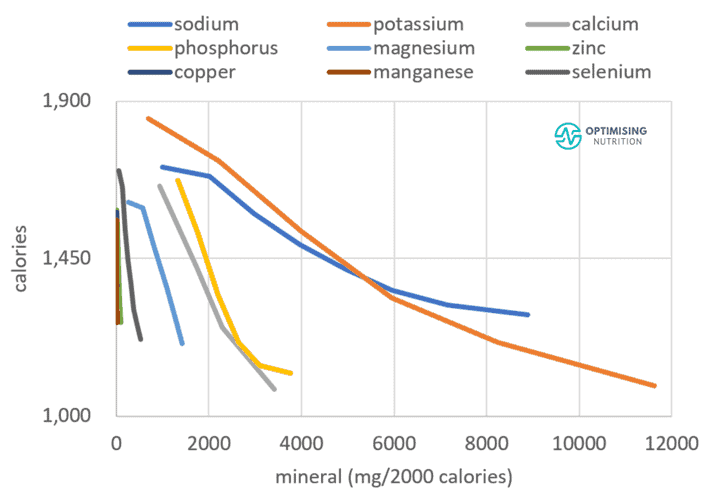
When we look at vitamins, we see a similar trend, although to a lesser degree. This smaller effect may be because vitamins are common in supplements and food fortification. Meanwhile, larger macrominerals like potassium and calcium are too large to be cost-effectively used in supplements and fortification.

While each essential nutrient correlates with greater satiety, we are unlikely to simultaneously have dominant appetites for all the micronutrients. Additionally, we won’t crave a particular nutrient if we already get plenty of it.
Multivariate Analysis (with Cholesterol)
To understand if micronutrients have an impact on how much we eat, we ran a multivariate analysis on the Optimiser data. The table below shows the results of the multivariate analysis when we consider each macronutrient, essential mineral, vitamin, and cholesterol.
| Nutrient | Low | High | % |
| Protein (%) | 19% | 44% | -21% |
| Cholesterol (g/2000 cal) | 0.2 | 1.1 | -12% |
| Fibre (g/2000 cal) | 11 | 44 | -9% |
| Potassium (g/2000 cal) | 1.9 | 5.9 | -6% |
| Sodium (g/2000 cal) | 1.5 | 5.1 | -5% |
| Calcium (g/2000 cal) | 0.5 | 1.9 | -4% |
Cholesterol
The most surprising finding from this multivariate analysis is that consuming foods with more cholesterol—like eggs and liver—has a statistically significant relationship with eating less. When all other nutrients are considered, moving from 0.2 to 1.1 grams of cholesterol per 2000 aligns with a 12% reduction in energy intake.
The chart below shows that people eating foods containing more cholesterol per calorie tend to eat less.
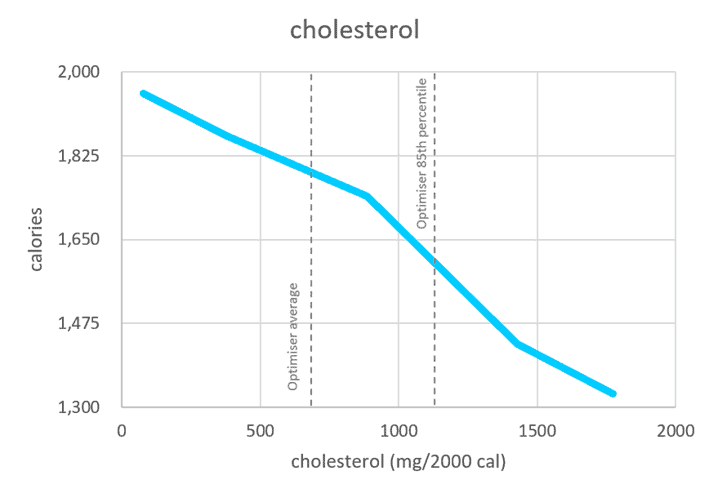
Interestingly, dietary cholesterol in our food system has declined since the 1950s, while obesity has continued to rise.

It’s important to clarify that the benefits of cholesterol come from eating more nutrient-dense foods that happen to contain it. In other words, you probably won’t get the same effect from guzzling MCT oil or eating globs of butter!
Until recently, dietary cholesterol was considered a nutrient we should avoid. However, this recommendation was removed from the US Dietary Guidelines in 2015 after extensive research, as it was found that dietary cholesterol did not play a role in cardiovascular disease.
It’s also intriguing to note that the satiety impact from protein decreases from 35% to 21% when we include cholesterol in the multivariate analysis. So perhaps some of the leverage effect we’ve attributed to protein is actually from cholesterol.
Cholesterol is not considered an essential nutrient because our livers make most of what our bodies require. Whether or not we have a specific appetite for cholesterol, this analysis suggests that avoiding otherwise nutritious foods like meat, eggs, and liver that naturally contain cholesterol may lead us to consume lower-satiety foods.
For more on dietary cholesterol, see:
- Dietary Cholesterol and Blood Cholesterol: Are They Related?
- Cholesterol: When to Worry and What to Do About It, and
- Is Tufts University’s Food Compass Nutrient Profiling System ‘Broken’?
Calcium
As the satiety analysis chart below shows, Optimisers consuming more calcium per calorie tend to eat fewer calories. However, our cravings for calcium seem to taper off once we get enough or when our cravings are satisfied.
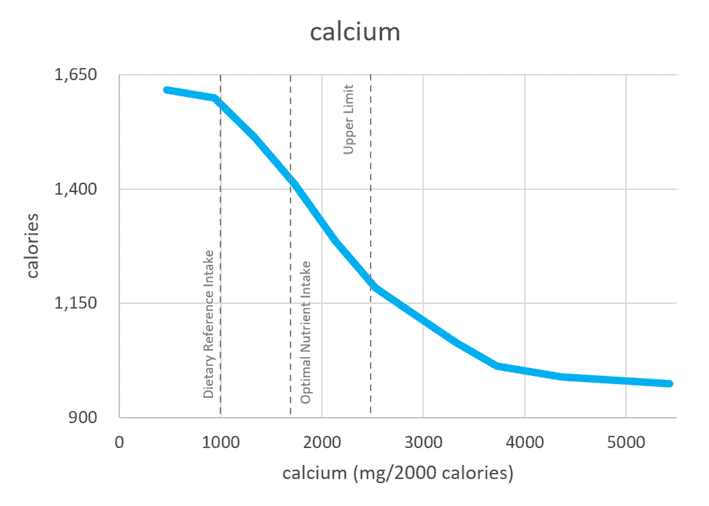
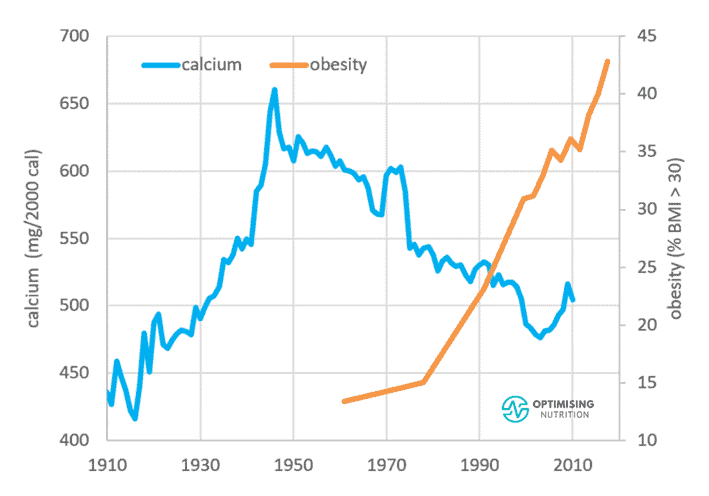
The calcium content of our food system has also declined since the 1950s. As a result, we must consume 38% more energy to get the same amount of calcium as we did in the 1940s. So, it makes sense that we may have a strong appetite for calcium because we’re getting less than we need today.
Sodium
Optimisers who consume more sodium per calorie consume fewer calories.
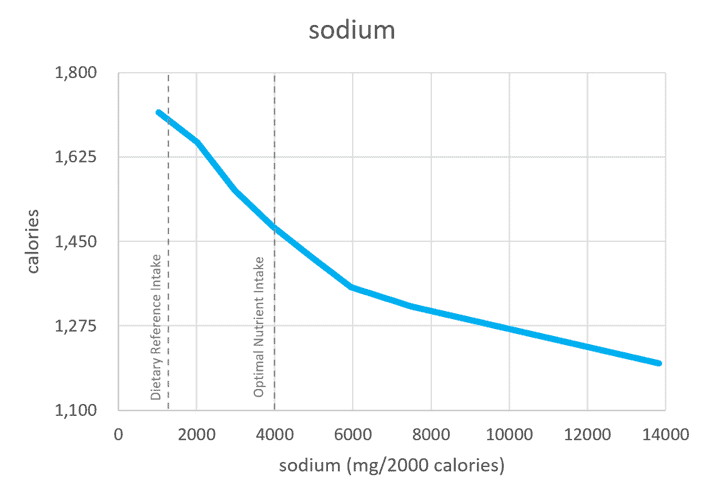
Sodium is another nutrient that has decreased in our food system. We need to consume 58% more of the foods we eat today than in the 1960s to get the same amounts of this nutrient.

Potassium
It’s relatively easy to add salt to taste. But unfortunately, most people aren’t getting enough potassium to balance their sodium.
The multivariate analysis indicates that we may have the strongest innate cravings for potassium. Unfortunately, it’s also estimated that 98% of Americans do not meet the minimum DRI for potassium.
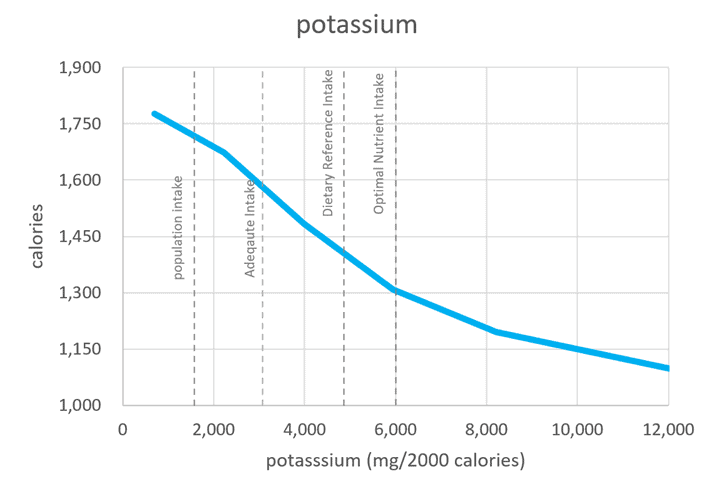
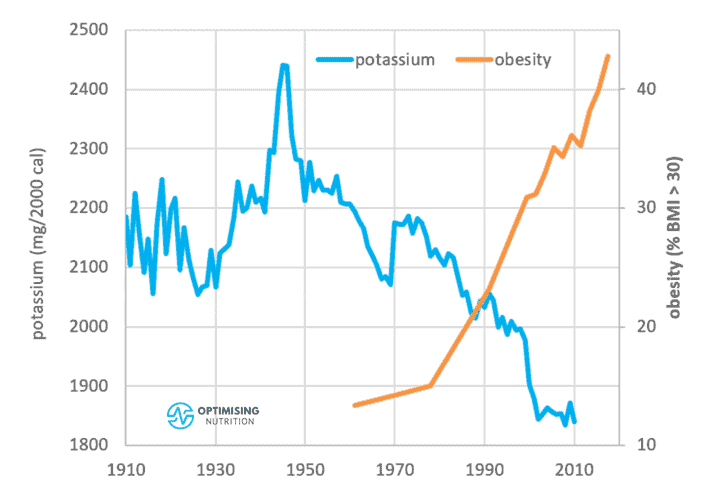
The amount of potassium available in our food system has seemingly decreased as we’ve become reliant on synthetic fertilisers to make our crops grow more quickly. As a result, our soil health and its nutrient content have diminished, and we now must consume 33% more calories to get the same amount of potassium as we did in the 1940s!
While we don’t have a conscious taste for potassium, this data suggests we may have a learned appetite for potassium. Or at least, we tend to eat less when we consume foods that contain more potassium per calorie.
This observation aligns with the 2019 study, Increment in Dietary Potassium Predicts Weight Loss in the Treatment of the Metabolic Syndrome, which showed that more dietary potassium aligned with greater weight loss. Regardless of the mechanism, once you’ve covered your protein requirement, ensuring your diet contains plenty of high-potassium foods and meals seems wise.
Multivariate Analysis (without Cholesterol)
Unfortunately, cholesterol is not always measured in food. Moreover, I’m not sure the world is ready for a food satiety ranking system that uses cholesterol as a positive ranking factor. So, I re-ran the multivariate analysis without cholesterol.
| Nutrient | Low | High | % |
| Protein (%) | 19% | 44% | -31.6% |
| Potassium (g/2000 cal) | 1.9 | 5.9 | -4.7% |
| Fibre (g/2000 cal) | 11 | 44 | -4.5% |
| Sodium (g/2000 cal) | 1.5 | 5.1 | -2.7% |
| Calcium (g/2000 cal) | 0.5 | 1.9 | -2.6% |
| Vitamin B5 (mg/2000 cal) | 4 | 15 | -1.1% |
| Folate (mg/2000 cal | 167 | 956 | -0.4% |
In this scenario, we see that protein still dominates while potassium, sodium, and calcium still elicit a significant satiety response. This iteration also shows that pantothenic acid (B5) and folate (B9) make a small contribution to the satiety equation.
While protein still dominates the satiety equation by potentially decreasing your energy intake by 32%, prioritising dietary potassium, fibre, sodium, calcium, vitamin B5, and folate can shave off another 16%!
Satiety Index Score
The multivariate analysis of the Optimiser data provides regression coefficients for each nutrient. This allows us to estimate how much we would eat of a particular food or meal based on its macronutrient and micronutrient profile.
From this, we have developed an updated food satiety index to apply to any food or meal! For simplicity, foods are ranked from 0 (least satiating) to 100 (most satiating).
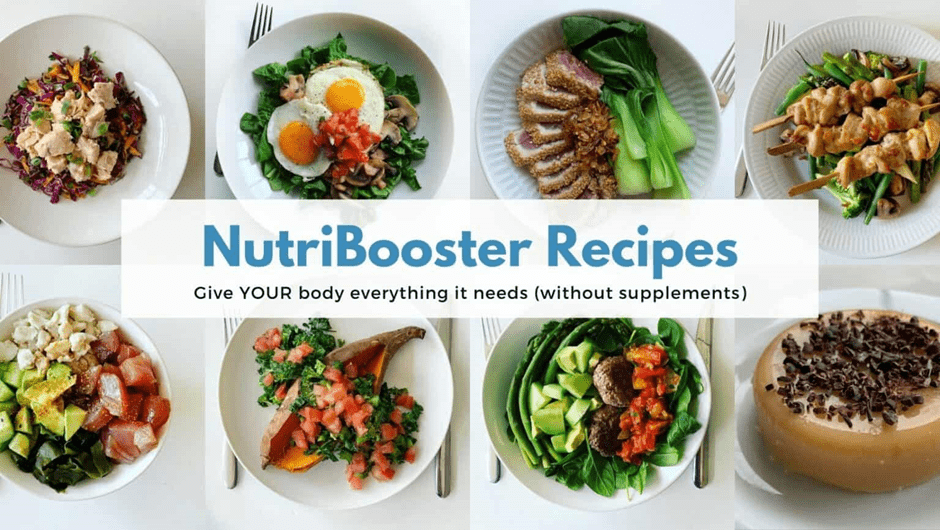
Highest Satiety Recipes
To demonstrate how the Satiety Index Score works in practice, the chart below shows 1400 recipes from our NutriBooster recipe books that our Optimisers can use in our Macros Masterclasses and Micros Masterclasses. Again, the recipes shown in green have a higher Satiety Index Score, while those in red have the lowest.
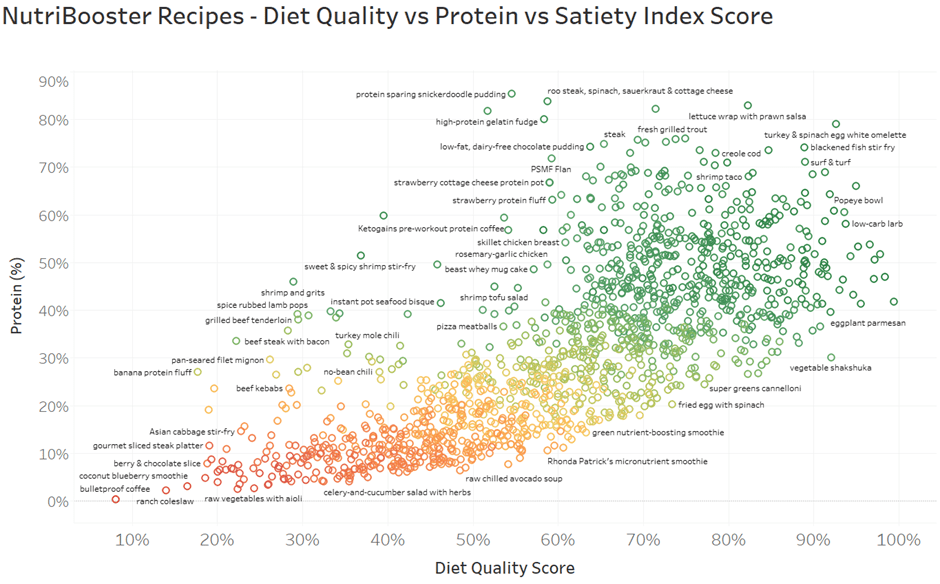
Overall, a solid alignment exists between satiety, nutrient density, and protein %. You’ll experience greater satiety and better nutrient density if you prioritise protein. Conversely, you’ll also get plenty of protein and higher satiety if you prioritise nutrient density.
You can dive into the detail of this chart to learn more about the recipes by opening the interactive Tableau version on your computer. If you click on each point, you’ll see a popup with more details, including links to view the recipe.
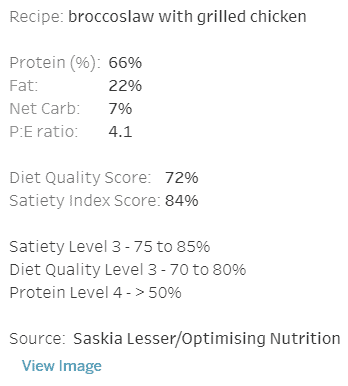
In the next version of the chart, I’ve shown where a handful of the NutriBooster recipes sit. The most satiating and nutritious recipes tend to be lean seafood with some non-starchy veggies followed by meat and eggs. In the lower corner, we have more energy-dense, lower-protein recipes that might be appropriate if you need more energy to support growth or activity.
If you’re interested, you can learn more about our suite of NutriBooster recipe books here. If you’re already part of our Optimising Nutrition community, you can download samples of each NutriBooster recipe book here.
Satiety FAQs
Before we finish, let’s touch on a few common questions that arise around the topic of satiety.
What is Satiety vs Satiation?
It’s important to understand the difference between satiety and satiation.
- Satiation occurs when we feel full after eating and no longer want to eat in the short term. While some bulky, high-volume, low-energy-density foods might make you feel ‘stuffed’ in the short term, you may not achieve long-term satiety, so you’ll be seeking out more food before too long.
- In contrast, satiety refers to how full we feel over the longer term and occurs when we obtain enough of all the essential nutrients we require, particularly protein and macro minerals like potassium, calcium, and sodium. People who eat more satiating foods that contain these nutrients can trust their appetite to guide them when they need to eat again.
To be clear, any study that tests hunger three hours after eating only measures short-term satiation, not long-term satiety. While it’s a bonus to experience short-term satiation, you need to achieve long-term satiety to lose weight and improve your metabolic health with less hunger over the long term.
Does Energy Density Matter?
Various studies have shown that foods with a lower energy density tend to be harder to overeat in the short term (i.e., they are satiating). However, taken to the extreme, very low-energy-density foods simply contain more added water to reduce their energy density. A big glass of water will only keep you feeling full for so long!
Unfortunately, very low energy-density foods and meals often don’t contain significant amounts of protein and the minerals that satisfy our cravings for longer.
Energy density is also hard to measure in the real world. Because we can’t easily measure the volume of food without dunking it in water and measuring the amount displaced, weight is used as a proxy.
Overall, foods and meals with a higher Satiety Index Score tend to be lower in fat and higher in fibre, so they will have a lower energy density than ultra-processed foods. We evaluated energy density in the multivariate analysis but found that it is not statistically significant in the satiety equation once the other factors mentioned above are considered.
For more info, see:
- Energy Density vs Protein % for Satiety and Weight Loss
- Low Energy Density Foods and Recipes: Will They Help You Feel Full with Fewer Calories?
Ultra-Processed Foods
Ultra-processed foods (UPFs) have become more prevalent in our food system due to their taste, cost, convenience, and profit margin.
Ultra-processed foods tend to contain a blend of ingredients and often need artificial flavours, colours, and fortification to make them palatable. The NOVA classification system is typically used to define ultra-processed foods.
While we should ideally minimise these ultra-processed foods, prioritising foods with more essential nutrients that align with greater satiety will automatically eliminate UPFs without adding other subjective factors.
For more detail, see Ultra-Processed Foods: What’s the Problem and How to Avoid Them.

Hedonic Factors and Addiction
In Supra-Additive Effects of Combining Fat and Carbohydrate on Food Reward, Professor Dana Small and colleagues showed that consuming fat and carbs elicits a dopamine response to reinforce energy consumption and ensure survival. When we combine fat and carbs, we get a ‘supra-additive dopamine response’, which can leave us feeling ‘addicted’ to these fat-and-carb combo foods.

When we looked at the properties of food that align with eating more, we found that sugar, saturated fat, starch, and monounsaturated fat correlate with eating more.
| Nutrient | Low | High | % |
| Sugar (g/2000 cal) | 11 | 71 | 6.7% |
| Saturated Fat (g/2000 cal) | 20 | 61 | 16% |
| Starch (g/2000 cal) | 0.8 | 48 | 11% |
| Mono Fat (g/2000 cal) | 16 | 53 | 13% |
We all need some energy to survive. There’s generally no issue with minimally processed foods that provide energy mainly in one of these forms (e.g., saturated fat in meat, monounsaturated fat in nuts, starch in potatoes, and sugar in fruit). However, when we isolate and refine these energy sources and combine them in ultra-processed foods, we create a supra-additive dopamine response that makes us want to eat (and buy!) more of them.
Rather than only prioritising the good properties of food, we can also consider the ‘bad’ things that align with overeating, as shown in the multivariate analysis results below.
| Nutrient | Low | High | % |
| Protein (%) | 19% | 44% | -19.5% |
| Cholesterol (g/2000 cal) | 0.2 | 1.1 | -10.6% |
| Fibre (g/2000 cal) | 11 | 44 | -10.2% |
| Potassium (g/2000 cal) | 1.9 | 5.9 | -6.4% |
| Sodium (g/2000 cal) | 1.5 | 5.0 | -5.0% |
| Folate (mg/2000 cal) | 167 | 956 | -3.0% |
| Selenium (g/2000 cal) | 72 | 295 | -1.1% |
| Vitamin B2 (mg/2000 cal | 1.0 | 5.0 | -0.7% |
| Calcium (g/2000 cal) | 469 | 1869 | -0.5% |
| Starch (g/2000 cal) | 1 | 50 | 4.0% |
| Mono fat (g/2000 cal) | 16 | 52 | 4.9% |
At the bottom of the results table, we see that starch and monounsaturated fat align with eating more when considering the other factors.
One potential benefit of this analysis scenario is that it puts a little less emphasis on protein and highlights other beneficial nutrients like folate, selenium, and vitamin B2. It also shows us that we should avoid foods that contain starch and monounsaturated fat together, which are rarely found alongside one another in whole foods.
However, this system is less resilient because these other parameters like sugar, saturated fat, starch, and monounsaturated fat are not always measured in food. Despite the added complexity, it makes a negligible difference to the Satiety Index Score.
For more detail, see Ultra-Processed Food: Modelling The ‘Hedonic Factor’.
Sensory Specific Satiety
Sensory-specific satiety is a phenomenon in which an individual’s appetite for a particular type of food decreases as they continue to consume it. As you eat more of a particular kind of food, you begin to feel less pleasure and may feel full or even repelled by it while still being able to eat other foods.
Based on what we understand about our cravings for nutrients, sensory-specific satiety may be occurring because we get our fill of the nutrients we require from one food. Thus, we are more interested in other foods that contain the nutrients we still require more of.
Is High Satiety Eating Low Carb or Low Fat?
High-satiety meals tend to be lower in energy from both carbs and fat. This helps to stabilise blood glucose levels and draw down excess glycogen from your liver while also allowing your body to use your stored body fat. Looking at the top 100 NutriBoosters Recipes when sort by our Satiety Index Score, we see that they contain, on average 15% non-fibre carbohydrates and 27% fat.
Can I Just Take a Supplement?
Unfortunately, you can’t simply supplement your way to satiety.
- Protein powders can be helpful if you need to grow and recover from a lot of intense activity. However, they are heavily processed and effectively pre-digested, meaning they don’t provide the same satiety value as whole-food protein sources. They also have a lesser nutrient profile and are usually flavoured to make them hyper-palatable to eat more of them.
- Potassium supplements are generally limited to 99 milligrams per serving because they can affect heart function if taken in excess, particularly for people on blood pressure medications. Many of these medications work to help your kidneys retain potassium more effectively. Whole food sources of potassium also come packaged with fibre, vitamins, and minerals that contribute to the satiety equation.
- While diets rich in calcium protect against heart disease, calcium supplements can have adverse effects (Sunyecz, 2008, Reid et al., 2010, and Bolland et al., 2017).
- Sodium is easy to add to your food if you salt to taste. Unless you’re an athlete who sweats a lot, most people don’t need more than 4 grams per 2000 calories. In our Micros Masterclass, most people find they need to focus on balancing sodium with adequate potassium rather than adding more sodium.
- Vitamin fortification and supplementation are prevalent because vitamins are small and cheap relative to the larger macrominerals that provide the greatest satiety responses. Our satiety analysis shows that very high vitamin intakes tend to lead to a ‘rebound satiety’ because adding vitamins to processed foods or a multivitamin to an otherwise nutrient-poor diet does not help. It may also be possible that vitamins in fortified products decrease our cravings for nutritious foods like meat and seafood, which naturally contain an array of vitamins. For more details, see Nutrients: Could You Be Getting Too Much of a Good Thing (from Supplements and Fortification)?
Satiety Hormones
A range of hormones like GLP-1, CCK, PYY, ghrelin, insulin and leptin play a fascinating and complex role in signalling hunger and satiety. Unfortunately, we don’t know a lot about how these hormones interact and which foods manipulate each hormone to provide the desired response.

But if you’ve made it this far, you may not be surprised to learn that GLP-1, our primary satiety hormone, tends to be influenced by nutritious food (Girous, 2016).
Recently, there has been a lot of interest in expensive drugs that artificially mimic GLP-1 in our bodies to manipulate satiety without the nutrients that naturally stimulate it. But we can make plenty of GLP-1 in our body (for free!) if we prioritise the nutrients we require in the food we eat. For more, see Weight Loss Drugs: Does Satiety Now Come in a Needle?

Will This Work for Everyone?
The satiety analysis detailed above is based on data from forty thousand people from across the world who follow a wide range of dietary patterns, so it’s likely to be quite robust.
Due to the decline of nutrients like protein, potassium, and calcium in our food system thanks to the advent of industrial agriculture fuelled by synthetic fertilisers, the priority nutrients are likely similar for most people (i.e., protein, potassium and calcium).
However, it’s also worth noting that our Optimiser data is from people who, on average, follow a lower-carb diet (16% net carbs) with a higher protein % than average (30% protein).
We anticipate that the precise satiety equation would be unique for each individual based on their current diet. For example, someone following a strict vegan diet would have different priority nutrients that could increase their satiety compared to someone following a carnivorous diet.
In our Micros Masterclass, we guide Optimisers to track their diet and use it to identify their unique micronutrient fingerprint. The example shows that nutrients towards the top of the chart, like calcium, vitamin E, thiamine, iron, and vitamin D, need to be prioritised. On the other hand, we can see that they’re getting plenty of vitamin K1, B12, and amino acids towards the bottom of the chart. The vertical black line represents the Optimal Nutrient Intake, a stretch target for each nutrient.

In our Micros Masterclass, Optimisers use Nutrient Optimiser to identify foods and meals that provide more of their priority nutrients to balance their diet at the micronutrient level.
To identify your priority nutrients and the foods and meals that will fill the gaps, you can take our Free 7-Day Nutrient Clarity Challenge. Not only will you learn more about your diet, but you’ll also help us build our database to make this analysis even more robust in the future.
While optimising your diet at the micronutrient level is the pinnacle of Nutritional Optimisation, tracking and fine-tuning your diet takes a little work. Most people find it easier to start their journey of Nutritional Optimisation by using our optimised food lists and NutriBooster recipe books tailored to their preferences and goals.
Summary
- Satiety is the absence of hunger that occurs after eating. To lose weight and improve your metabolic health over the long term without unbearable hunger, you need to increase the satiety value of the food you eat per calorie.
- All organisms work to balance the nutrients versus energy from food. As a result, we tend to consume more energy to get the nutrients we need in an environment where the nutrient content of our food is diluted by energy from excess fat and carbohydrate. Conversely, we tend to eat less when prioritising foods that contain more protein and other critical nutrients at the expense of less energy. (i.e., a more nutrient-dense diet)
- Rather than merely protein leverage, there appears to be a nutrient leverage effect. Our analysis of one hundred and forty thousand days of data from forty thousand people shows that protein %, potassium, fibre, calcium, and sodium are statistically significant parameters in the satiety equation that have the greatest influence on satiety. Based on these insights, we have developed a Satiety Index Score that we can apply to any food or meal.
- Our satiety analysis allows us to reverse-engineer food and meal choices to identify the nutrients that provide greater satiety per calorie. These foods and meals naturally increase beneficial satiety hormones, enabling people to experience less hunger. Thus, they allow us to achieve sustainable weight loss.
More
- Protein Power: Visualizing 30g in Everyday Foods
- High Satiety Index Foods: Which Ones Will Keep You Full with Fewer Calories?
- Highest Satiety Index Meals and Recipes
- Satiety: How to Lose Weight with Less Hunger
- How to Maximise Satiety Per Calorie
- Iron Rich Foods and Meals
- One Nutrient Density and Satiety Chart to Rule Them All
- Ultra-Processed Foods: What’s the Problem and How to Avoid Them
- The Surprising Science Behind Thriving with Less Food
- Weight Loss Drugs: Does Satiety Now Come in a Needle?
This is anecdotal but a large, 300 calorie bowl of oatmeal leaves me feeling stuffed for hours. So does a healthy serving of microwaved potatoes with some butter or sour cream.
That certainly aligns with the Holt and the MFP data.
Legumes:
High in protein
High in fiber
Moderate carb, very low-fat (and hence not carb+fat)
Fiber-Carb ratio superior to most carb-foods except non-starchy-veg
Protein-Carb ration superior to most carb-foods
Cheap
Climate friendly
Eaten by centenarian populations.
Supported by research
Highly satiable.
Why is Legumes, being highly satiable, and with a low glycemic load (particularly lentils), usually ignored in Primal/Low-carb/Ted Naiman etc..?
For those wanting to limit animal foods and/or animal protein, for budgetary, climate, or health concerns, without sacrificing much in terms of nutrient density, is it not an excellent food?
Anecdotally, I enjoy legumes greatly, and feel much, much better after eating legumes as opposed to any grain, even the most fibre-rich, whole grain products. It will keep me in or close to “the keto zone”, meaning I feel the mental benefits I find when going very low carb. And, cooking, with a pressure cooker, most phytic acid is removed, digestive issues reduced, cooking time reduced.
To repeat myself.
Why do we not hail the legumes?
In my analysis legumes make the shortlist if you want to eliminate animal based foods. However animal based foods tend to be more nutrient dense (not to mention bioavailable).
My worry would be the effect of animal protein-centered diet of long term health and mortality. Centenarian populations have low levels of animal protein in their diet.
Personally I have some animal protein (eggs, canned mackerel, chicken, lots of different animals/fish), with every meal, but filling up the plate also with legumes (lots), ultra-fibre-rich-grains (a little bit), and vegetables, gives me fibre, and still a relatively low rise in blood sugar. If I swap most of the legumes and grains for more animal protein I wory I will die earlier.
Regarding protein source, most article (abstracts) i´ve read conclude that replacing some of the animal protein with plant protein will increase lifespan. Now, I´m not arguing the vegan case, but I am convinced that getting a fair share of your protein from plant sources, legumes in particular, is a good strategy for maximizing life span. And maybe health too.
Thank you for your response. And thank you for your great work.
Why do we not hail the legumes?
1. allergens
2. lectins
3. IBS/IBD/Crohn’s patients cannot handle these types of carbs, as they tend to ferment in the gut
In the case of soy, it is a known hormone disruptor–and that includes ALL the hormones (thyroid, sex, insulin, etc.). In menopausal people, soy invites cancer–it may not affect ALL menopausal people, but some.
Even if you were to “cook them correctly” (soak and boil–according to Weston A. Price methods), these items remain.
This is why I, for one, do not hail the legumes.
Great work Marty, btw, what about Food Insulin Demand (FID) compare to Food Insulin Index (FII)? Is there are newest FID list added?
Thanks
Did the sugar intake really go down after 1999? In reading the book “The case against Sugar” the author argues that the food and drug administration now report sugar based on amount of sugar consumed minus what it estimates got thrown out. Thus making comparisons to previous years unreliable.
There’s more detail in this post. Loss adjusted data tells the same story when you look from the 1970s. https://optimisingnutrition.com/2018/09/22/nutritional-myth-busting/