
This section of the Micros Masterclass FAQs details why we believe nutrient density is critical to empower you to cut through the noise in the nutrition space and optimise your diet.
The amount of calories we consume has increased significantly over the past half-century. However, the amount of nutrients in the food we eat has decreased. Because your body needs adequate amounts of the essential nutrients to thrive, your appetite compensates by driving you to eat more food.
However, once we quantitatively define nutrient density, we can reverse this trend and satisfy your appetite without overconsuming energy.
To learn more, read on!
- What Are the Most Significant Contributors to the Obesity Epidemic?
- How Do Macros Affect Satiety?
- What Micronutrients Are We Getting Less of and Craving More?
- Are the Official Nutrient Recommendations Optimal?
- What Are the Optimal Nutrient Intakes?
- How Can I Level Up from the DRIs to ONI Targets?
- How Do I Change My Micronutrient Targets in Cronometer?
- How Were the Optimal Nutrient Intakes Determined?
- But what about the vitamins, minerals and essential fatty acids?
- How is the Diet Quality Score Calculated?
- What is a Typical Diet Quality Score?
- What Is the Relationship Between Macros and Diet Quality?
- What About Fortified Foods?
- Bioavailability and Absorption
- Antinutrients
- Beneficial Nutrients Not Quantified
- Do I Need to Be Worried About Getting Too Much of a Particular Nutrient?
- More
What Are the Most Significant Contributors to the Obesity Epidemic?
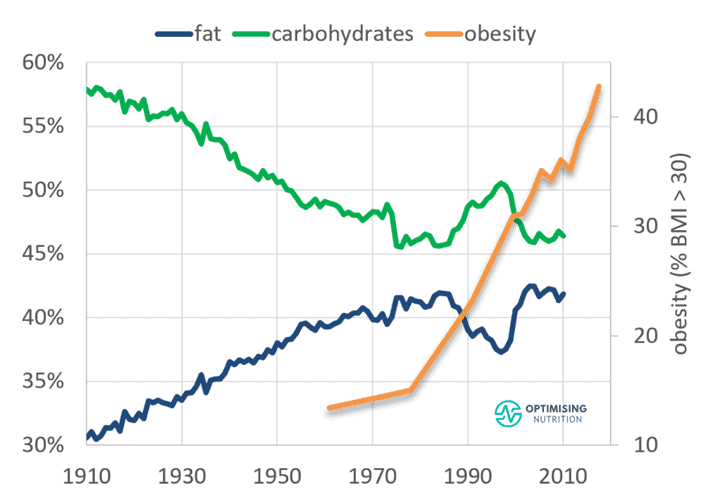
The chart below shows that we have gotten fatter as we have continued to eat more. Obesity rates track closely with calorie availability.
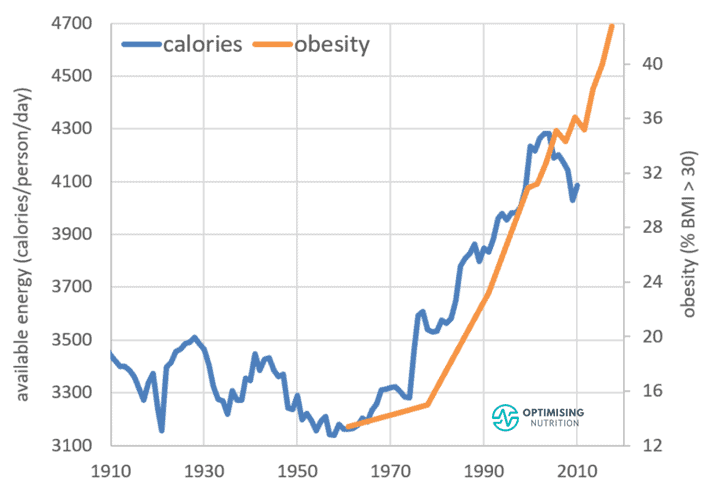
Chart created from data from the USDA Economic Research Service and the US Centres for Disease Control
The table below shows the correlation between total calories and the total energy in our diet since 1958. The increased energy that has fuelled the ever-growing obesity epidemic has come from both carbohydrates and fat.
| nutrient | correlation |
| monounsaturated fat (g) | 98% |
| carbohydrate (g) | 95% |
| total fat (g) | 95% |
| polyunsaturated fat (g) | 93% |
Fat
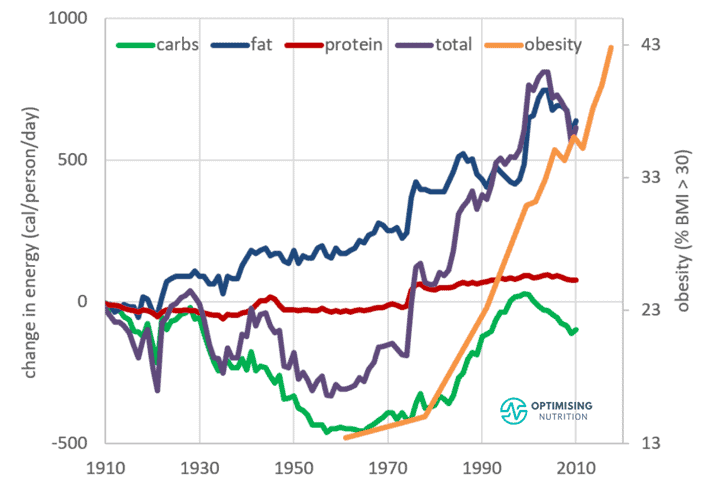
Since we discovered how to extract oil from industrial crops (like soybean, canola, and rapeseed) at scale, the energy available in our food system from fat alone has increased by a staggering eight hundred calories per person per day over the past century.
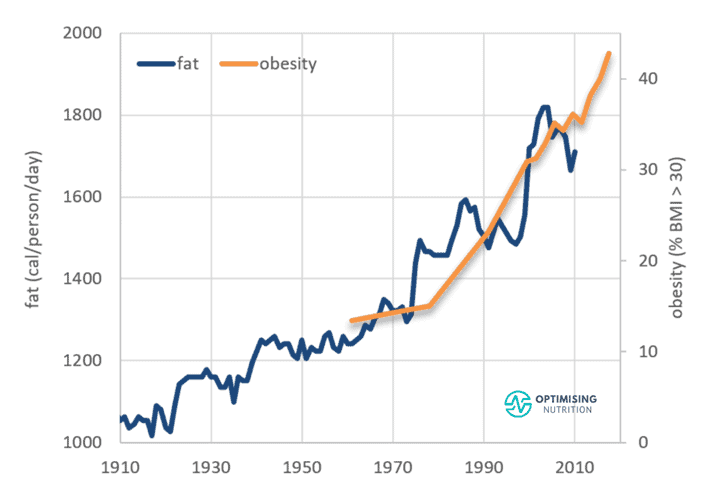
The vast majority of this extra energy from dietary fat has come from industrial seed oils, which are predominantly monounsaturated fat and polyunsaturated fat. As you can see in the chart below, this increase in energy from industrial seed oils tracks closely with the rise in obesity rates.
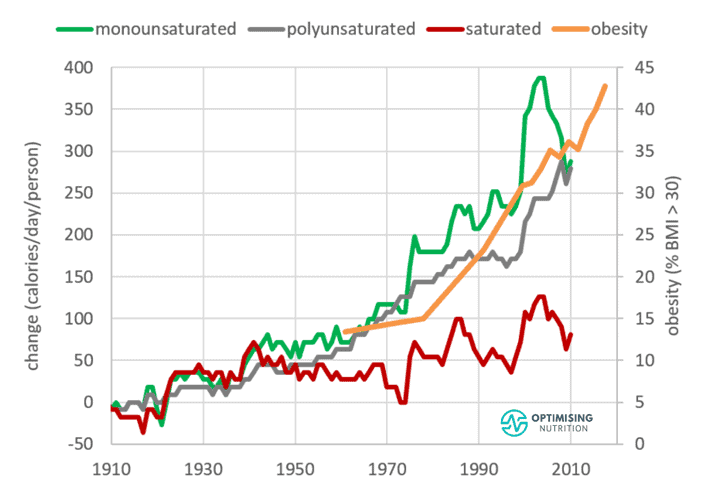
While saturated fat is often demonised, there has been an increase of less than 100 calories per day from saturated fat. Moreover, in percentage terms, the energy from saturated fat has been declining since the 1930s.
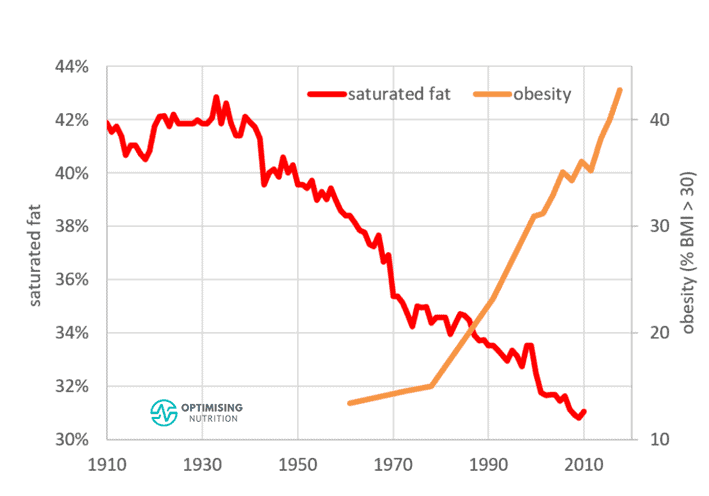
This fact doesn’t make saturated fat a ‘free food’ that you can eat in unlimited quantities. However, it appears that the increase in industrial seed oils is more to blame for the rise in empty calories available in our food system.
The following chart shows how calories from the various food groups have changed over the past century. We can see that the most significant increase is from added fats and oils, followed by flour and cereals. Meanwhile, our consumption of dairy, meat, and eggs that are relatively higher in saturated fat has remained essentially unchanged.

Carbohydrates
Over the past century, carbohydrates initially fell but rose again during the 1960s Green Revolution. The amount of energy from added sugars–specifically high-fructose corn syrup that was falling out of favour–decreased following the introduction of artificial sweeteners in 1999. However, obesity continued to climb as ultra-processed foods incorporated these artificial sweeteners.

Protein
The chart below shows that protein intake remained relatively stable over the past century, with a small bump in the 1970s.
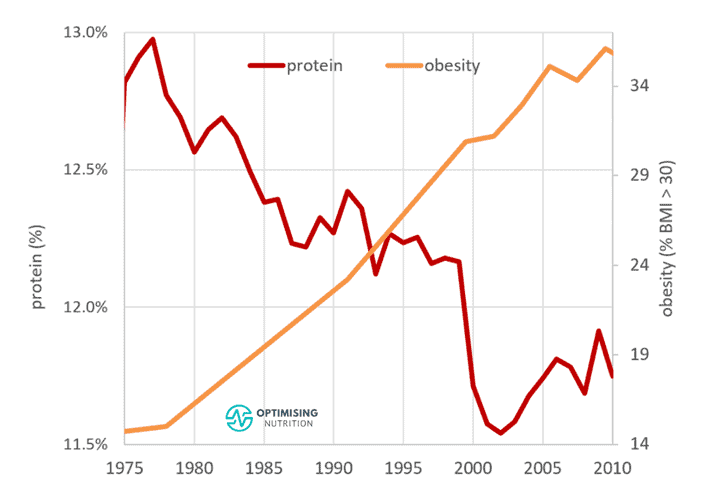
However, looking at protein in percentage terms can be more helpful. As shown in the chart below, protein % decreased in the early part of the last century until the Great Depression. Then, from 1930, protein % rose until the first Dietary Guidelines for Americans were released in 1977.
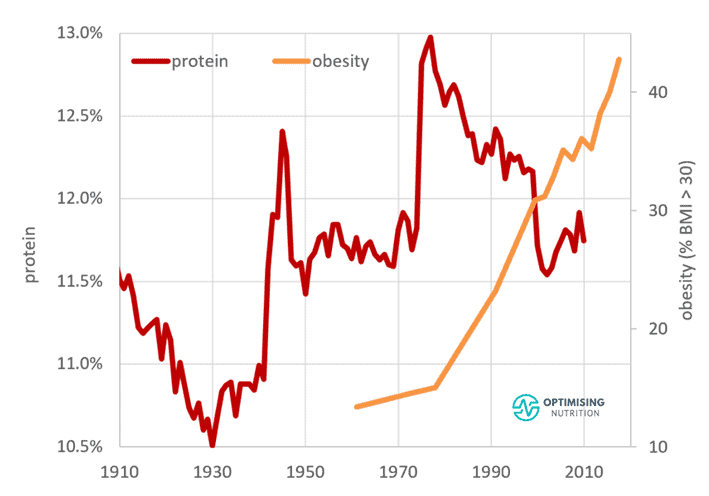
While the amount of calories from protein has increased marginally, the percentage of protein in our diet has decreased while our energy consumption from carbs and fat has risen dramatically. Unfortunately, protein is the most expensive macronutrient, so processed food manufacturers love to sell us foods that contain higher-profit margin refined carbs and fats.
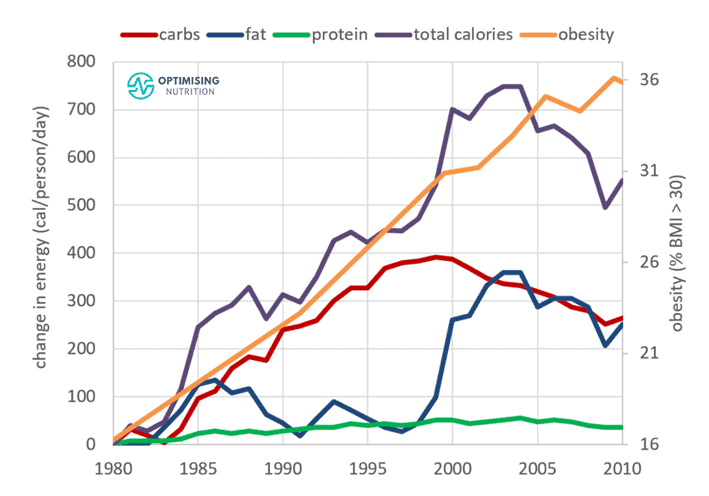
When we zoom in and look at macros since 1980, we see that protein has increased marginally. Initially, carbs rose, but then, once we created artificial sweeteners and decreased our reliance on high fructose corn syrup to make food sweet, fat increased, and carbs started to decline.
Energy from Fat and Carbs
Minimally processed whole foods typically contain their energy as either fat or carbs. Rarely do they contain both at the same time. Your body enjoys foods that contain energy from either fat or carbs. However, when fats are combined with carbohydrates, we get a supra-additive dopamine hit and want to eat more of them more frequently.
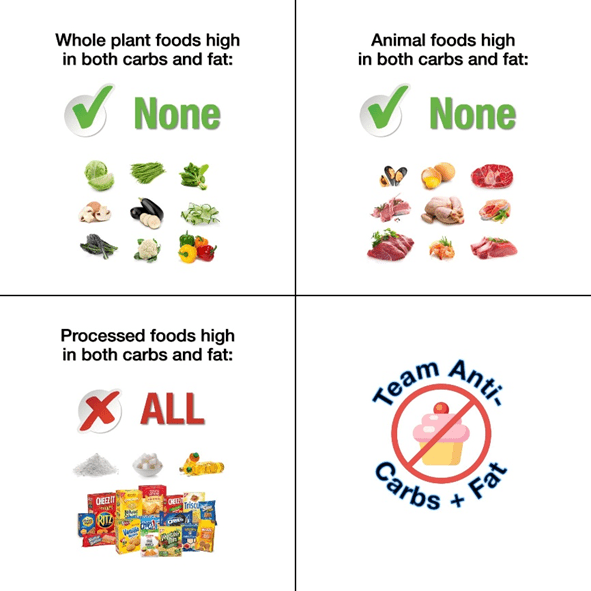
As our diet has become a similar blend of energy from fat and carbs with increased levels of processing, obesity rates have increased. Many people feel they are ‘addicted’ to these energy-dense ultra-processed foods and can’t stop eating them.
The most effective thing we can do to reverse this trend is to reduce the energy from fat and carbs in our diet while prioritising protein.
As you can see, the macronutrient profile of our food undoubtedly impacts the quantity of food we eat. However, the micronutrient content of food also plays a significant part, as our bodies seek to ensure we get all the nutrients we require to execute metabolic processes and thrive.
How Do Macros Affect Satiety?
Protein leverage is a well-documented phenomenon whereby we consume more energy until we satisfy our protein requirements. Our analysis of 125,761 days of macronutrient and micronutrient data from 34,519 Nutrient Optimiser users also shows that we consume more calories when we eat food that combines fat and carbs and less protein and fibre.
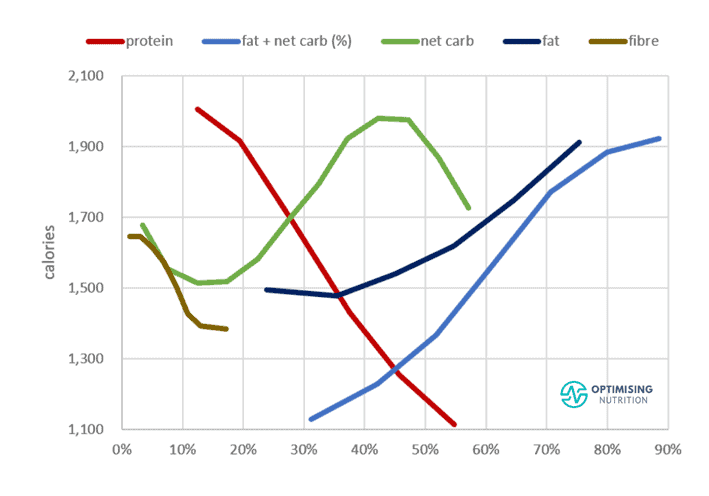
The chart below shows that reducing carbs or fat has a similar effect on satiety and the quantity of food you will eat. Moving from 80% to 40% fat has a similar impact on how much we eat as moving from 45% to 15% non-fibre carbohydrates.
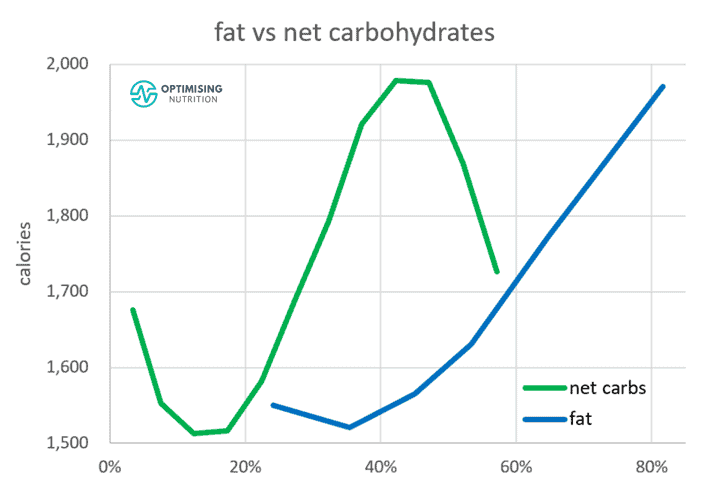
However, we see a much more significant impact from increasing protein % or, conversely, decreasing the amount of energy from fat and carbs together.
These foundational principles are the focus of our Macros Masterclass. However, similar to protein leverage, we also tend to see a similar micronutrient leverage effect when we get more or less of the micronutrients that our bodies require.
The following FAQs will focus on micronutrients’ effects on satiety and how you can leverage them to meet nutritional needs and your cravings.
What Micronutrients Are We Getting Less of and Craving More?
Our modern agricultural system is super-fuelled by fossil fuel-based fertilisers injected into our food system. As a result, our modern farming methods yield crops that grow more quickly but take up fewer nutrients from the soil. Hence, they have a lower nutrient density and a higher energy content than they had in times past.
Over time, our soil’s nutrient content has also become depleted by these large-scale, mono-crop agricultural processes.
For more details, see What Lies Beyond the Nutritional Apocalypse.
The table below shows various micronutrients negatively correlated with the increase in calories. In other words, these are the nutrients (per calorie) that have decreased while obesity and calorie intake have increased.
| Nutrient | correlation |
| sodium (g/2000 cals) | -96% |
| calcium (g/2000 cals) | -96% |
| cholesterol (g/2000 cals) | -96% |
| potassium (g/2000 cals) | -91% |
| vitamin A (RAE/2000 cal) | -81% |
| phosphorus (g/2000 cal) | -80% |
| vitamin B12 (mcg/2000 cal) | -70% |
| magnesium (mg/2000 cal) | -33% |
| vitamin C (g/2000 cals) | -3.4% |
| cholesterol (%) | -0.2% |
As shown in the charts below, critical nutrients like sodium and calcium have decreased in our food system. As a result, we now have to eat significantly more of the currently available foods to get these essential nutrients that our bodies require to thrive.
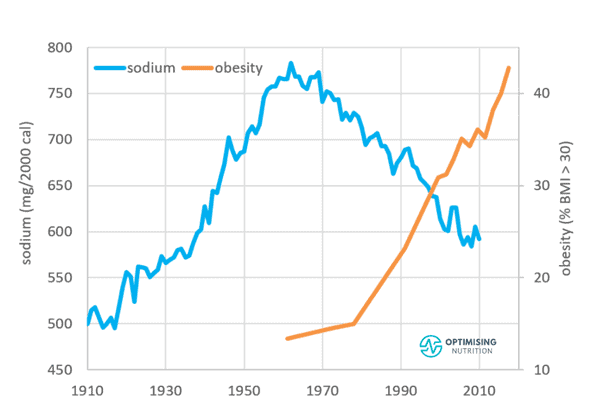
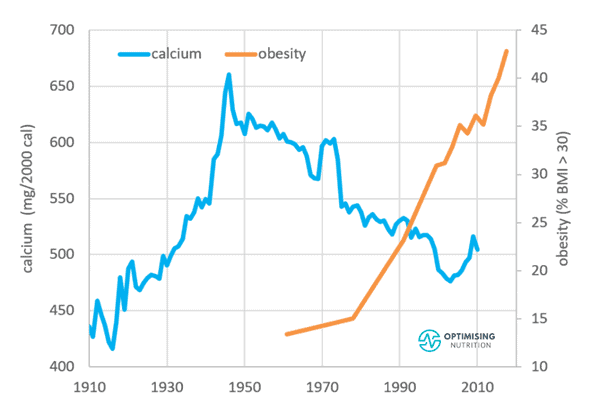
Similar to the protein leverage hypothesis, there appears to be a statistically significant micronutrient leverage effect for most, if not all, of the essential vitamins and minerals. Our bodies crave foods containing more of the required nutrients and are not currently getting enough of. Consequently, we consume more energy to obtain the nutrients we need.
Are the Official Nutrient Recommendations Optimal?
The Dietary Reference Intakes (DRI), Estimated Average Requirements (EAR), Recommended Daily Allowance (RDA), and Adequate Intakes (AI) have been set to prevent diseases related to nutrient deficiencies.
The figure below shows that these targets represent the minimum intakes thought to be needed to prevent deficiencies. They are by no means ideal or optimal!

An Upper Limit (UL) is also often set based on the amount of a specific nutrient that tends to cause adverse effects from supplementation.
Rather than thinking about minimum intakes simplistically, our satiety analysis has enabled us to determine the relationship between each nutrient intake (per calorie) and the amount we eat to determine the Optimal Nutrient Intakes that can be obtained with food without relying on supplements.
What Are the Optimal Nutrient Intakes?
The Optimal Nutrient Intakes (ONIs), shown in the table below, are the quantities of each nutrient our data has shown to align with consistently greater satiety and optimised health.
| nutrient | ONI | DRI or AI | units |
| calcium | 1650 | 1000 | mg |
| iron | 30 | 18 | mg |
| magnesium | 825 | 320 | mg |
| phosphorus | 1250 | 700 | mg |
| potassium | 6000 | 2600 | mg |
| sodium | 4000 | 1500 | mg |
| zinc | 25 | 8.0 | mg |
| copper | 3 | 0.9 | mg |
| manganese | 5.5 | 1.8 | mg |
| selenium | 300 | 55 | mcg |
| vitamin A | 10000 | 2333 | IU |
| vitamin E | 25 | 15 | mg |
| vitamin D | 1200 | 600 | IU |
| vitamin C | 350 | 75 | mg |
| thiamine (B1) | 3 | 1.1 | mg |
| riboflavin (B2) | 6 | 1.1 | mg |
| niacin (B3) | 60 | 14 | mg |
| pantothenic acid (B5) | 12 | 5 | mg |
| vitamin B6 | 5 | 1.3 | mg |
| vitamin B12 | 12 | 2.4 | mcg |
| vitamin K1 | 1100 | 90 | mcg |
| folate | 1000 | 400 | mcg |
| tryptophan | 2.2 | – | g |
| threonine | 8.1 | – | g |
| isoleucine | 8.8 | – | g |
| leucine | 15.2 | – | g |
| lysine | 15.2 | – | g |
| methionine | 4.8 | – | g |
| cysteine | 2.4 | 0.9 | g |
| phenylalanine | 7.9 | 1.6 | g |
| tyrosine | 6.6 | 1.6 | g |
| valine | 9.8 | 2.3 | g |
| histidine | 5.4 | 1.4 | g |
| omega 3 | 6 | 1.1 | g |
Also shown for comparison are the DRIs and AIs, which are calculated based on the average intake of a 70 kg man who theoretically consumes 2000 calories per day. The ONIs shown in this table are based on 2000 calories per day for ease of comparison.
On average, the ONIs are around four times the DRI or AI required to prevent diseases of deficiency. If you’re aiming for the ONI targets and are eating in a calorie deficit to lose weight, you will still be getting plenty of these nutrients.
For more detail on each nutrient, click on the hyperlinks in the table above.
How Can I Level Up from the DRIs to ONI Targets?
Because the minimum nutrient intakes are low, many people find it reasonably easy to reach them in Cronometer and see lots of green straight away. However, they get pretty discouraged when they start by putting the ONI stretch targets shown in the table above into Cronometer, and all their pretty green bars turn yellow and shrink.

The “beginner” column in the table below shows the DRI/AIs that you will see in Cronometer by default. In addition, we have the ONI targets per 2000 calories (i.e., Level 3).
If you want to work your way up to the ONI targets in ‘digestible’ phases, you can start by changing your settings in Cronometer to the ONIs per 1000 calories (i.e., Level 1). This will highlight the nutrients you need to focus on more effectively. Meanwhile, anything that is still green and full in Cronometer is good to go – you are already getting plenty of these nutrients. These Level 1 targets are handy for people consuming fewer calories in a weight loss phase or older females who require fewer calories than active young men.
| nutrient | Beginner DRI/AI | Level 1 ONI (1000 cals) | Level 2 ONI (1500 cals) | Level 3 ONI (2000 cals) |
| calcium | 1000 | 825 | 1,238 | 1650 |
| iron | 18 | 15 | 23 | 30 |
| magnesium | 320 | 412.5 | 619 | 825 |
| phosphorus | 700 | 625 | 938 | 1250 |
| potassium | 2600 | 3000 | 4,500 | 6000 |
| sodium | 1500 | 2000 | 3,000 | 4000 |
| zinc | 8 | 12.5 | 19 | 25 |
| copper | 0.9 | 1.5 | 2.3 | 3 |
| manganese | 1.8 | 2.75 | 4.1 | 5.5 |
| selenium | 55 | 150 | 225 | 300 |
| vitamin A | 2333 | 5000 | 7,500 | 10000 |
| vitamin E | 15 | 12.5 | 19 | 25 |
| vitamin D | 600 | 600 | 900 | 1200 |
| vitamin C | 75 | 175 | 263 | 350 |
| thiamine (B1) | 1.1 | 1.5 | 2.3 | 3 |
| riboflavin (B2) | 1.1 | 3 | 4.5 | 6 |
| niacin (B3) | 14 | 30 | 45 | 60 |
| vitamin B5 | 5 | 6 | 9 | 12 |
| vitamin B6 | 1.3 | 2.5 | 3.8 | 5 |
| vitamin (B12) | 2.4 | 6 | 9 | 12 |
| vitamin K1 | 90 | 550 | 825 | 1100 |
| folate | 400 | 500 | 750 | 1000 |
| tryptophan | 0 | 1.1 | 1.7 | 2.2 |
| threonine | 0 | 4.1 | 6.1 | 8.1 |
| isoleucine | 0 | 4.4 | 6.6 | 8.8 |
| leucine | 0 | 7.6 | 11.4 | 15.2 |
| lysine | 0 | 7.6 | 11.4 | 15.2 |
| methionine | 0 | 2.4 | 3.6 | 4.8 |
| cysteine | 0.9 | 1.2 | 1.8 | 2.4 |
| phenylalanine | 1.6 | 4.0 | 5.9 | 7.9 |
| tyrosine | 1.6 | 3.3 | 5.0 | 6.6 |
| valine | 2.3 | 4.9 | 7.4 | 9.8 |
| histidine | 1.4 | 2.7 | 4.1 | 5.4 |
| omega 3 | 1.1 | 3.0 | 4.5 | 6.0 |
Then, once you are getting full green bars for most of the nutrients with the Level 1 targets, you can enter the ONIs per 1500 calories (Level 2) and continue focusing on nutrients that are harder to find. Finally, if you eat around 2000 calories and mainly see green bars, you can level up to the ONI per 2000 calorie targets.
Updating your nutrient targets in Cronometer won’t change anything in Nutrient Optimiser. It just makes the display in Cronometer a little more helpful and motivational as you continue on your quest toward Nutritional Optimisation.
How Do I Change My Micronutrient Targets in Cronometer?
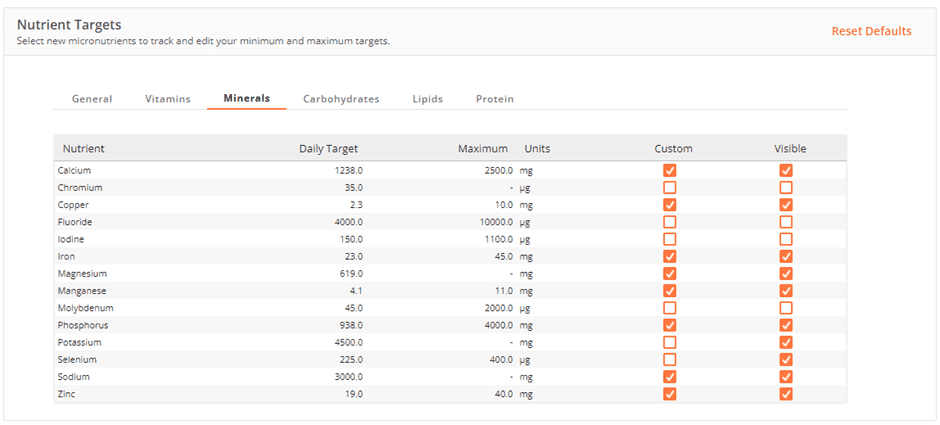
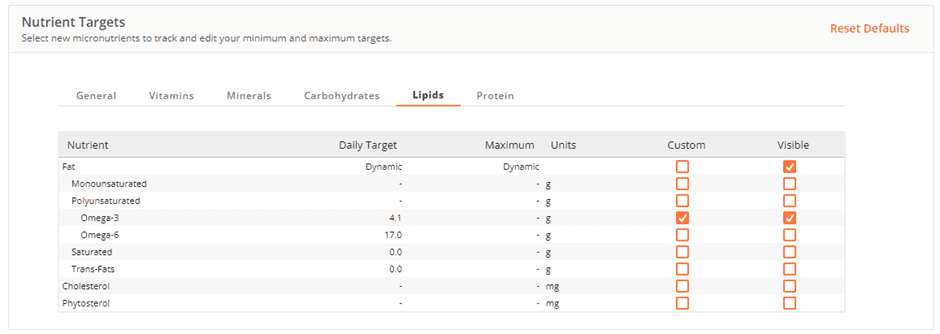
To change your micronutrient targets in the web version of Cronometer, go to ‘settings’ -> ‘account profile’ and ‘targets’. Scroll down to the bottom to Nutrient Targets. You can then click on each nutrient and enter the target from your chosen level. Finally, select ‘custom target’ for each nutrient you enter manually. The screenshots below show what this would look like for the Level 2 ONI targets. You can also change your nutrient targets by clicking on each corresponding green and yellow bar in the main diary screen in Cronometer.


How Were the Optimal Nutrient Intakes Determined?
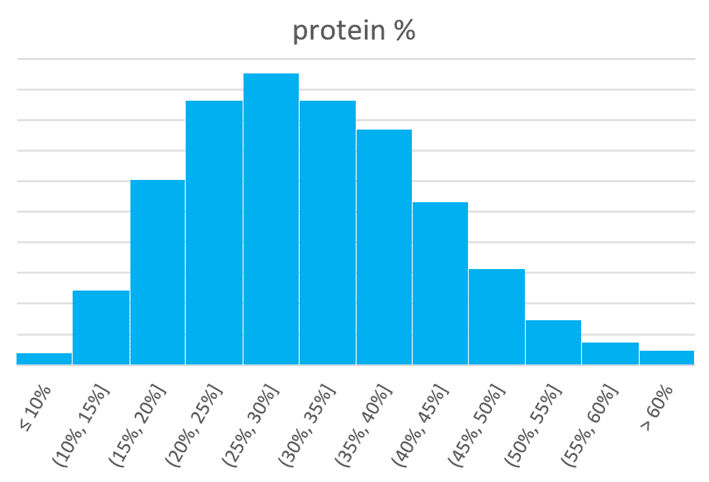
To help you understand how the ONIs were determined, the chart below shows the relationship between protein % and calorie intake. Our analysis of 125,761 days of data from 34,519 people shows that increasing protein % by reducing energy from fat and carbs consistently resulted in eating fewer calories.

Towards the left of this chart, you can see that the population average protein intake of around 12% energy from protein aligns with the highest calorie intake. Interestingly, it also aligns with the DRI of 0.8 g/kg BW.
Toward the right, you can see that the 85th percentile protein intake is just over 40%. This means that only 15% of people can maintain more than 50% protein. So, getting 40% of your calories from protein is achievable but not easy to do. So, you could say that our optimal stretch target for protein is 40%.
Similar to protein, our data analysis consistently shows that the DRIs for the micronutrients align with the highest calorie. So, unless you want to follow the average trend of obesity and endless cravings, you probably want to be closer to optimal, right?
But what about the vitamins, minerals and essential fatty acids?
To empower you to dial in all your essential nutrients, we have carried out a similar satiety analysis on all the essential micronutrients.
As an example, the chart below shows the satiety response for potassium. As we eat foods that contain more potassium per calorie, we eat less. This satiety analysis shows that people eating foods that contain more potassium per calorie consume a whopping 41% fewer calories!
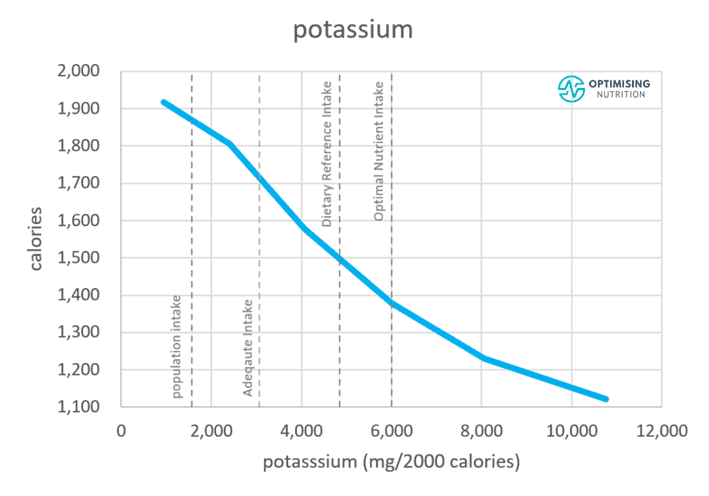
In the case of potassium, which has been deemed a “nutrient of public health concern”, the DRI (4,800 mg/day) is much greater than the actual population intake. However, we have set a slightly higher ONI stretch target of 6,000 mg per 2000 calories based on the 85th percentile intake of Optimisers. While 6 g/2000 calories is achievable, only 15% of Optimisers regularly exceed this amount.
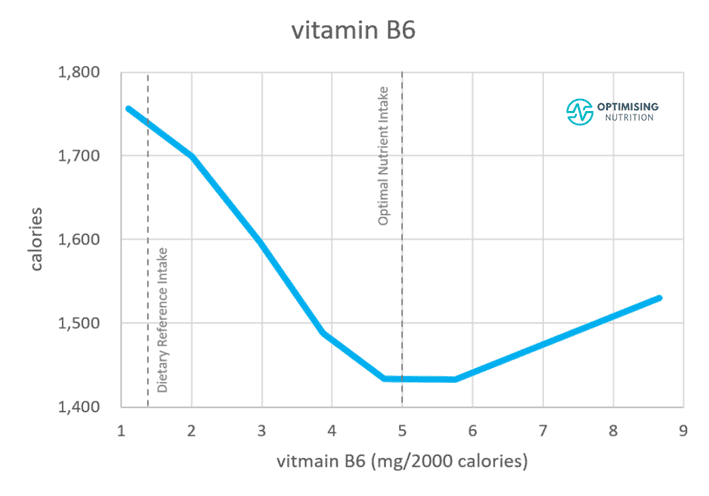
Most minerals and amino acids show a similar relationship, whereby consuming more of each mineral per calorie leads to a lowered caloric intake. However, the vitamins often show a point where they level out. In other words, no additional intake reduces cravings further.
As you can see in the example below, our craving for foods that contain more vitamin B6 tends to decrease once we get more than 5 mg/2000 of vitamin B6. Once we get our fill of vitamin B6, our appetite sends us searching for foods containing other nutrients. More is not necessarily better.
Thus, there is no point in striving for foods that contain more B6, especially if the extra B6 is from supplements or fortified foods, which don’t provide the same impact on satiety. You’d be better off investing your energy focusing on other nutrients.
Using the ONIs as an upper limit stretch target or goal is critical to determining your Diet Quality Score, which we’ll discuss next.
How is the Diet Quality Score Calculated?
The chart below shows how we calculate the Diet Quality Score for a food, a meal, or a week’s worth of food logging. The x-axis is the % of the ONI target you’ve reached for each nutrient. If you can fill everything to the left of the black 100% line, you get 100%!
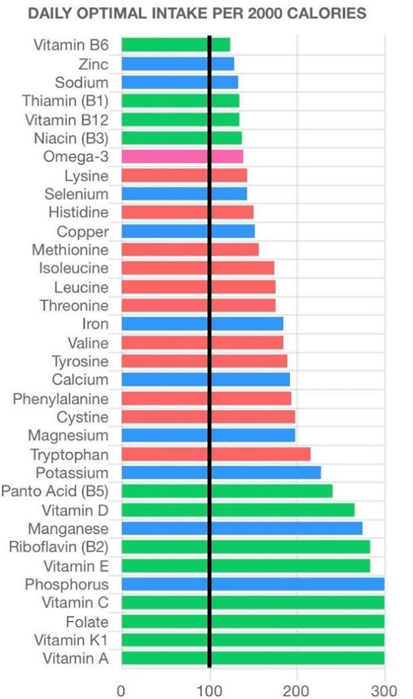
We can see that this person is getting plenty of vitamin A, K1, and folate. Thus, there would be no benefit in targeting foods that contain more of these nutrients.
However, if you are not yet meeting the 100% line for micronutrients listed towards the top of the chart, you would likely benefit from targeting foods containing more of these nutrients.
Nutritional Optimisation is a quest to seek out more foods and meals containing the nutrients you currently lack. Before the creation of ultra-processed food, this is how our appetites would have functioned in the wild: your cravings would drive you to seek out the nutrients we require.
Sadly, today, modern agriculture, processing, and food scientists have hijacked our appetite to profit from the foods that make us sick and fat. In the Micros Masterclass, we use the best quantitative tools to guide your appetite and reverse engineer your satiety and cravings. Thus, you can ensure you get the nutrients you need without excess energy.
What is a Typical Diet Quality Score?
The average Diet Quality Score is 57%. Less than 4% of people achieve a score greater than 90%. So don’t be too discouraged if you don’t initially get a Diet Quality Score of 100%.
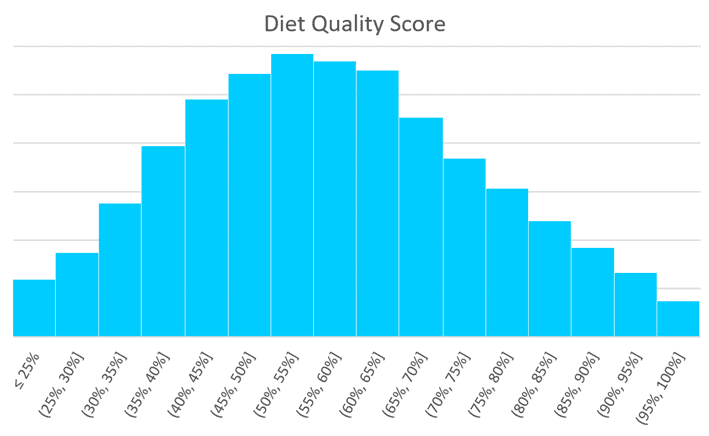
It can take a little bit of time to dial in the nutrients you lack. Also, keep in mind that if you don’t want to lose weight in a hurry, although you will still benefit from a nutritious diet, a super-high nutrient score may not be appropriate for you. Even if you want to lose weight, we recommend you dial in your Diet Quality Score enough to achieve a weight loss of between 0.5 to 1.0% per week, as anything quicker than this is hard to sustain in the long term.
Rather than competing with others, we have designed Nutrient Optimiser to enable you to compete with yourself. By continually experimenting and finding new foods and meals that you love eating, you will progressively increase the quality of your diet and learn how to give your body everything it requires!
For more details, see What’s a Typical Diet Quality Score (and How Much Could You Improve Yours)?
What Is the Relationship Between Macros and Diet Quality?
Our Macros Masterclass guides Optimisers through dialling in their macronutrient intake to align with their goals and preferences. While dialling in macronutrients is foundational, it’s only the first step of Nutritional Optimisation. The charts below will give you an idea of how macronutrients align with the Diet Quality Score.
Protein
The chart below shows that protein correlates with increased diet quality, up to 50% of calories. Higher protein foods tend to contain less energy from fat and non-fibre carbohydrates and supply a range of vitamins and minerals.
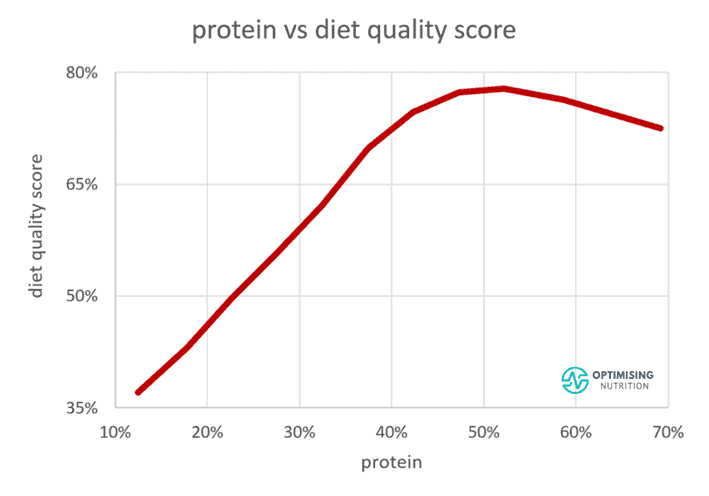
But it’s important to note that you won’t get a Diet Quality Score of 100% by simply eliminating all dietary fat and carbs and swapping them for egg whites, protein powder, and chicken breast. While protein is a critical piece, you need to focus on all the micronutrients.
Carbohydrates
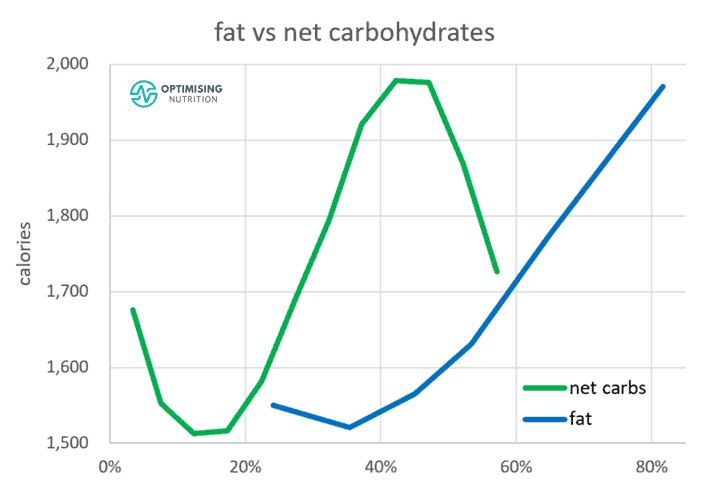
The chart below shows that the maximum diet quality score aligns with around 13% non-fibre carbohydrates. In your quest to improve your diet quality, you will find that you will vastly reduce ultra-processed foods that contain refined grains and sugars. However, non-starchy, low-energy veggies usually help fill in the vitamin and mineral gaps that are often more challenging. So, while lower-carb is good, zero-carb is not necessarily better.

Fat
The chart below shows that peak nutrient density aligns with less than 40% dietary fat. Although a lower fat intake can be beneficial, minimising fat is not necessarily better. Omega-3 fatty acids and cholesterol play major valuable roles in the body, and protein tends to come packaged with some energy from fat. So, similar to carbs, zero fat is not necessarily better than lower fat.

Energy from Fat and Carbs
Interestingly, the highest Diet Quality Score tends to align with the intakes of carbs and fat that produce the greatest satiety and lowest-calorie intake. Whether you start by focusing on optimising macronutrients to increase satiety or micronutrients to increase nutrient density, you will end up in a similar place.
What About Fortified Foods?
The United States started fortifying foods like rice, flour, and cereals in the 1930s after deficiencies like pellagra and beriberi became more widespread amongst populations that could only afford these nutrient-poor foods.
Interestingly, experiments were undertaken on livestock in the 1960s to examine the impact of nutrients on health and livelihood. They found cattle failed to thrive with processed grain feed alone and would get sick, lose their hair, and stop growing without having time on pasture or added greens like alfalfa to get their full spectrum of nutrients. In other words, the after-effects were not good for business!
However, the animals no longer needed pasture or supplemental nourishment when vitamins were added to their feed. In fact, they grew even fatter with less feed in less time and were no longer interested in the supplemental feed.
Coincidently—or not! —soon after the fortification of animal feed became widespread to increase profits, the fortification of human food also increased in the 1970s. This powered the obesity epidemic onward. The charts below show the dramatic increase in fortified nutrients like niacin, iron, thiamine, and folate in our food system that mainly took place during the 1940s and 1970s.
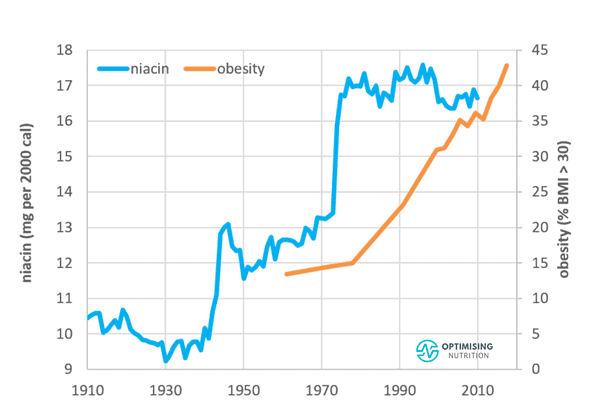
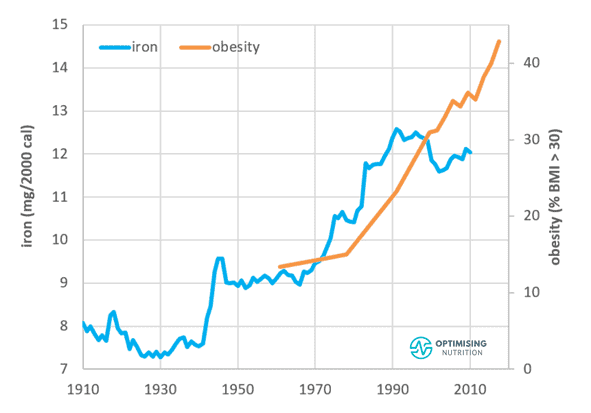
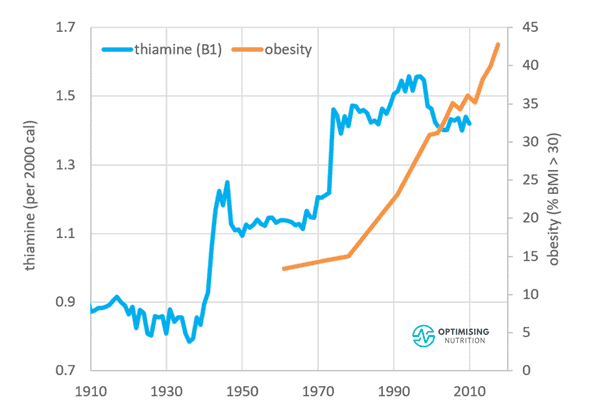
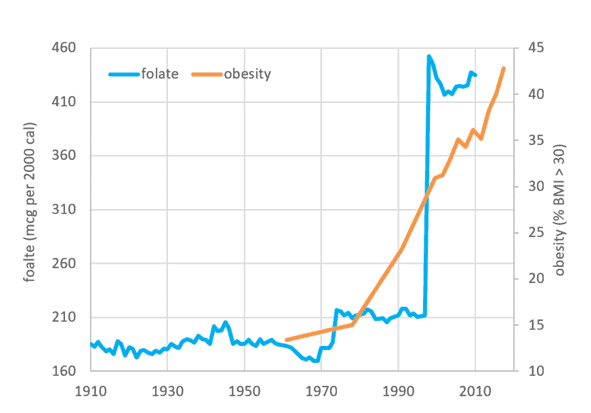
One of the roles of B vitamins is to allow us to use carbs and fat for energy. Thus, it appears that fortifying foods with B vitamins enables us to use energy in foods that are otherwise nutrient-poor and store it as fat. But unfortunately, it seems one caveat to consuming these fortified foods is that we lose our cravings for whole foods that typically provide those B vitamins, like meat, eggs, seafood, fruits, and vegetables.
Our satiety analysis also suggests that vitamins in supraphysiological quantities only achievable with fortified foods do not provide a satiety benefit. We actually eat a lot more of these fortified foods.
For more details about the potential downsides of fortification, check out Mark Schatzker’s The End of Craving or this podcast with him.
In the Micros Masterclass, you will see the importance of prioritising nutrient-dense whole foods that contain the full spectrum of nutrients and improve your diet quality. Fortified foods automatically fall off your shortlist of optimal foods.
Once you see you are getting high amounts of a particular nutrient from fortified foods, we suggest you work to eliminate or drastically reduce those foods. This will likely correct your appetite and increase your cravings for healthier foods over time.
Bioavailability and Absorption
One challenge when quantifying nutrient density is the bioavailability of nutrients from different sources. Nutrients in some foods tend to be more bioavailable than others.
Protein,[1] vitamin A, iron, zinc, and omega-3 fatty acids are less bioavailable in plant foods than from animal sources[2]. The good news is that most Optimisers find these nutrients reasonably easy to obtain in adequate quantities from an omnivorous diet. Hence bioavailability is usually not a major concern.
Unfortunately, there is limited data to quantify the nutrients consumed vs the utilisable nutrients absorbed. Without a rigorous food database that considers bioavailability, it is impossible to quantify and incorporate into nutrient density calculations. In the first instance, targeting ONIs from plant AND animal-based foods will ensure that adequate nutrients are available.
If you can achieve close to the Optimal Nutrient Intakes, sufficient nutrients will likely be available to compensate for any bioavailability or absorption issues. Targeting the ONI stretch targets thus provides a ‘safety factor’ that accounts for any limited bioavailability or reduced nutrient absorption.
Quantifying your current nutrient intake also enables you to identify the nutrients available in lower quantities relative to ONI targets. Using this information, you can then review the priority of vitamins and minerals listed at the top of your nutrient fingerprint chart and investigate if they are bioavailable from the food sources you typically consume.
Antinutrients
Antinutrients refer to plant compounds like phytates, tannins, lectins, protease inhibitors, and oxalic acid that inhibit the absorption of other nutrients. These compounds are known to impact and impede the absorption of iron, zinc, and calcium.
Similar to bioavailability, there is currently a lack of comprehensive data to quantify the effects of antinutrients. Antinutrients are prevalent in refined grains, which tend to reduce when people shift their focus to nutrient density.
There are also varying opinions on how much concern we should exercise regarding antinutrients. While many are concerned about antinutrients, others promote the beneficial xenohormetic effect of consuming more plants that have lived in stressful conditions. Stressful conditions are known to cause plant species to evolve and produce chemicals and compounds that protect the plant, which confers to us when we eat them.
An excellent example of this is the compound sulforaphane in cruciferous vegetables. In contrast, foods grown through mono-crop agriculture are raised with plenty of fertilisers and pesticides. Because crops grown in this way are under little stress, there is likely negligible xenohormetic benefit.
One of the most common antinutrient concerns is oxalates. However, the risk of oxalate excess can be mitigated with a diet adequate in minerals—particularly calcium. A review of the NutriBooster recipes shows average calcium: oxalate ratio of 53, which is well above the recommended minimum of 4 for people who are known to have issues with oxalates.
Beneficial Nutrients Not Quantified
While Nutritional Optimisation focusses on the 34 essential vitamins, minerals, amino acids, and fatty acids, many other non-essential beneficial nutrients in food are not quantified.
Quantifying the benefits of these other beneficial properties of food is difficult given the limited data we currently have access to. Moreover, because they are not essential for life, there are no agreed targets for minimum or optimal intakes for these other beneficial compounds.
Prioritising non-essential nutrients for which little is known about optimal intakes dilutes the weighting of essential nutrients on the most critical food parameters. Other food ranking systems that have tried to incorporate too many factors with limited data tend to arrive at non-sensical results (see Is Tufts University’s new Food Compass nutrient profiling system ‘broken’?).
This is not a significant issue if the focus is on identifying nutrient-dense whole foods that contain essential nutrients because the non-essential beneficial nutrients will likely come along for the ride.
Do I Need to Be Worried About Getting Too Much of a Particular Nutrient?
It’s hard to get excessive amounts of the essential nutrients from whole foods without supplementation. Remember, the key to nutritional optimisation is prioritising the micronutrients you currently find harder to get in your diet.
By continuing to emphasise the nutrients you are currently not getting enough of, you will automatically de-emphasise the nutrients you are already getting plenty of. It will all work out in the long run!
Note: It is relatively easy to exceed the Upper Limit for vitamin A if you consume a lot of organ meats like liver, kidney, and heart regularly. However, be mindful that the Upper Limit is set based on side effects from taking too many supplements. There are very few documented cases of hypervitaminosis A in humans aside from dehydrated explorers who had to eat their dog’s liver or polar bear liver.
The more significant concern of eating tons of organ meats comes with the high levels of copper that they typically contain. This easily upsets the zinc:copper ratio and can contribute to exceedingly high levels of copper, which can come with some health detriments. Although liver is fine if you enjoy it, do not overconsume it. Instead, work on diversifying your food selection to level up your Diet Quality Score.
[1] https://www.ncbi.nlm.nih.gov/labs/pmc/articles/PMC6723444/
[2] https://pubmed.ncbi.nlm.nih.gov/28867104/
More
- Micros Masterclass
- Join the Micros Masterclass
- Micros Masterclass FAQs
- All About the Micros Masterclass [FAQ Part 1]
- What is Nutrient Density? [FAQ Part 2]
- How to Get the Most Out of Cronometer [FAQ Part 3]
- How to use Nutrient Optimiser [FAQ Part 4]
- Optimising Your Food and Meal Choices [FAQ Part 5]
- Why Are Micronutrients So Important? [FAQ Part 6]
- Micronutrient Deficiencies in Popular Diets [FAQ Part 7]
- Micros Masterclass Articles
- Micros Masterclass Results