

There is often confusion around the optimal macro balance.
But in the end, you need enough protein and other nutrients without too much energy from carbs and fat.
As you’ll see, we can calculate your macros to achieve your weight loss (or even weight gain) goals once you know what you’re currently eating to maintain your weight.
In this article, we’ll look at some examples (i.e., typical, low carb and low fat) to show you how this works and how you can apply the theory.
This is the same process we have guided thousands of Optimisers through in our Macros Masterclass to find the optimal balance of protein, carbs and fat to align with their goals, whether fat loss, blood sugar control, or even bulking.

How The Calculations Work
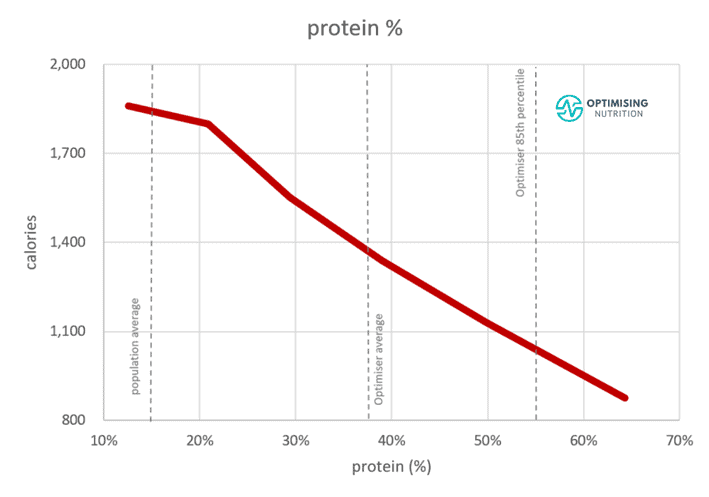
We know from our satiety analysis of 141,171 days of data from forty thousand Optimisers that a higher protein % aligns—almost linearly—with calorie intake. In other words, the higher your protein %—or per cent of total calories from protein—the fewer calories you will consume.
As shown in the chart below from our analysis, moving from low to high protein % correlates with a massive 61% reduction in total calories!
This observation aligns with a plethora of research around satiety, like Professors Raubenheimer and Simpson’s work on protein leverage theory.
We need adequate protein to survive and thrive. Thus, we crave protein and continue eating whatever is available until we get the protein we need.
While our analysis has identified many factors that align with greater satiety, protein % is dominant. Hence, we are more likely to overeat in a low-protein environment as our bodies seek adequate protein.
Conversely, we tend to eat less when we only have higher protein % food available.
Although this is simple in theory, it becomes more challenging when ultra-processed, ultra-cheap, hyper-palatable foods surround us.
While this might have you considering jumping into an ultra-high-protein diet for rapid fat loss, you will soon see that you don’t need to jump to a high protein % to get sustainable results.
Instead, a moderate increase in protein % may be plenty for you to get the minimum effective dose to start seeing results and moving towards your goals!
Weight Gain vs Weight Loss
To dive in a little more, the chart below shows the relationship between protein %, energy intake and protein (in grams) from the analysis of our data from our Optimiser data.
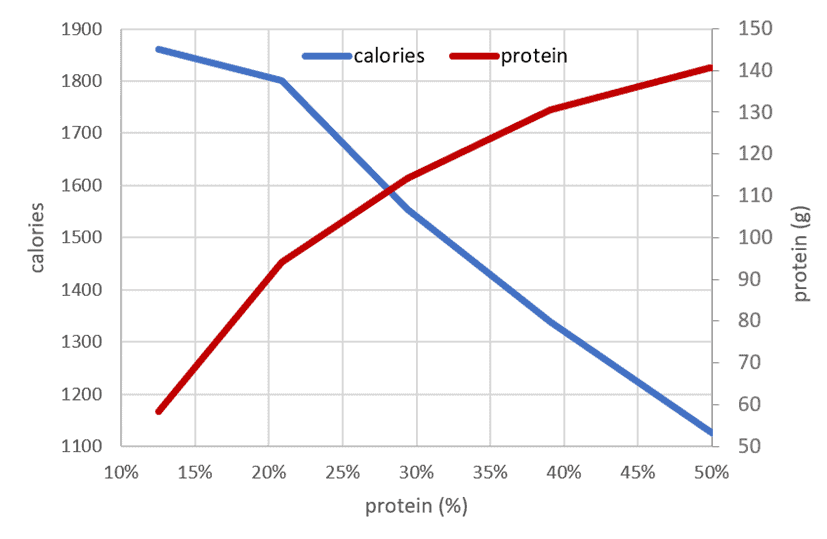
- If you want to gain weight and eat more, you should lower your protein % and move toward the left on the chart above. Because protein is satiating, reducing your protein % will decrease your satiety response and allow you to keep eating.
- Conversely, if you want to lose weight by decreasing hunger and increasing satiety, you can move towards the right by increasing your protein %. This is achieved by prioritising protein while dialling back energy from fat and carbs.
- Later, once you reach your goal body composition, you bring back some energy from fat and carbs to avoid further weight loss.
Calculating Your Target Protein %
We have used the relationship between protein % and calories from our data analysis to estimate the shift in protein % you need to make to achieve a particular calorie deficit.
Many macro calculators use algorithms to estimate protein and calories. Unfortunately, they are only ballpark estimates. The best way to understand how much protein and energy you require is to track your typical food for a few days.
As we’ve previously discussed, the amount of lean mass you carry has a powerful influence on the amount of energy and protein you require. So, while your cravings and appetite might appear random and mysterious, your body is super intelligent and regulates your protein and energy intake through hunger and cravings to align with your current activity levels and body composition.
If you change what you eat, your innate appetite will regulate how much you eat, and your body weight will find a new set point.
How to Determine your Current Macros
To understand your macro requirements, you can track your food in Cronometer for a few days to measure your regular food intake. Once you’re done tracking, go to Trends -> Nutrition Report.
You will see a chart like the one below. The numbers on the left of the slash are your current intakes of energy, protein, net carbs, and fat. The example below shows:
- 61 g of protein,
- 40 g net carbs, and
- 31 g of fat.

Next, we’ll walk through a few scenarios to show you how you would modify your target macros to align with your goals.
Scenario 1: Typical
To show you how this works in practice, we’ve used the weight and macro composition of the average Australian from 2011-12 Australian Bureau of Statistics Survey data. This was recently documented in Professor Raubenheimer and Simpson’s award-winning paper, Macronutrient (im)balance drives energy intake in an obesogenic food environment: An ecological analysis.
The macros of the average Aussie:
- Energy = 2073 cal/day (86712 kJ)
- Protein = 93 g/day (18.4%)
- Net carbs = 233 g/day (43.5%)
- Fat = 78 g/day (30.9%)
- Weight = 78.3 kg
It’s interesting to note that the non-fibre carbohydrate intake of the average Australian (43.5%) aligns almost perfectly with the largest energy intake from our satiety analysis (shown in the chart below).
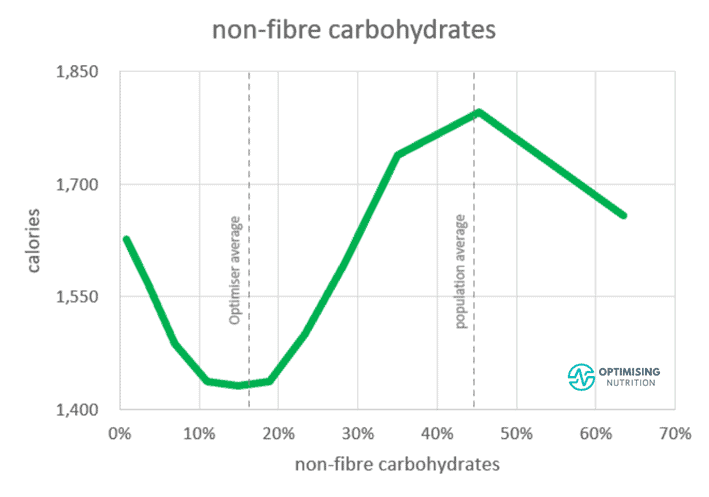
It’s probably not a surprise that the average American’s carbohydrate intake is the same. We naturally gravitate towards a combination of fat and carbs, which aligns with the maximum energy intake when these ultra-processed foods are available.
To the left of the chart above, we see that moving to 10–20% of total calories from non-fibre carbs aligns with the lowest calorie intake. But interestingly, we also see towards the right that people also tend to eat less on a low-fat, high-carb diet.
For completeness, we’ll look at both low-carb and low-fat scenarios below, but let’s start with the typical maintenance macro split.
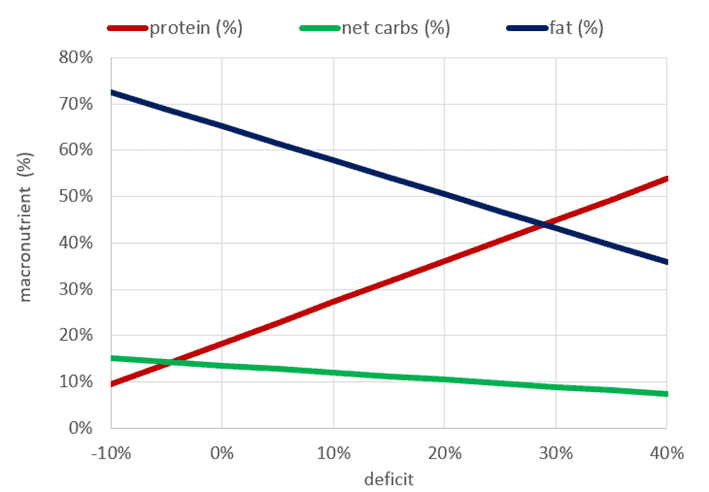
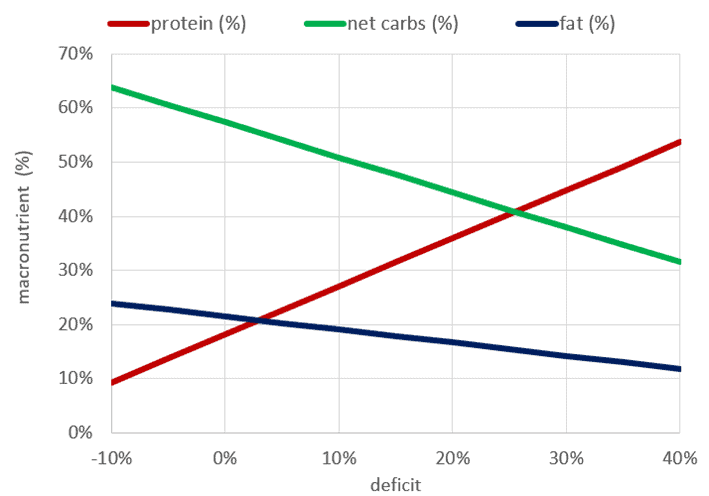
Deficit vs Macros (%)
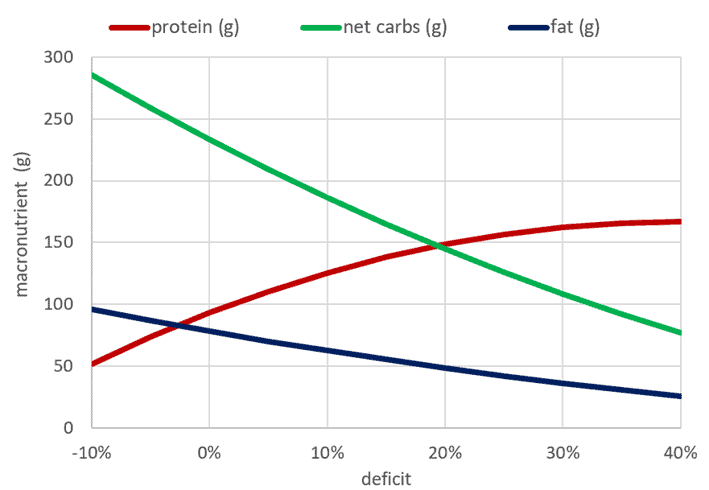
The following chart shows the per cent change in macros (in percentage terms) required to achieve various levels of deficit and excess using typical Aussie macros as the starting point.

Towards the extreme right, we would need to consume 54% protein while dialling down carbs and fat to achieve a 40% deficit. However, the average Aussie would only need to bump up protein % from 18.4 to 31% to achieve a more sustainable 15% deficit.
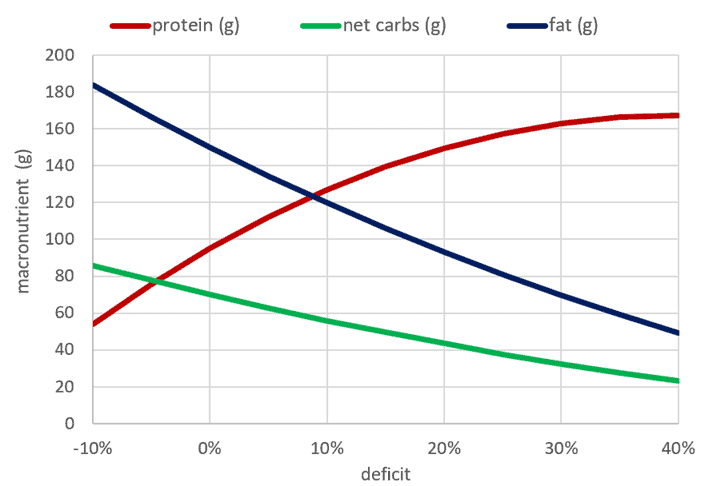
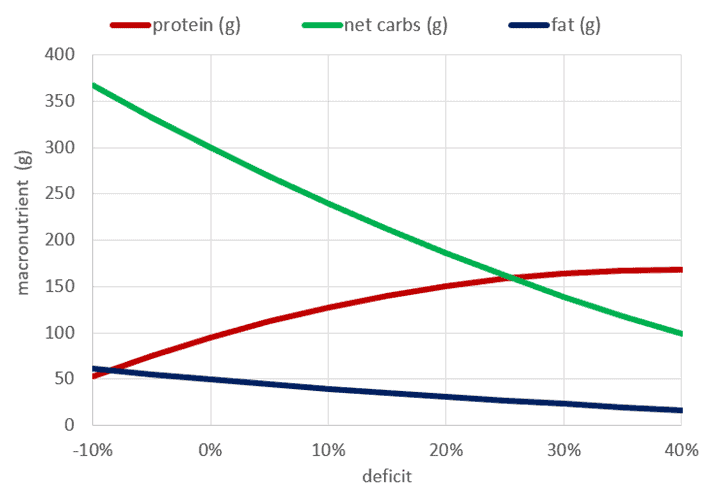
Deficit vs Macros (g)
The chart below shows the average Aussie scenario in grams of each macronutrient. Protein increases to achieve greater satiety in a deficit, while energy from both carbs and fat decreases to achieve the energy deficit.
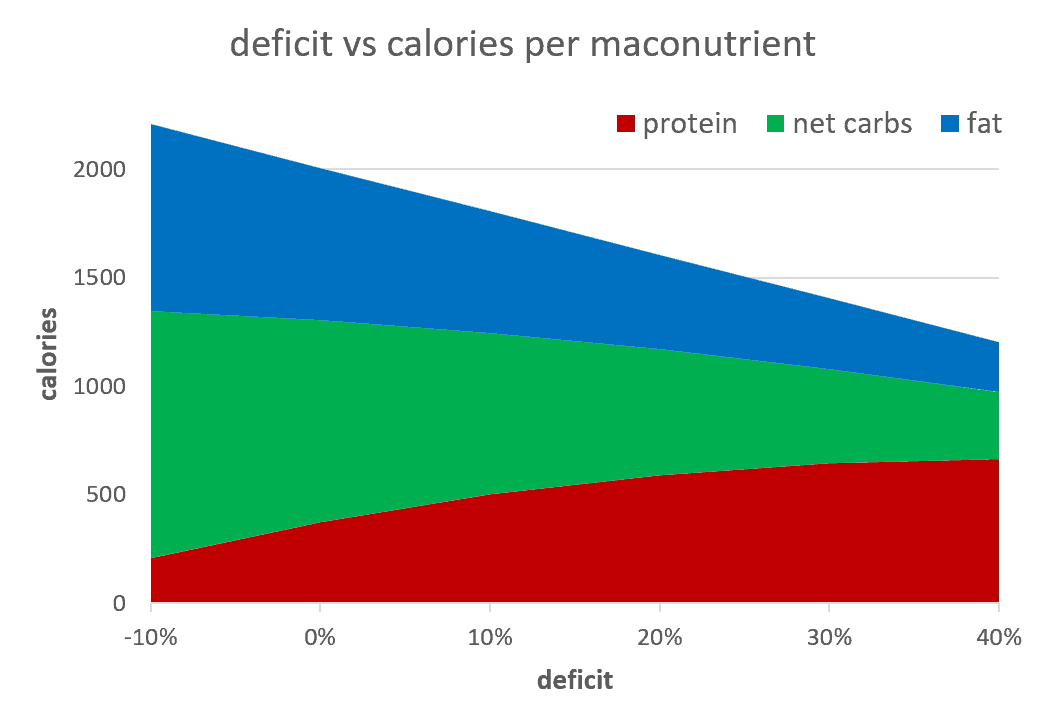
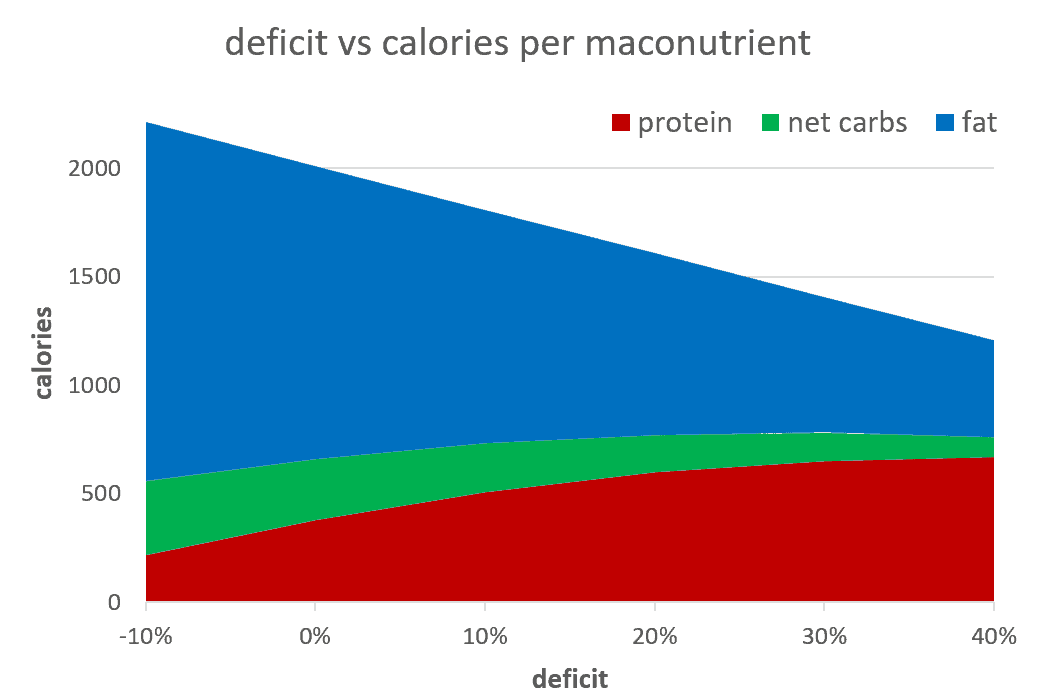
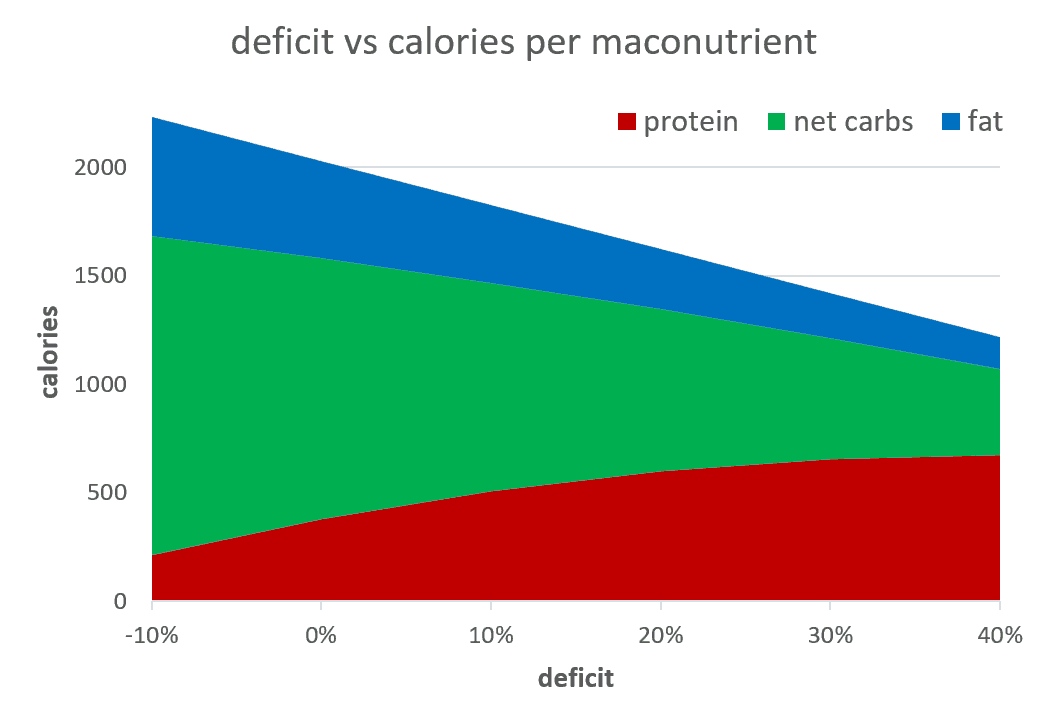
Deficit vs Calories Per Macronutrient
The next chart shows how the calories from each macronutrient would vary with an increasing deficit. Protein increases while the deficit comes from both fat and carbs.
Deficit vs protein (g/kg LBM)
This final chart shows the protein intake in grams per kilo of lean body mass (LBM) (assuming 30% body fat).
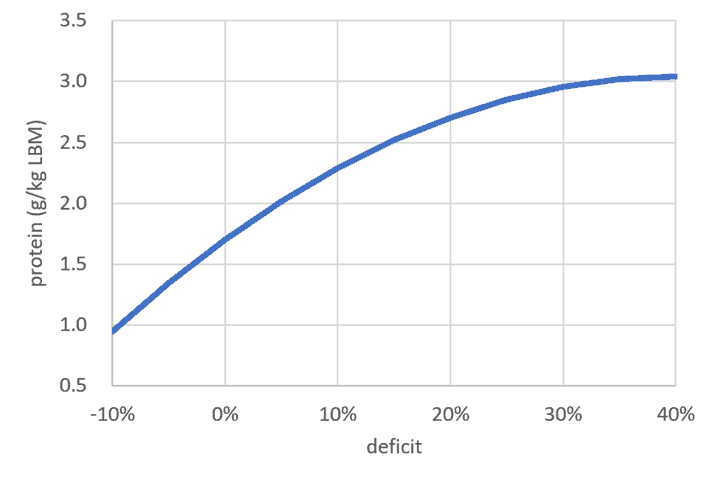
The average Aussie maintains their weight at a protein intake of 1.7 grams of protein per kilogram (kg) of lean body mass (LBM) (g/kg LBM). However, we could increase this to 3.0 g/kg LBM as the deficit becomes more aggressive. Not only does this increase satiety, but it also helps to minimise the loss of precious lean mass while losing fat.
This aligns with the guidance for natural bodybuilders who are advised to consume 2.3 to 3.1 g/kg LBM of protein while cutting fat in preparation for a competition to increase satiety and prevent loss of lean mass (see Helms et al., 2014).
Your body aggressively protects your lean mass (i.e., the protein stored on your body in your muscles and organs). Therefore, a drop in lean mass while dieting triggers an increase in appetite, making it harder to maintain any diet because of the cravings that ensue. Hence, prioritising protein minimises our risk of intense cravings and rebound binging.
Scenario 2: Low-Carb
Next, we’ll look at someone maintaining their weight on a lower-carb diet with the following maintenance macros:
- Protein = 95 g (18%)
- Net carbs = 70 g (14%)
- Fat = 150 g (65%)
Deficit vs Macros (%)
Again, we see their intake of fat and carbs drop while their protein % increases.
In our Macros Masterclass, we find that people do best when they progressively work up to 30-40% protein for weight loss. Exceeding 50% protein tends to be hard to sustain without more hunger and a tendency to rebound binge on energy-dense comfort foods, which can quickly undo all your hard work.
Deficit vs Macros (g)
The chart below shows the macros for the low-carb scenario in grams. A typical 20% deficit aligns with a moderate increase of around 50 g of protein per day.
Interestingly, the increase in protein tapers off when we exceed a 30% deficit and decreases once we exceed 40%. You can’t consume more protein while also being in a deficit at the same time.
Deficit vs Calories per Macronutrient
This final chart shows how the energy from each macronutrient varies as the deficit increases. While the carb intake of someone on a low-carb diet might decrease somewhat, most of the energy deficit comes from fat because it makes up most of their maintenance energy intake.
In our Macros Masterclass, we always see the best results when people gradually increase their protein % by modifying their diet and forming new habits around food. Jumping from one extreme to the other rarely lasts. Hence, we guide people to identify their maintenance macros. They can then dial back excess energy from fat and/or carbs while prioritising protein.
Scenario 3: Low-Fat
Finally, let’s see how this would look for someone on a low-fat diet with the following maintenance macros:
- Protein = 95 g (18%)
- Net carbs = 300 g (57%)
- Fat = 50 g (22 %)
While we find it helpful to dial back your carbs if your blood glucose is volatile (e.g., you see a rise of more than 30 mg/dL or 1.6 mmol/L after eating), it doesn’t matter much if you prefer to get your energy from carbs or fat.
Deficit vs Macros (%)
The chart below shows the change in macros (in percentage terms) to achieve a deficit (towards the right) or surplus (towards the left).
Deficit vs Macros (g)
Converse to the low-carb scenario, the low-fat dieter must achieve most of their energy deficit by dialling back carbohydrates.
Deficit vs Calories per Macronutrient
This final chart shows the deficit vs calories per macronutrient for someone starting on a lower-fat diet.
Your Results May Vary
Of course, the macro scenarios above are just theoretical estimates.
As you continue to diet, your body will use less energy to adapt to decreasing energy. Ensuring you get enough protein will minimise your chance of losing metabolically active lean body mass and increase your basal metabolic rate.
Continuously reviewing and tweaking your targets based on actual progress is ideal. In our Macros Masterclass, Optimisers follow the guidance of Nutrient Optimiser to progressively update their macro targets each week based on their progress.
For example, if someone isn’t losing at least 0.5% per week, Nutrient Optimiser will dial back energy from carbs and (or) fat. In contrast, if they’re losing more than 1.0% per week, Nutrient Optimiser will increase this person’s carb and (or) fat limits to prevent excessive hunger and rebound binging.
Challenges of High Protein %
While simple in theory, it’s not easy to maintain a very high protein % over an extended period. Hence, a lot of people fail when they try to lose weight.
It’s also not easy to jump right into it! While it might feel easy at the beginning, as you reduce added fat and sugar, you may eventually need to choose leaner cuts of meat, less fatty fish, and egg white omelettes over ones made with the yolk.
While this works—as demonstrated by the many successful bodybuilders that get lean out for their competitions—it’s not the most pleasurable way to eat all the time. It also becomes less sustainable as our bodies seek out energy.
Energy from fat and carbs gives us a dopamine hit, which helps make food enjoyable. Additionally, there is a limit to the amount of stored energy your body wants to release each day before releasing stress hormones, no matter how dialled in your diet is. So, eventually, you may experience hunger if you swing to a diet with a very high protein % overnight or if you stay on one for too long.
So, if you want to make it sustainable and ultimately reach your goal, it’s better if you start more gently and progressively change your habits around food. Then, you only need to pull out all the stops once you have to shave off the last few pounds to reach your goal!
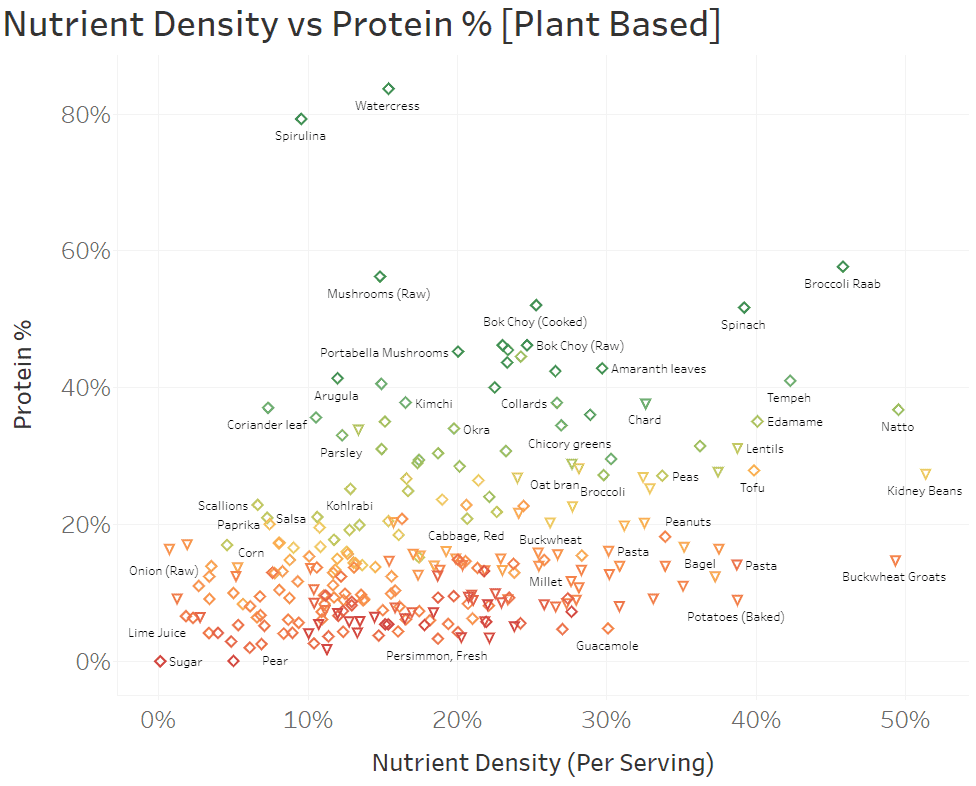
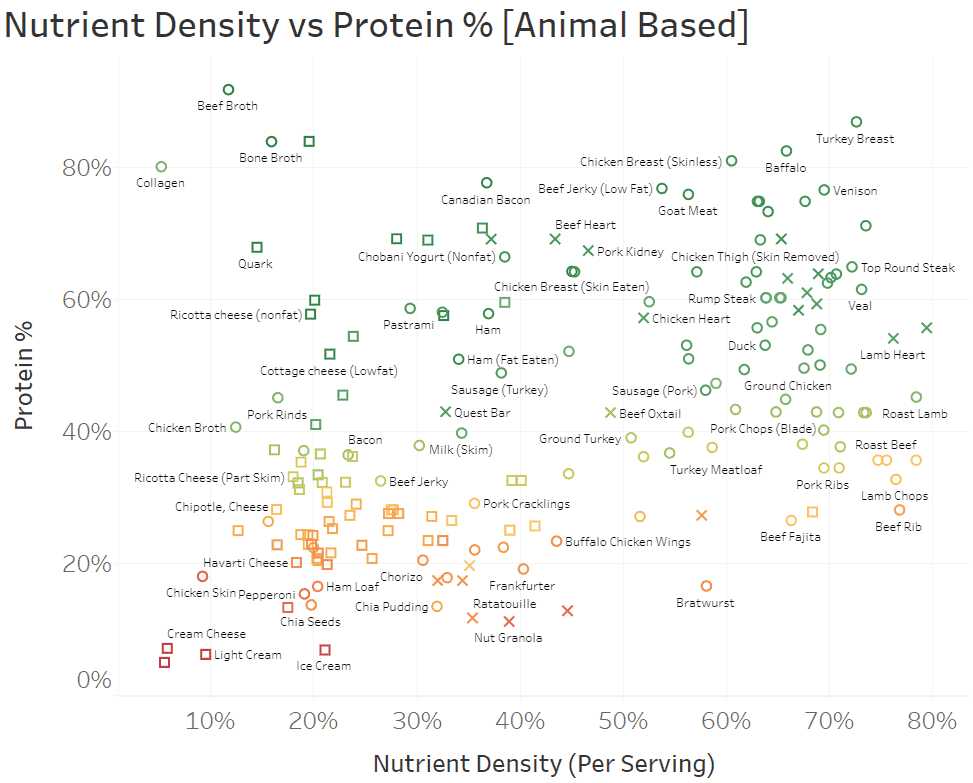
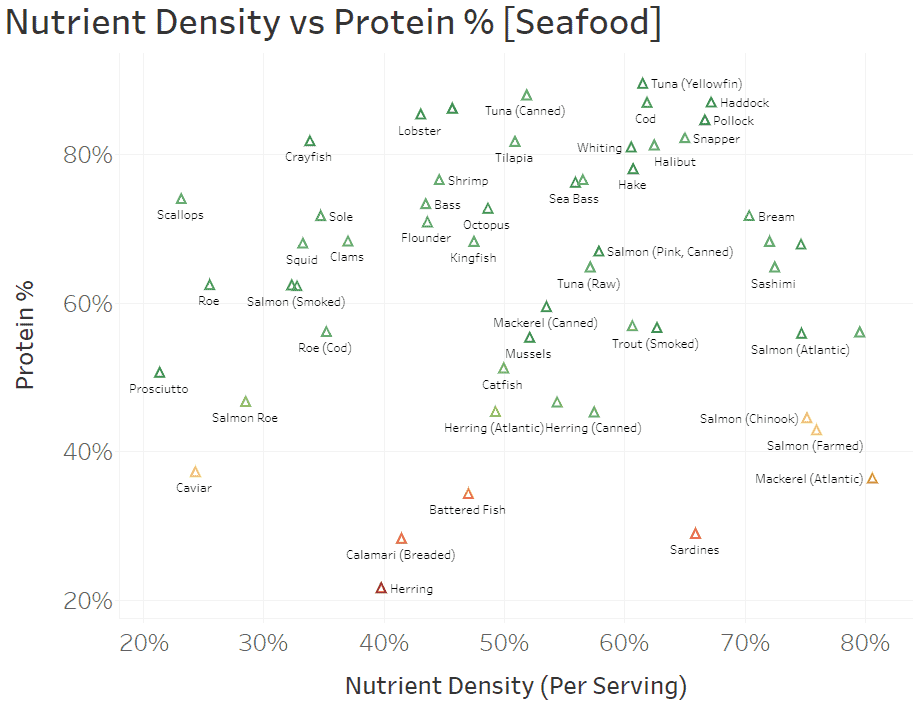
What Can I Eat?
To help Optimisers find foods that provide more protein and nutrients without excess energy, the chart below shows a range of popular foods on our nutrient density (per serving) vs protein (%) chart. For a more detailed version of the chart, you can click here to access the full version of this interactive Tableau chart.
The colouring is based on our satiety index score, or an estimated value indicating how satiating a food is.
- To increase your protein %, you can choose more foods toward the top of the chart while reducing foods towards the bottom of the chart.
- The foods towards the right will provide you with more nutrients per (typical) serving.

To help you navigate, the charts below show foods if we break them up into plant- or animal-based and seafood. You can use the tabs in the interactive Tabluea version to view the detail of each of these charts. These are also shown below.
NutriBooster Recipes
Over the years, we’ve used our insight on satiety and nutrients to develop a database of NutriBooster recipes (that we’re continuously adding to!). The chart below shows more than a thousand recipes we have analysed on the landscape of diet quality score vs protein %. The colour coding is based on our satiety index score. For more detail, you can check out the interactive Tableau version here.
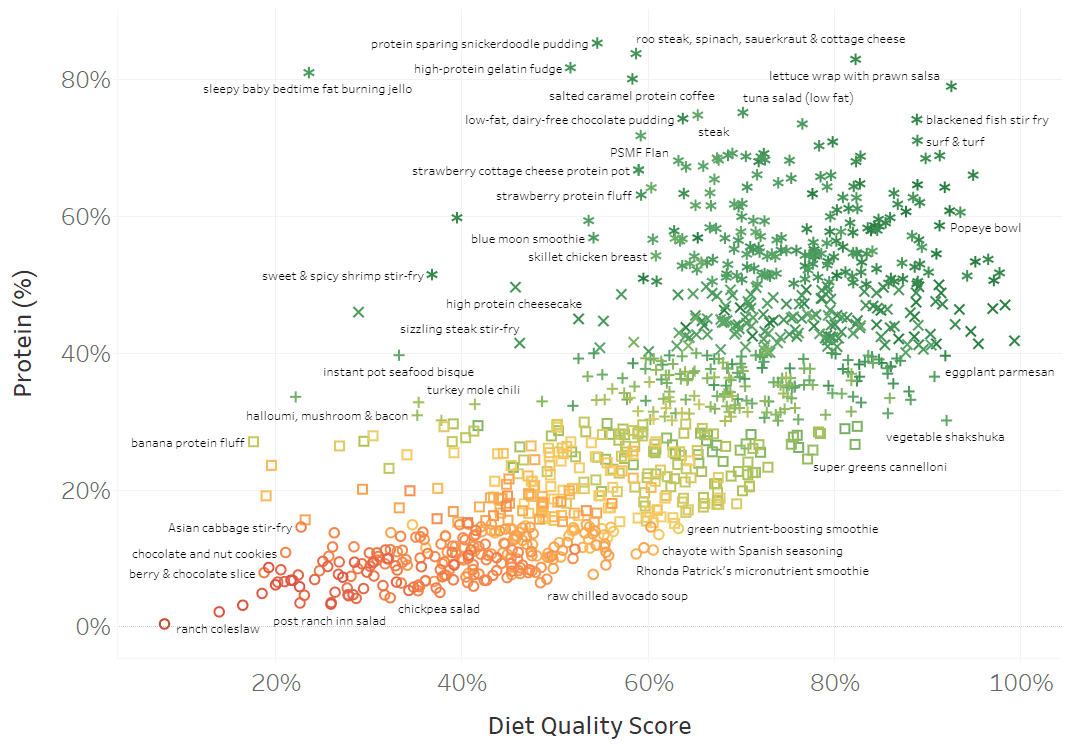
During the Macros Masterclass, we guide Optimisers to progressively find recipes that align with their target macros that they enjoy and can incorporate into their repertoire.