
In a world where dietary trends spin like a merry-go-round, one truth remains: we all need to include the most nutritious foods to get all the essential nutrients without empty calories, no matter your culinary inclinations or constraints.
Enter the superheroes of your diet – the most nutrient-dense foods, bursting at the seams with all the essential nutrients, including vitamins, minerals, and amino acids, the keys to your health and well-being.
Nutrient-dense foods pack in more essential nutrients your body needs to thrive per calorie.
Sadly, most nutrition advice today focuses on what you should avoid – you know, like red meat, saturated fat, plants, carbs, fat, sodium, cholesterol, omega 6, and oxalates!
Rather than fearing bad things in food, it’s critical to shift the focus towards ensuring an adequate intake of essential nutrients to promote overall health.
But when you put nutrients back in the centre of nutrition, all the ‘bad things’ in food become irrelevant. Eating becomes a numbers game where you simply focus on the foods that contain more of the essential nutrients your body needs to thrive with less of the energy you don’t.
Join us to discover nutrient-rich foods, protein-packed meats, and more. Our carefully curated food lists are your guide to a healthier, more vibrant you. Say goodbye to complex rules; these lists are your source of inspiration and culinary adventure.
Let’s explore the essence of nutrient density, learn how to calculate it, and answer common questions. Whether you’re pursuing better health, increased energy, or culinary delight, this article is your pathway to wellness.
- The Most Nutrient Dense Foods
- Embark on a Journey to Nutritional Nirvana!
- What is Nutrient Density?
- Nutrient-Packed Veggies
- Nutrient-Dense Meat
- Nutrient-Dense Seafood
- Nutrient-Rich Dairy
- Nutrient Dense Fruit
- How Do We Calculate Nutrient Density?
- Frequently Asked Questions
- Summary
- How Can I Calculate if I am Getting Enough Nutrients?
- Nutrient Density Starter Pack
- More
The Most Nutrient Dense Foods
We’ve created a range of simple infographics and food lists to help our Optimisers zero in on the most nutrient-dense foods that suit their goals and preferences.
Nutrient-dense foods span various food groups, from the veggie patch to the ocean depths, encompassing vegetables, fruits, legumes, seafood, eggs, lean meats, and low-fat dairy.
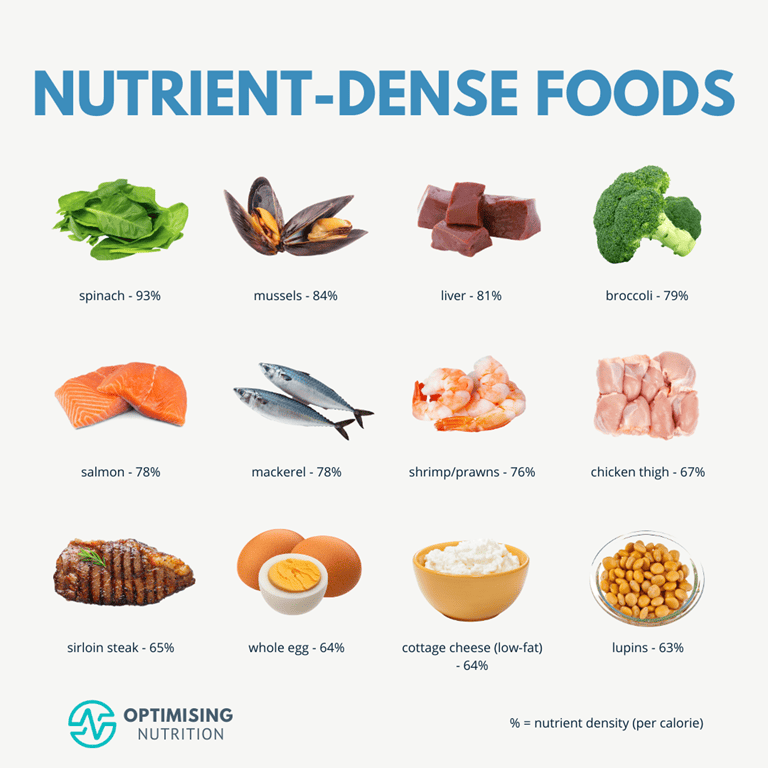
Commonly hailed as superfoods or power foods, these nutrient-packed champions, with their nutrient density scores, lead the charge, both in terms of popularity and the nutrients they will give you:
- spinach – 93%
- mussels – 84%
- liver – 81%
- broccoli – 79%
- salmon – 78%
- shrimp/prawns – 76%
- chicken thigh (skinless) – 67%
- sirloin steak – 65%
- whole egg – 64%
These foods are not only high in vitamins and minerals but also promote a host of health benefits, including boosting immunity and promoting longevity.
But here’s the twist – no solo act can deliver all the nutrients your body craves. Even these nutrient-packed warriors don’t score a perfect hundred. To conquer the micronutrient realm, you must assemble a league of complementary foods from diverse food groups, creating a symphony of nourishment.
Embark on a Journey to Nutritional Nirvana!
Are you ready to uncover the secrets to a healthier, more vibrant you? We’re thrilled to introduce you to our treasure trove of nutrient-dense food lists, and it’s all yours for the taking!
Download our Nutrient Dense Food Lists Here
Our carefully crafted food lists are your map to a world filled with delicious and nutrient-packed options. Whether you’re aiming for better health, increased energy, or just want to treat your taste buds, we’ve got you covered. These lists are like the X on the treasure map, leading you to a goldmine of wellness.
These lists aren’t just about following strict rules. They’re your source of inspiration and a chance to broaden your culinary repertoire. Explore, experiment, and embrace new flavours, textures, and in the adventure that awaits you.
What is Nutrient Density?
Before we delve deeper into the nutritional treasures hidden across other food groups, let’s unveil the essence of nutrient density and understand why they are considered the most nutritious foods.
Nutrient density is simply a measure of the nutrients per calorie within a food or meal.
Nutrient-dense foods are your secret weapon, allowing you to stock up on essential nutrients without piling on unnecessary calories.
Imagine your appetite as a nutrient-seeking missile, instinctively hunting for the precise nutrients your body craves. Nutrient-dense foods are like your secret hack to satisfy cravings with less energy. Perfect for those seeking to manage hunger, boost satiety, shed pounds without battling Herculean willpower, and fortify their body with the nutrients it craves without the guesswork.
Nutrient-Packed Veggies
When it comes to the most nutritious foods, non-starchy vegetables are the reigning champions, packing a punch of vitality with minimal calories. These green gems are like nature’s nutritional superheroes, and they’re here to take your well-being to new heights!
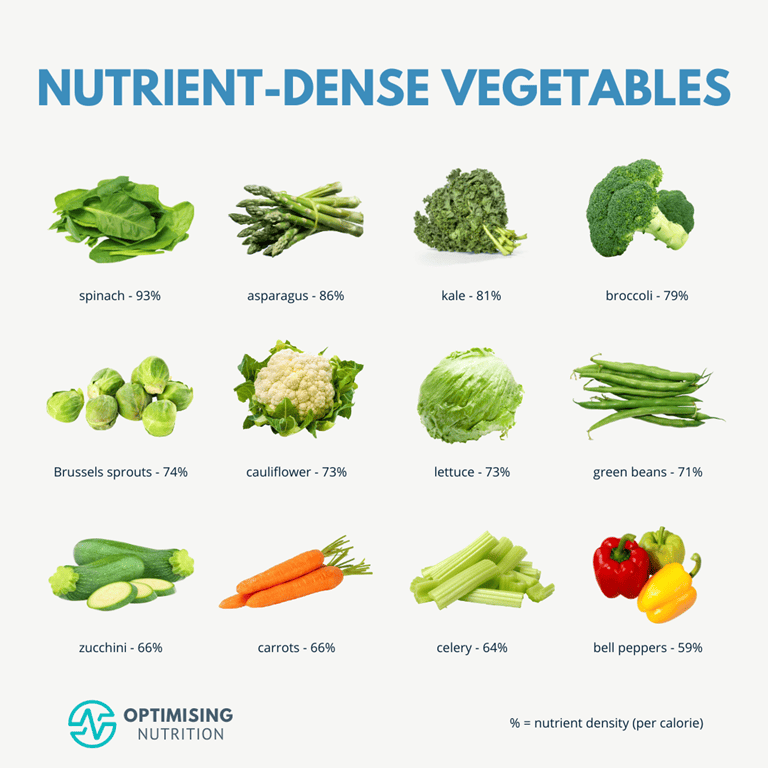
Popular picks among our Optimisers include:
- spinach – 93%
- asparagus – 86%
- kale – 81%
- broccoli – 79%
- Brussels sprouts – 74%
- cauliflower – 73%
- zucchini – 66%
- carrots – 66%
- celery – 64%
- bell peppers – 59%
Getting all the protein and energy you need from these foods alone will be challenging. But once you’ve met your energy and protein quota, these verdant heroes fill the gaps in your micronutrient profile.
Nutrient-Dense Meat
While veggies often hog the spotlight for being the most nutritious foods, animal-based foods come to the rescue, especially for protein and B vitamins. These foods are also a great source of lean protein. Because we tend to eat more of these foods than non-starchy vegetables, we often get more of the nutrients we need from them, particularly protein and B vitamins.
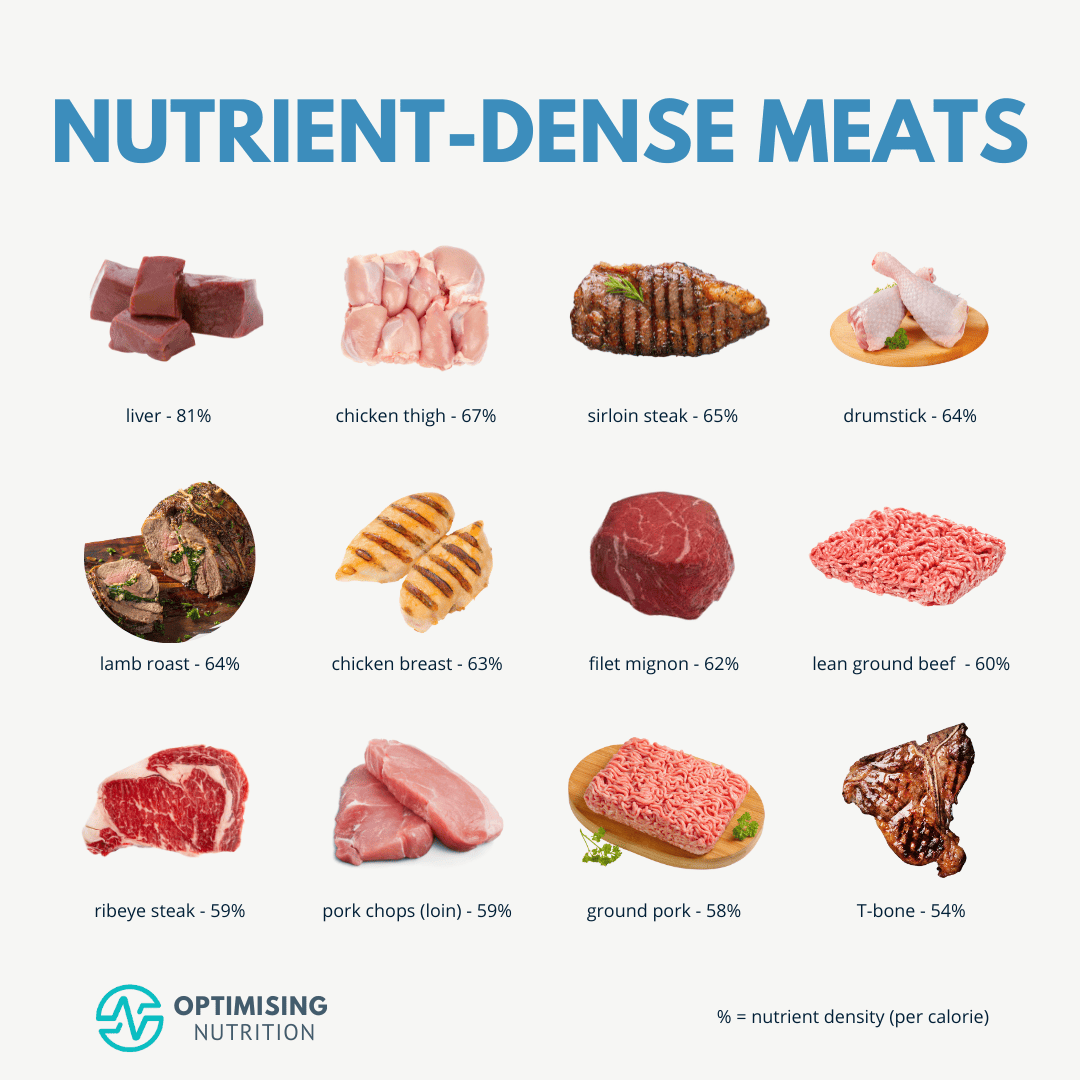
Here’s the roster of nutrient-dense animal-based foods:
- liver – 81%
- chicken thigh (skinless) – 67%
- chicken drumstick – 66%
- sirloin steak – 65%
- lamb roast (fat not eaten) – 64%
- chicken breast – 63%
- filet mignon – 62%
- ribeye steak (fat eaten) – 59%
- pork chops (loin) – 59%
- chicken thigh (skin eaten) – 58%
- pork roast – 57%
- ground beef (85% lean) – 56%
Nutrient-Dense Seafood
Seafood, the aquatic jewels, are not just protein-packed; they’re among the most nutritious foods, rich in health fats, like omega-3 fatty acids.
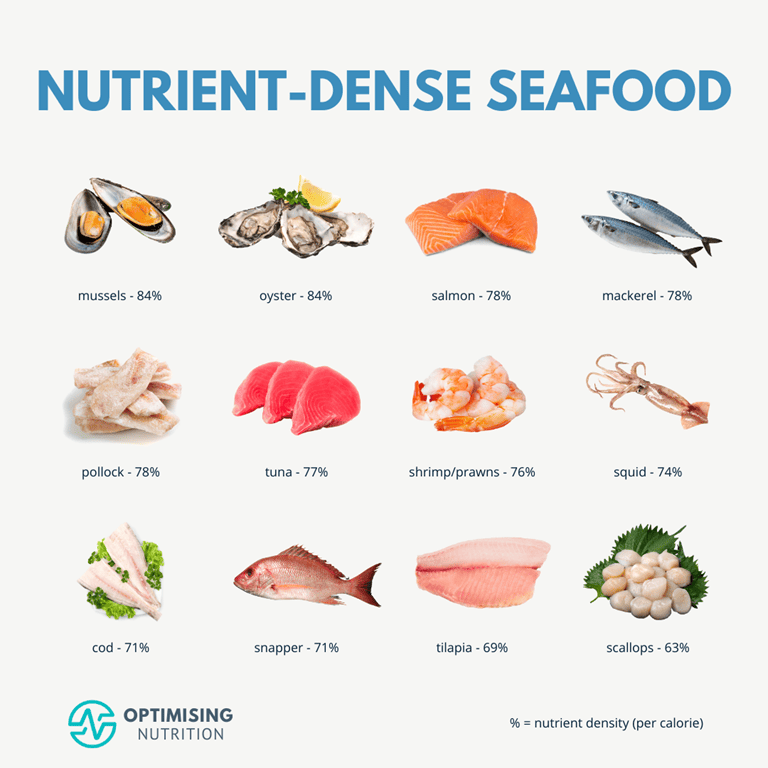
Some popular nutrient-dense seafood options are:
- mussels – 84%
- oyster – 84%
- octopus – 81%
- salmon – 78%
- mackerel – 78%
- pollock – 78%
- herring – 77%
- tuna – 77%
- caviar – 77%
- shrimp/prawns – 76%
Nutrient-Rich Dairy
Dairy shines as a bastion of nutrients, boasting calcium and protein in abundance.
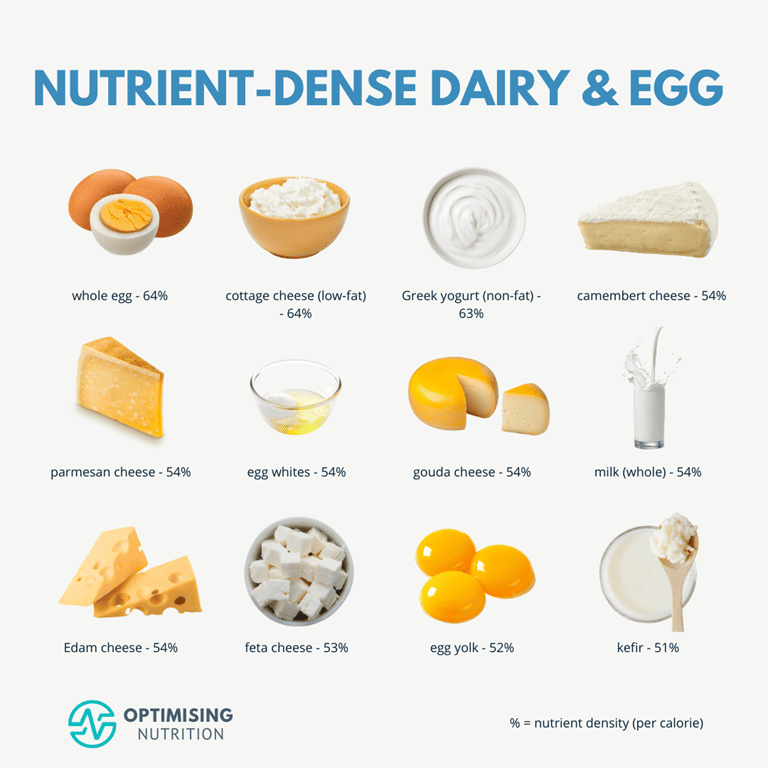
Here’s the cream of the dairy crop:
- whole egg – 64%
- cottage cheese (low-fat) – 64%
- Greek yogurt (non-fat) – 63%
- egg (fried) – 57%
- camembert cheese – 54%
- parmesan cheese – 54%
- gouda cheese – 54%
- milk (whole) – 54%
- Edam cheese – 54%
- protein powder (whey) – 54%
Nutrient Dense Fruit
Although modest in protein, fruit can provide more nutrients like potassium and vitamin C, seldom found in other food groups.
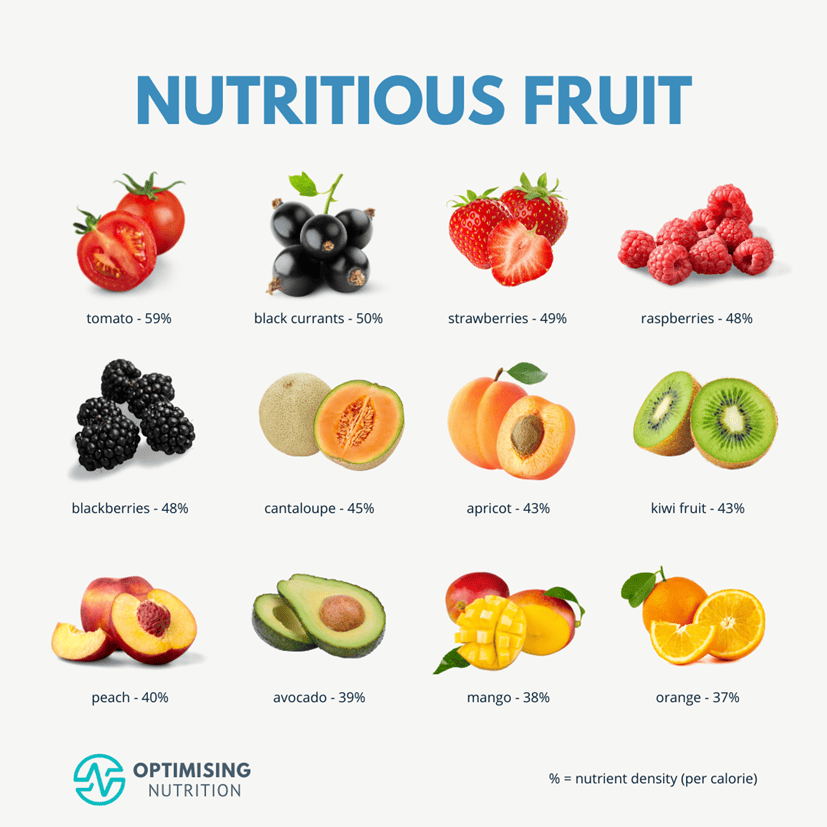
For those with glucose tolerance, consider these fruity delights:
- tomato – 59%
- currants – 50%
- strawberries – 49%
- raspberries – 48%
- blackberries – 48%
- mulberries – 45%
- cantaloupe – 45%
- apricot – 43%
- kiwi fruit – 43%
- peach – 40%
How Do We Calculate Nutrient Density?
Our satiety analysis shows that we have distinct cravings for all essential nutrients to some extent. Our data-driven insights show precisely how much of each nutrient we need to survive and the Optimal Nutrient Intake that aligns with greater satiety and vibrant health.
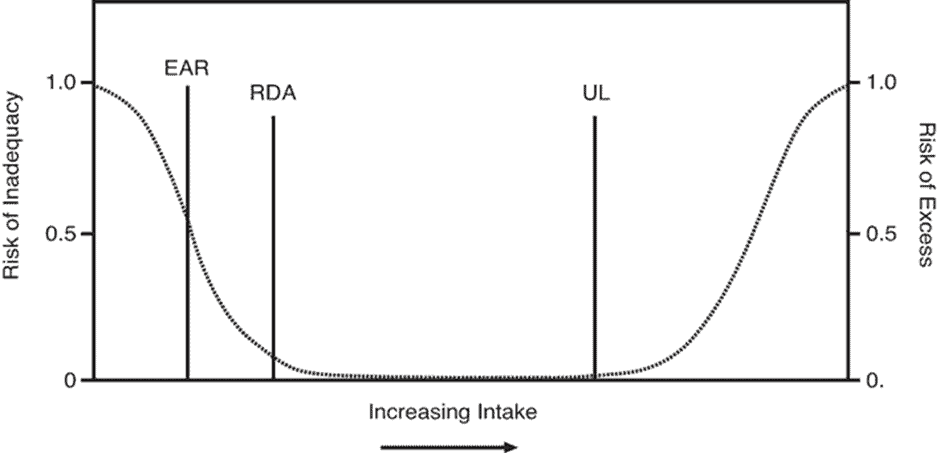
The chart below shows our response to calcium in food based on 313,835 days of data from free-living people. Towards the left of the chart, we see a ‘bliss point’ for calcium at 650 mg/2000 calories that aligns with maximum energy intake.
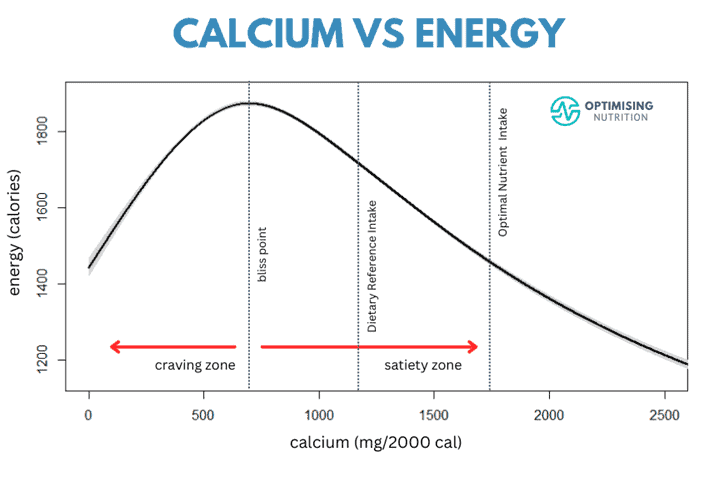
Foods with less calcium than this ‘bliss point’ are not as tasty, so we eat less. However, towards the right, we see that foods that contain more calcium per calorie satisfy our cravings for calcium more efficiently, with less energy.
While foods that contain even more calcium per calorie align with greater satiety, we’ve set our Optimal Nutrient Intake at 1650 mg of calcium per 2000 calories based on the 85th percentile calcium intake.
The Optimal Nutrient Intake for calcium is challenging but achievable with whole food. But once you’ve hit the Optimal Nutrient Intake for calcium, it’s time to focus on other nutrients rather than getting more calcium.
But it’s not just protein and minerals that we crave. We see a similar satiety response to vitamins. For example, the chart below shows the satiety response to vitamin B6. Notice that the bliss point for vitamin B6 is just a little higher than the Dietary Reference Intake.
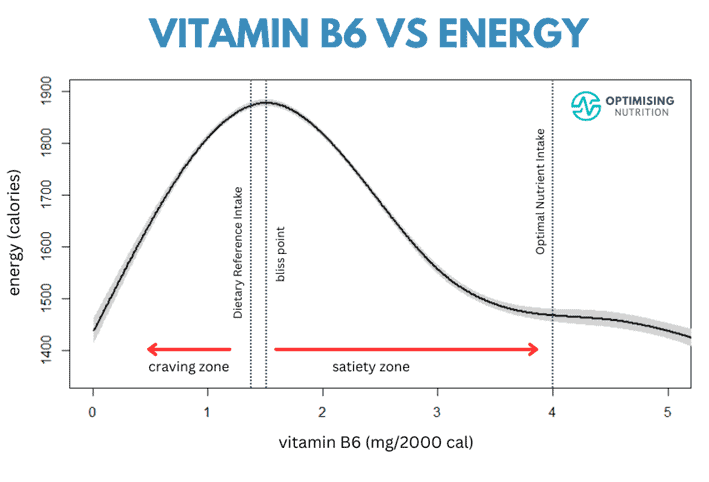
While many people get much more vitamin B6 from supplements and fortified foods, there is no additional satiety response to foods with more vitamin B6 above 4.0 mg/2000 calories. So, we’ve set the Optimal Nutrient Intake at the point at which the satiety responds to vitamin B6 tops out.
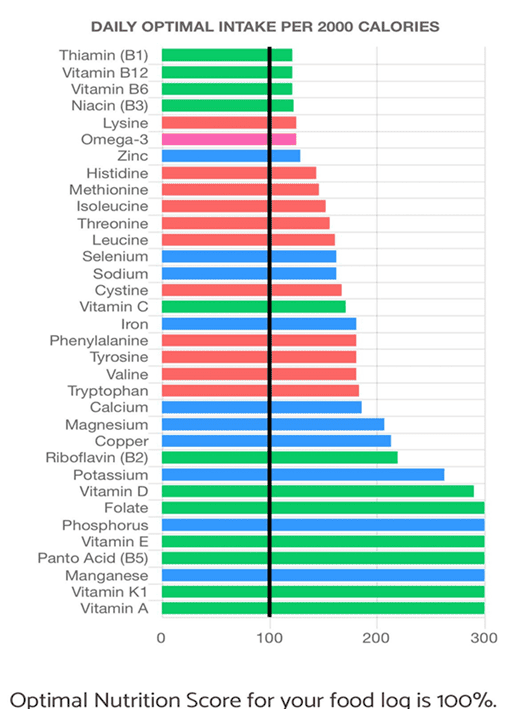
Setting an Optimal Nutrient Intake for each essential nutrient is critical to calculating nutrient density. As shown in the nutrient fingerprint chart below, if we can hit the 100% Optimal Nutrient Intake for all nutrients, we get a perfect score of 100%. This is definitely challenging to do, but many people achieve it in the final week of our Micros Masterclass.
The exciting thing about viewing your diet through the nutrient density lens is that it’s a measure of food quality, regardless of quantity. To improve your nutrient density, you don’t need to eat more; you just need to eat better.
For more on this, see The Diet Quality Score: Your Ultimate Measure of a Balanced Diet.
Frequently Asked Questions
Before we wrap, let’s touch on a few common questions about nutrient-dense foods.
Benefits of Nutrient-Dense Foods
Nutrient-dense foods offer a wide array of health benefits.
- Disease-fighting: Nutrient-dense foods are often health-promoting and disease-fighting. They can reduce the risk of chronic diseases like heart disease, diabetes, and cancer.
- Weight management: Nutrient-dense foods are usually lower in calories and higher in protein and fibre, helping to maintain a healthy weight and support your weight loss goals.
- Enhanced energy levels: Nutrient-dense foods provide vitamins, minerals, and antioxidants to support energy production and overall vitality.
Tailoring Your Nutrient-Dense Diet to Suit Your Goals
You can tailor nutrient-dense foods to support specific health conditions:
- Heart health: Fatty fish are excellent for omega 3 to support your cardiovascular system.
- Diabetes management: Non-starchy vegetables, meat and seafood help stabilise blood sugar. In our Macros Masterclass, we guide Optimisers to dial in their carbohydrate intake to achieve healthy blood glucose stability.
- Bone health: Foods rich in calcium and protein, such as dairy products and leafy greens, are critical for your bones.
- Digestion: Nutrient-dense foods are typically high in fibre, providing digestive benefits and promoting satiety for many.
Can You Get Too Much of a Nutrient?
Yes. If you’re taking synthetic supplements, you can overdo some nutrients.
However, this is not really a concern when you get your nutrients from whole foods. While supplements and fortified foods provide a bolus of nutrients that is often not absorbed but flushed out by your body, whole foods contain the nutrients in the forms and ratios your body understands and can absorb.
What’s more, if you’re focussing on improving your diet quality score, you’re chasing your priority nutrients towards your nutrient fingerprint chart, so you’re not going to overdo any of the nutrients.
While the commonly accepted Dietary Reference Intakes, Adequate Intakes and Estimated Average Intakes usually prevent short-term nutrient deficiencies, these intakes also align with the maximum calorie intake. So, by merely aiming for the minimum nutrient intake, you set yourself up for overeating.
Instead, striving for the Optimal Nutrient Intakes gives you a safety factor for your nutrition. It ensures your body has everything it needs to optimise short-term vitality and does everything it needs to maximise your long-term health. A nutrient-dense diet is also highly satiating because it crushes all your nutrient cravings with less energy.
Who Are Nutrient Dense Foods Not Appropriate For?
The major downside of nutrient-dense foods is that they are extremely filling. While this is great if your goal is to lose weight, this is not ideal for people who are at their goal weight or not yet meeting the minimum intake.
Additionally, we only eat some of the most nutrient-dense foods — like watercress, spinach and liver — in small quantities. So, although they are nutrient-dense, you may not get enough of the nutrients you need from them because you can’t eat enough of them.
If you’re not yet getting the minimum amount of each nutrient in your diet, you should focus on building the foundation of your diet with foods that provide more nutrients per serving (i.e. nutritious or nutrient-rich foods). Once you hit the minimum amount for most essential nutrients, you can focus on nutrient-dense foods to further dial up your satiety and vitality.
If you want extra guidance on how to pack enough of all the essential nutrients into your food, we’d love you to check out our Micros Masterclass.

Nutrient-Density on a Budget
Eating nutrient-dense foods doesn’t have to break the bank. Consider these budget-friendly tips for incorporating more wholesome foods into your diet.
- Plan meals and use leftovers: Meal planning helps reduce food waste and saves money. Use leftovers creatively for new meals.
- Shop in bulk: Purchase pantry staples like beans, rice, and whole grains in bulk to save on cost per serving.
- Buy generic brands: In many cases, store brands for unprocessed foods offer the same quality at a lower price.
- Join a Community Supported Agriculture (CSA): CSA programs provide fresh, locally grown produce at a lower cost.
For more details, see Get the Most Nutrients for Your Money: How to Eat a Nutritious Diet on a Budget.
Nutrient-Dense Foods on the Go
For those with busy lifestyles, here are some convenient nutrient-dense options:
- Greek yogurt is portable, protein-rich, and can be paired with fresh fruit and honey.
- Hard-boiled eggs are easy to prepare in advance and are rich in protein.
- Pre-cut veggies like carrot sticks, celery, and bell peppers are perfect for snacking on the go.
- Fresh fruits like apples, bananas, and oranges are portable and require no refrigeration.
Summary
Nutrient-dense foods are the cornerstone of a vibrant life. With answers to your questions and actionable advice, you possess the keys to integrate them into your daily routine.
Embrace the power of nutrient density, unlock the path to optimal nutrition, and revel in the benefits of a healthier, more vibrant you. Your body and mind will sing your praises for embracing plant-based and antioxidant-rich foods.
How Can I Calculate if I am Getting Enough Nutrients?
Curious about your nutrient intake? Take our Free 7-Day Nutrient Clarity Challenge and discover if you’re hitting the vitamin A sweet spot in your diet.
After a few days of tracking your daily meals with Cronometer, Nutrient Optimiser will unveil a personalised roadmap, your guide to a healthier, more nutrient-rich lifestyle.
You’ll receive a curated list of foods and tantalising NutriBooster recipes that not only fill your vitamin A gaps but also ensure you’re not missing out on critical nutrients.
Ready to unlock your nutrient potential? Join the challenge and embark on a journey towards a brighter, healthier you!
Nutrient Density Starter Pack
Ready to supercharge your nutrition? Get our Nutrient Density Starter Pack – your all-access pass to a healthier, more vibrant you!

In our quest to make Nutritional Optimization a breeze, we’re thrilled to offer you this treasure trove of tools and resources when you join our vibrant Optimising Nutrition Community:
- Food Lists: Discover our carefully crafted lists optimised for each essential nutrient, tailored to your goals, preferences, and unique conditions.
- The Healthiest Meal Plan in the World: Peek into a week of mouthwatering, nutrient-dense meals that’ll leave you satisfied and energised.
- Recipes: Download delectable samples from our NutriBooster recipe books, designed to elevate your nutrition while tantalising your taste buds.
- 7-Day Nutrient Clarity Challenge: Unearth your priority nutrients and pinpoint the foods and meals that pack a nutrient punch so you can kickstart your journey to better health.
Don’t miss out on this incredible opportunity to transform your nutrition effortlessly. Join our community and unlock your path to a healthier, more vibrant you!
More
- Protein-Rich Foods: Your Guide to the Best Protein Sources for Higher-Satiety Weight Loss
- High Mineral Foods
- High Vitamin Foods
- Mineral Rich Foods
- Vitamin Rich Foods
- Unlocking the Power of Protein: A Comprehensive Guide to High-Protein Foods
- Nutrient Density: The Key to Better Health and Longer Life
- Nutrient-Dense Meals and Recipes: Eat Better, Feel Better
- The Most Nutrient-Dense Foods (per Calorie)
- Micros Masterclass