

Did you know nutrients come packaged in groups in the food we eat?
Some nutrients, like protein, get a lot of attention for their high satiety value. But it’s not just protein that provides the satiety response, it’s all the amino acids as well as the other nutrients that come packaged with higher protein foods.
Our satiety analysis shows we have strong cravings for other nutrients like fibre, potassium, calcium, sodium, and even some vitamins. But it turns out these single nutrients represent clusters of nutrients.
The complex matrix of nutrient-dense whole food is wonderful and mysterious! You can’t just use isolated synthetic nutrients and expect to achieve the same response!
This article unveils the other nutrients that come packaged with the dominant nutrients that get most of the attention.
Background
In our previous article, The Cheat Codes for Nutrition for Optimal Satiety and Health, we used multivariate linear regression analysis to demonstrate that many nutrients have a statistically significant independent correlation to greater satiety and hence a lower calorie intake.
This multivariate analysis eliminates other nutrients that don’t have as high of an association with energy intake. Interestingly, different nutrients are shown significant, depending on the subset of data considered.
In the complex food matrix, we likely have increased cravings for the cluster of priority nutrients instead of one single nutrient by itself. Because whole, unprocessed foods contain a complex of nutrients instead of isolated vitamins, minerals, fatty acids, or amino acids, the actual extent of satiety that a lower-priority nutrient provides may be hidden by more significant nutrients.
Similar to the optimal foraging theory, our innate appetite sends us in search of foods and meals that contain our priority nutrients. Once we have satisfied our need for the nutrient we initially lacked, our cravings redirect us towards foods containing nutrients that are the next highest priority.
While only a handful of nutrients are shown to have a statistically significant relationship with satiety, we don’t believe that we can really ‘hack satiety’ by simply supplementing with the shortlist of statistically significant vitamins, minerals, essential fatty acids, or amino acids. Instead, the satiety response we see likely results from the cluster of nutrients that accompany these primary nutrients in whole foods.
We will use this article to investigate this further and look at nutrients that appear to be lower priority for our population of Optimisers. We will then look at how they correlate with nutrients that appeared as a priority in our statistical analysis.
As you will see, many nutrients that don’t register as statistically significant are closely correlated with the nutrients that dominate the multivariate analysis. These other nutrients are effectively ‘hiding under the umbrella’ of the dominant nutrients.
In summary, the takeaway from this analysis is that a supplement stack of this nutrient shortlist would not provide the same satiety response as a nutrient-dense, whole-food diet that naturally contains all of the same vitamins, minerals, essential fatty acids, or amino acids.
Recap of the Nutrient Leverage Multivariate Analysis
The table below summarises the multivariate linear regression analysis and the independent relationship between the statistically significant nutrients and calorie intake.
| Nutrient | p-value | 15th | 85th | Calories | % |
| protein % | 0 | 19% | 44% | -486 | -31.6% |
| potassium | 2.18E-38 | 1931 | 5915 | -72 | -4.7% |
| fibre | 7.96E-48 | 11 | 44 | -70 | -4.5% |
| sodium | 1.14E-28 | 1480 | 5076 | -41 | -2.7% |
| calcium | 1.69E-17 | 469 | 1869 | -40 | -2.6% |
| pantothenic acid (B5) | 0.006 | 4 | 15 | -18 | -1.1% |
| folate | 0.22 | 167 | 956 | -7 | -0.4% |
| total | -47.6% |
As we can see, moving from 19% to 44% of total calories from protein (i.e., protein %) aligns with a 31.6% reduction in calories.
While protein is the most satiating nutrient, other nutrients like potassium, fibre, sodium, calcium, B5, and folate strongly correlate with satiety.
Thanks to the Protein Leverage Hypothesis, we know that most organisms will search for more energy (i.e., calories) until they get their protein fix. However, our data analysis shows that there may be a broader nutrient leverage effect at play. That is, it’s not just protein or amino acids that we crave, but instead, all the nutrients in the food we eat.
When we look at subsets of data, other nutrients like cholesterol (yes, you read that right), selenium, and riboflavin are also statistically significant.
When we look at vitamins, niacin—a nutrient often found in high-protein foods—tends to be the most satiating of this niche.
When we only look at minerals, selenium and phosphorus are also significant.
In the following sections, we’ll look at some of the most dominant nutrients and the other ‘lower-priority’ nutrients that tend to be clustered alongside them.
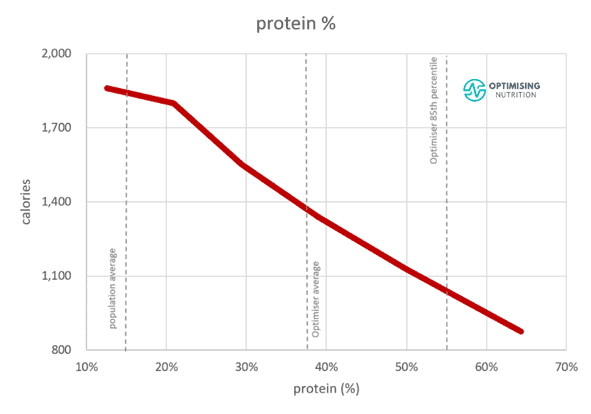
Protein %
Protein %, or the per cent of total calories from protein, was shown to be the parameter that elicits the most substantial satiety response. As the chart below shows, moving from a low to a high protein % aligns with a massive 61% reduction in calorie intake.
The table below shows the nutrients that are most closely correlated with protein.
| Nutrient | Correlation |
| phosphorus | 54% |
| niacin | 46% |
| potassium | 41% |
| selenium | 40% |
| cholesterol | 35% |
| vitamin B5 | 33% |
| riboflavin (B2) | 32% |
| calcium | 31% |
| vitamin B12 | 31% |
| iron | 31% |
As a general rule, we tend to find that protein and nutrient density go hand-in-hand and that high-protein foods also provide a complete profile of other nutrients. Hence, part of the observed satiety response to protein may be attributed to cravings for other nutrients clustered with protein, like niacin, potassium, selenium, and cholesterol.
Potassium, a nutrient found abundantly in plant foods like greens, vegetables, and some fruits, ranks third in correlation with protein. However, it shows as an independent satiety factor because high-protein foods do not tend to be the best sources of it.
In contrast, it is likely that phosphorus and niacin don’t appear as significant because they’re found so abundantly in high-protein foods like meat, poultry, fish, and dairy. Thus, you’ll likely get plenty of phosphorus and niacin if you get adequate protein from whole foods because the three tend to accompany one another. If we remove protein from the dataset, phosphorus and niacin still align with satiety.
For example, the table below shows the results of the multivariate analysis when we only consider the vitamins. In this instance, niacin ranks at #1.
| Vitamin | p-value | 15th | 85th | calories | % |
| niacin (B3) | 1.22E-213 | 13 | 53 | -174 | -11.2% |
| riboflavin (B2) | 2.88E-49 | 1.3 | 4.7 | -93 | -6.0% |
| vitamin K1 | 5.68E-87 | 33 | 958 | -67 | -4.3% |
| pantothenic acid (B5) | 4.93E-15 | 4.0 | 13.3 | -49 | -3.1% |
| total | -24.6% |
Because high-protein whole foods contain an array of nutrients, people who strive to increase their per cent of total calories from protein (i.e., protein %) from whole foods tend to increase their nutrient density or nutrients per calorie naturally. Hence, they tend to increase their intake of crucial nutrients that typically accompany protein, like vitamin A, the B vitamin family, vitamin K2, selenium, calcium, zinc, iron, and copper. Moreover, if they vary their protein sources, this may compound.
To increase our protein %, we do not necessarily need to eat a LOT more protein in absolute terms; instead, we need to reduce the proportion of total energy from fat and carbs in relation to protein. Dialling back energy from fat and non-fibre carbohydrates aligns with a greater protein % and a greater overall nutrient density.
Interestingly, most people don’t find protein powders, bars and supplements particularly satiating. Not only are they heavily processed and often designed to be hyperpalatable, but this analysis also shows that the lower satiety may be due to the lack of other nutrients often found in whole-food protein sources.
Fibre
Aside from protein, we see that fibre also correlates closely with many nutrients.
| Nutrient | Correlation |
| potassium | 46% |
| manganese | 46% |
| iron | 38% |
| vitamin C | 37% |
| vitamin K1 | 37% |
| folate | 37% |
| vitamin a | 35% |
| calcium | 32% |
| magnesium | 31% |
Potassium and fibre are both regularly found to be statistically significant. This indicates a strong satiety response to potassium independent of fibre. However, other nutrients like manganese, iron, vitamin C, and vitamin K1 may not appear significant because they are clustered in fibrous foods and ‘hidden’ by fibre’s dominant impact.
While fibre is undoubtedly crucial in the satiety equation, some of its attributed satiety response may be from other nutrients in this cluster.
It’s worth noting that processed foods do not contain much fibre. Hence, fibre often indicates minimally processed carbohydrate sources, which tend to be more filling, include more nutrients, and are thus harder to overeat.
Cholesterol
Cholesterol is modestly correlated with protein, which makes sense as cholesterol is found exclusively in animal foods.
| Nutrient | Correlation |
| protein (%) | 35% |
| phosphorus | 33% |
| riboflavin (B2) | 30% |
| selenium | 29% |
| pantothenic acid (B5) | 28% |
| vitamin (B12) | 22% |
| copper | 18% |
| folate | 17% |
| Iron | 16% |
| vitamin A | 15% |
| sodium | 15% |
One surprise from the multivariate analysis was that cholesterol tends to have a statistically significant correlation with satiety on its own, which suggests we may have intense cravings for it. Although we can produce most of our cholesterol requirements whether we eat it from food or not, we need plenty of it to build a healthy body.
The table below shows the results of our multivariate analysis when we include cholesterol. Here, our satiety response to protein reduces considerably (from 32% down to 20%), and our response to cholesterol comes in at around 12%. On average, people who consume more cholesterol consume 214 fewer calories per day. This suggests that much of the nutrient leverage effect we generally attribute to protein may actually be for cholesterol.
| Nutrient | p-Value | 15th | 85th | Calories | % |
| protein (%) | 4.36E-225 | 19% | 44% | -364 | -20.5% |
| cholesterol | 6.89E-144 | 241 | 1137 | -214 | -12.1% |
| fibre | 1.62E-49 | 11 | 44 | -153 | -8.6% |
| potassium | 2.13E-19 | 1931 | 5915 | -97 | -5.5% |
| sodium | 2.93E-30 | 1480 | 5076 | -95 | -5.4% |
| calcium | 1.59E-11 | 469 | 1869 | -67 | -3.8% |
| total | -55.8% |
While cholesterol is not essential, our observed craving for it is intriguing given all the negative press it has received since the 1950s when it was considered ‘a nutrient of concern’ that needed to be minimised. However, it’s even more interesting that these warnings were quietly removed from the 2015 Dietary Guidelines for Americans!
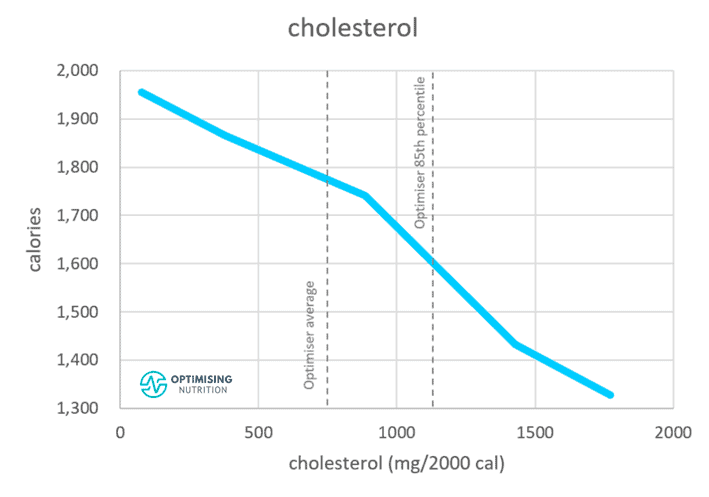
The following chart shows that foods containing more cholesterol per calorie tend to be more satiating. Avoiding foods containing cholesterol may lead to a less satiating diet, and it can make it harder to obtain other nutrients critical to satiety, like protein, vitamin B2, selenium, B5, B12, and copper.
Calcium
The following chart illustrates that we eat fewer calories when we consume more calcium.
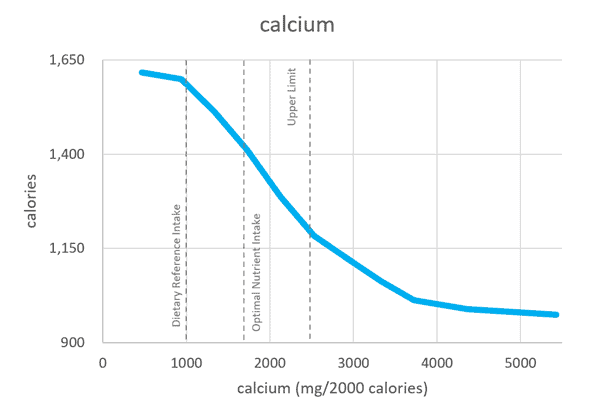
However, the cluster analysis shows that this strong satiety response may also be due to cravings for other nutrients like potassium, magnesium, phosphorus, and folate.
| Nutrient | Correlation |
| potassium | 46% |
| magnesium | 45% |
| phosphorus | 44% |
| folate | 40% |
| manganese | 40% |
| iron | 38% |
| riboflavin (B2) | 36% |
| vitamin K1 | 36% |
| pantothenic acid (B5) | 33% |
| fibre (%) | 32% |
Calcium is correlated closely with potassium. The fact that both of these nutrients regularly appear as highly statistically significant in the multivariate analysis suggests that we have intense cravings and demands for both of these minerals.
Both calcium and potassium are considered macrominerals, or minerals we require in larger absolute quantities. Calcium is the most abundant inorganic mineral in the human body, so it makes sense that we see a consistent, strong satiety response to high-calcium foods.
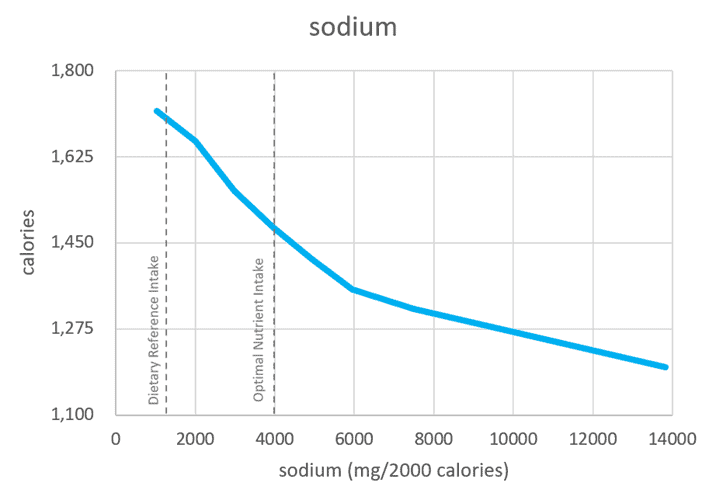
Sodium
Interestingly, sodium has few close neighbours in its cluster; the most immediate is potassium, with a relatively low 38% correlation. This may be why we have a distinct taste and craving for sodium over and above the other nutrients.
| Nutrient | Correlation |
| potassium | 38% |
| magnesium | 34% |
| calcium | 30% |
| protein (%) | 28% |
| phosphorus | 24% |
| vitamin k | 23% |
| folate | 23% |
| iron | 22% |
| selenium | 22% |
| zinc | 20% |
| riboflavin (B2) | 20% |
| vitamin A | 19% |
There aren’t many natural high-sodium foods besides salt. However, we add to other foods to cure, preserve, and make foods we consider ‘high-salt’.
The chart below shows that we have a strong satiety response to sodium up to about 6 grams/2000 calories.
In our Micros Masterclass, we find that most people do not need to prioritise sodium; instead, they get plenty of it and often need to prioritise potassium—the antagonist and synergist of sodium—to balance it out.
Riboflavin (B2)
It’s interesting to note that riboflavin (B2) is closely correlated with several other vitamins in particular, including pantothenic acid (B5), thiamine (B1), folate (B9), pyridoxine (B6), and niacin (B3). This likely explains why we don’t see B2 or B5 as statistically significant in the same analysis but instead as one or the other. Many of the vitamins tend to come packaged together in foods.
| Nutrient | Correlation |
| pantothenic acid (B5) | 72% |
| thiamine (B1) | 67% |
| folate | 57% |
| Vitamin (B6) | 53% |
| niacin (B3) | 51% |
| phosphorus | 51% |
| vitamin (B12) | 51% |
| potassium | 46% |
| iron | 45% |
| selenium | 40% |
| copper | 40% |
| magnesium | 37% |
Overall there is a relatively tight cluster of vitamins around B2, most of those being other members of the B vitamin family.
Data Limitations
In addition to the clustering effect discussed above, some data quality issues may contribute to the lack of statistical significance of other nutrients. Unfortunately, not all foods have rigorous micronutrient data available. Hence, other nutrients with better data may show a higher statistical significance.
For example, amino acids are measured less frequently, and certain microminerals may be evaluated less accurately because their contents vary based on the soil they are grown in. Additionally, many vitamins and microminerals are often used in fortification and supplementation, decreasing data quality and limiting our ability to assess the satiety response to nutrients in food accurately.
Non-Essential Nutrients
While we have data for the essential nutrients, the same cannot be said for other non-essential but beneficial nutrients we still know little about. Similar to how some nutrient clusters surround and accompany vital nutrients, it’s likely that other beneficial but non-essential nutrients do the same and play a role in the overall satiety factor.
Nutrient Foraging in the Modern Food Environment
While we have strong conscious cravings for some tastes and flavours like sodium, protein (savoury umami flavour) and energy from carbs (sweet taste), our analysis suggests that we may have subconscious cravings for some, if not all, of the other nutrients.
In our Micros Masterclass, people experience a dramatic drop in hunger as they learn to obtain all their priority nutrients from food.

Our modern food environment uses synthetic flavours and colourings to compensate for the lack of nutrients in ultra-processed foods. So it’s much harder to listen to our body’s cravings for nutrients in our food when the volume is turned up so loud.
We created Nutrient Optimiser to mimic the nutrient cravings of our natural appetite and guide people towards the foods and meals that contain their priority nutrients. It’s a fascinating iterative process where Optimisers continue to chase their priority nutrients from whole foods that tend to contain many of the other essential nutrients.
Rather than deprivation and restriction, chasing your priority nutrients turns eating well into a game where the goal is to nourish your body, which happens to end in satiety and fat loss!
If you’re interested in identifying your priority nutrients and the foods and meals that contain them, you can take our Free 7-Day Nutrient Clarity Challenge here.
Summary
- Because many nutrients are clustered within higher protein % foods, nutrient leverage seems to underly protein leverage. Rather than protein alone, we also crave other essential nutrients, like niacin, potassium, selenium, and cholesterol, closely clustered with protein.
- In addition to the nutrients clustered around protein, the multivariate analysis highlights other clusters of nutrients as statistically significant in the satiety equation, like potassium, sodium, vitamin B5 and folate. However, rather than a craving for this singular nutrient, it appears that these nutrients represent separate clusters of nutrients that tend to come together. Therefore, it’s likely more accurate to recognise our cravings for these dominant nutrient clusters rather than individual nutrients.
- Simplistic use of supplements or fortification would not provide the same satiety response that foods and meals that naturally contain a broad range of complimentary and synergistic nutrients in the form and ratios your body understands.