

Embark on a journey to uncover the most satiating foods that can help tame your hunger while fostering better nutritional choices.
This guide delves into the science of high satiety foods that promise a fuller feeling for longer, with fewer calories. With a blend of data-driven insights and a dash of culinary exploration, you’ll find a path to satiety that’s as enlightening as it is delicious. Step into a world where each meal is not just a feast for your taste buds but also a smart choice for your body’s satiety.
This is where mindful eating, science, and satisfaction converge. Dive in, explore, and let your hunger lead the way to smarter food choices.
- Background
- What Is Satiety?
- Satiety vs Satiation
- High Satiety Index Foods
- What Are the Most Satiating Foods?
- Nutrient Density of High Satiety Index Foods
- The Satiety Index
- Macronutrients and Satiety
- Micronutrients and Satiety
- Which Nutrients Align with Eating Less?
- Which Nutrients Have a Statistically Significant Impact on Satiety?
- What About the Other Nutrients?
- Can You Get Too Much of a Good Thing?
- The Satiety Response to Key Nutrients
- Will Low-Energy-Density Foods Help Me Eat Less?
- Next Steps
- Satiety Series
- More
Background
Satiety, or satisfying your cravings for fewer calories, is the holy grail of weight loss and dieting.
We may be able to track and limit calories for a while. But eventually, we all eat until we feel satisfied.
But, as you will learn, not all foods are created equal when it comes to satiety.

We’ve been on a five-year mission to quantify satiety to empower people to make more informed choices that allow them to eat fewer calories with less hunger.
This article showcases the results of our latest analysis to identify the most satiating foods and their unique properties.
We have used this deeper understanding to create a list of the highest and lowest satiety-index foods for you to try (or avoid).
What Is Satiety?
Satiety is simply the sensation of fullness you feel after eating.
A satiating food or meal leaves you satisfied for longer, with fewer calories.
Satiety vs Satiation
Before diving in, it’s critical to understand the difference between satiety and satiation.
- Satiation occurs when we feel full after eating and no longer want to eat in the short term. So, while some bulky, high-volume, low-energy-density foods might make you feel ‘stuffed’ in the short term, you’ll likely seek out more food before too long.
- In contrast, satiety refers to how full we feel over the longer term and occurs when we obtain enough of all the essential nutrients we require. People who eat more satiating foods feel fuller for longer and can trust their appetite to guide them when they need more nutrients and fuel.
High Satiety Index Foods
We recently updated our satiety index analysis to determine which foods promote satiety.
Our research is based on our unique dataset of 125,761 days of food logs that we collected from 34,519 Nutrient Optimiser users over the past four years.
This data includes both macronutrients and micronutrients, which enables us to determine the essential amino acids, fatty acids, vitamins, and minerals critical for satiety.
Later, we’ll explain the analysis in more detail. But for now, you’re most likely reading this to know what to eat and avoid for greater satiety.
So, let’s get straight to the point!
What Are the Most Satiating Foods?
The tables below show how the most popular plant foods, seafood, and animal-based foods are ranked by their satiety score. For simplicity, we’ve only shown foods that scored above 50%. You can access longer lists with other less popular foods here.
Plant-Based Foods
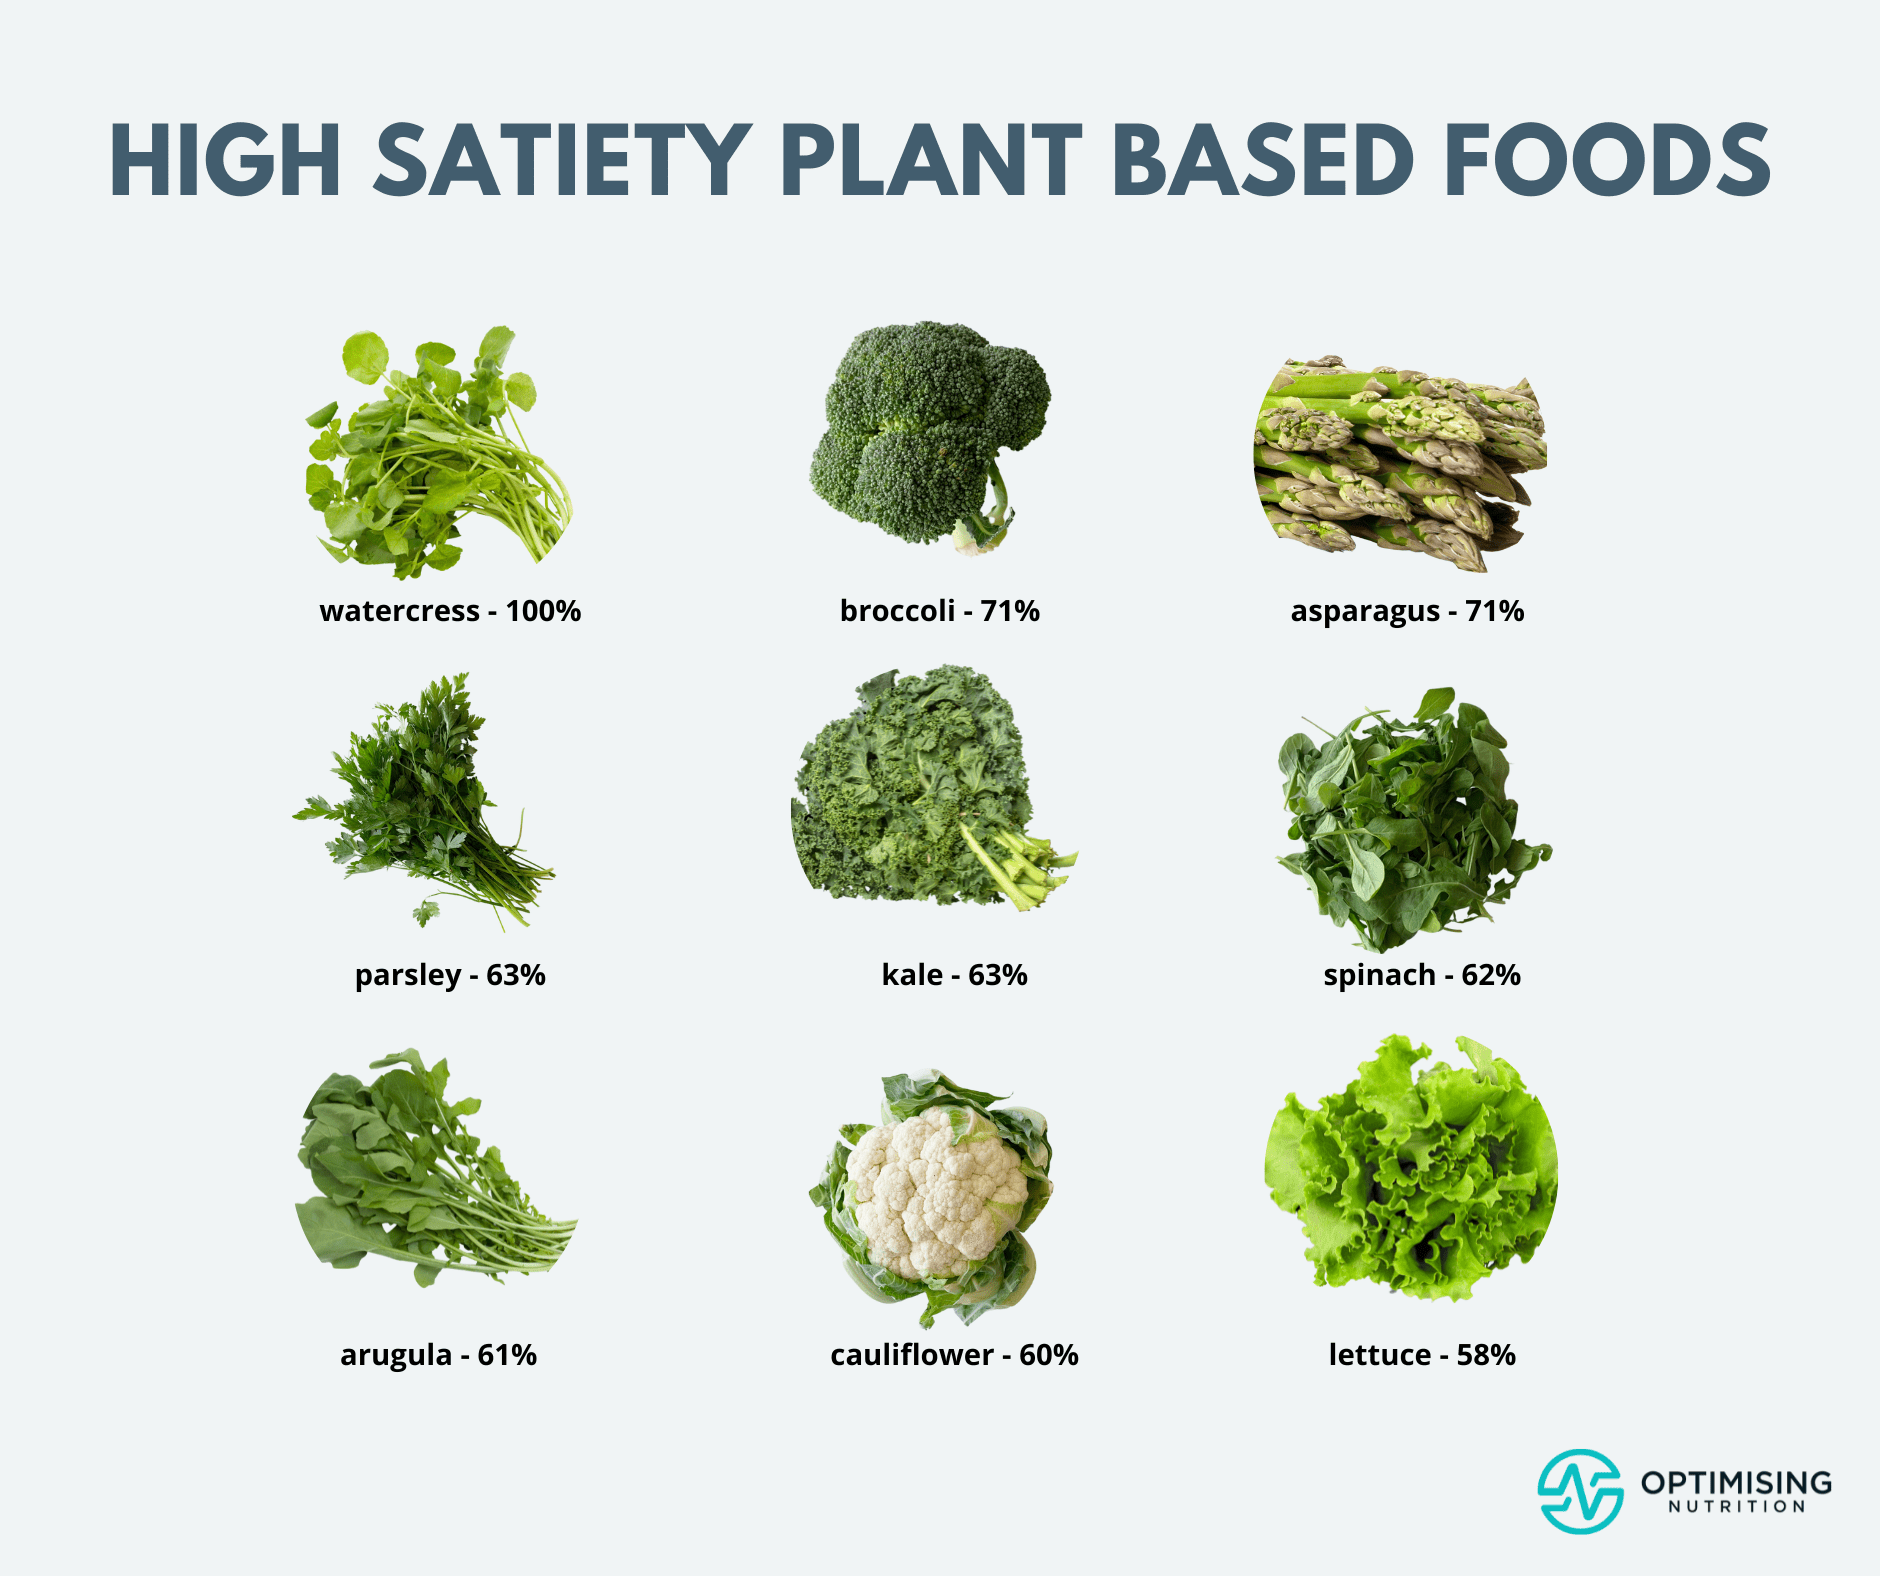
The most satiating plant-based foods include vegetables, fruits, grains, seeds, nuts, beans, and legumes. However, non-starchy vegetables like watercress, broccoli, and asparagus will fill you with fewer calories.
| Food | Satiety Score |
| watercress | 100% |
| broccoli | 71% |
| asparagus | 71% |
| parsley | 63% |
| kale | 63% |
| spinach | 62% |
| arugula (rocket) | 61% |
| cauliflower | 60% |
| lettuce | 58% |
| zucchini | 57% |
| coriander (cilantro) | 50% |
With that said, your stomach has a finite capacity. There is a limit to how much of these foods you can eat before you explode!
Not everyone loves their veggies, either. So, once you’ve had your fill of these foods, you can move on to the other foods listed below.
Seafood
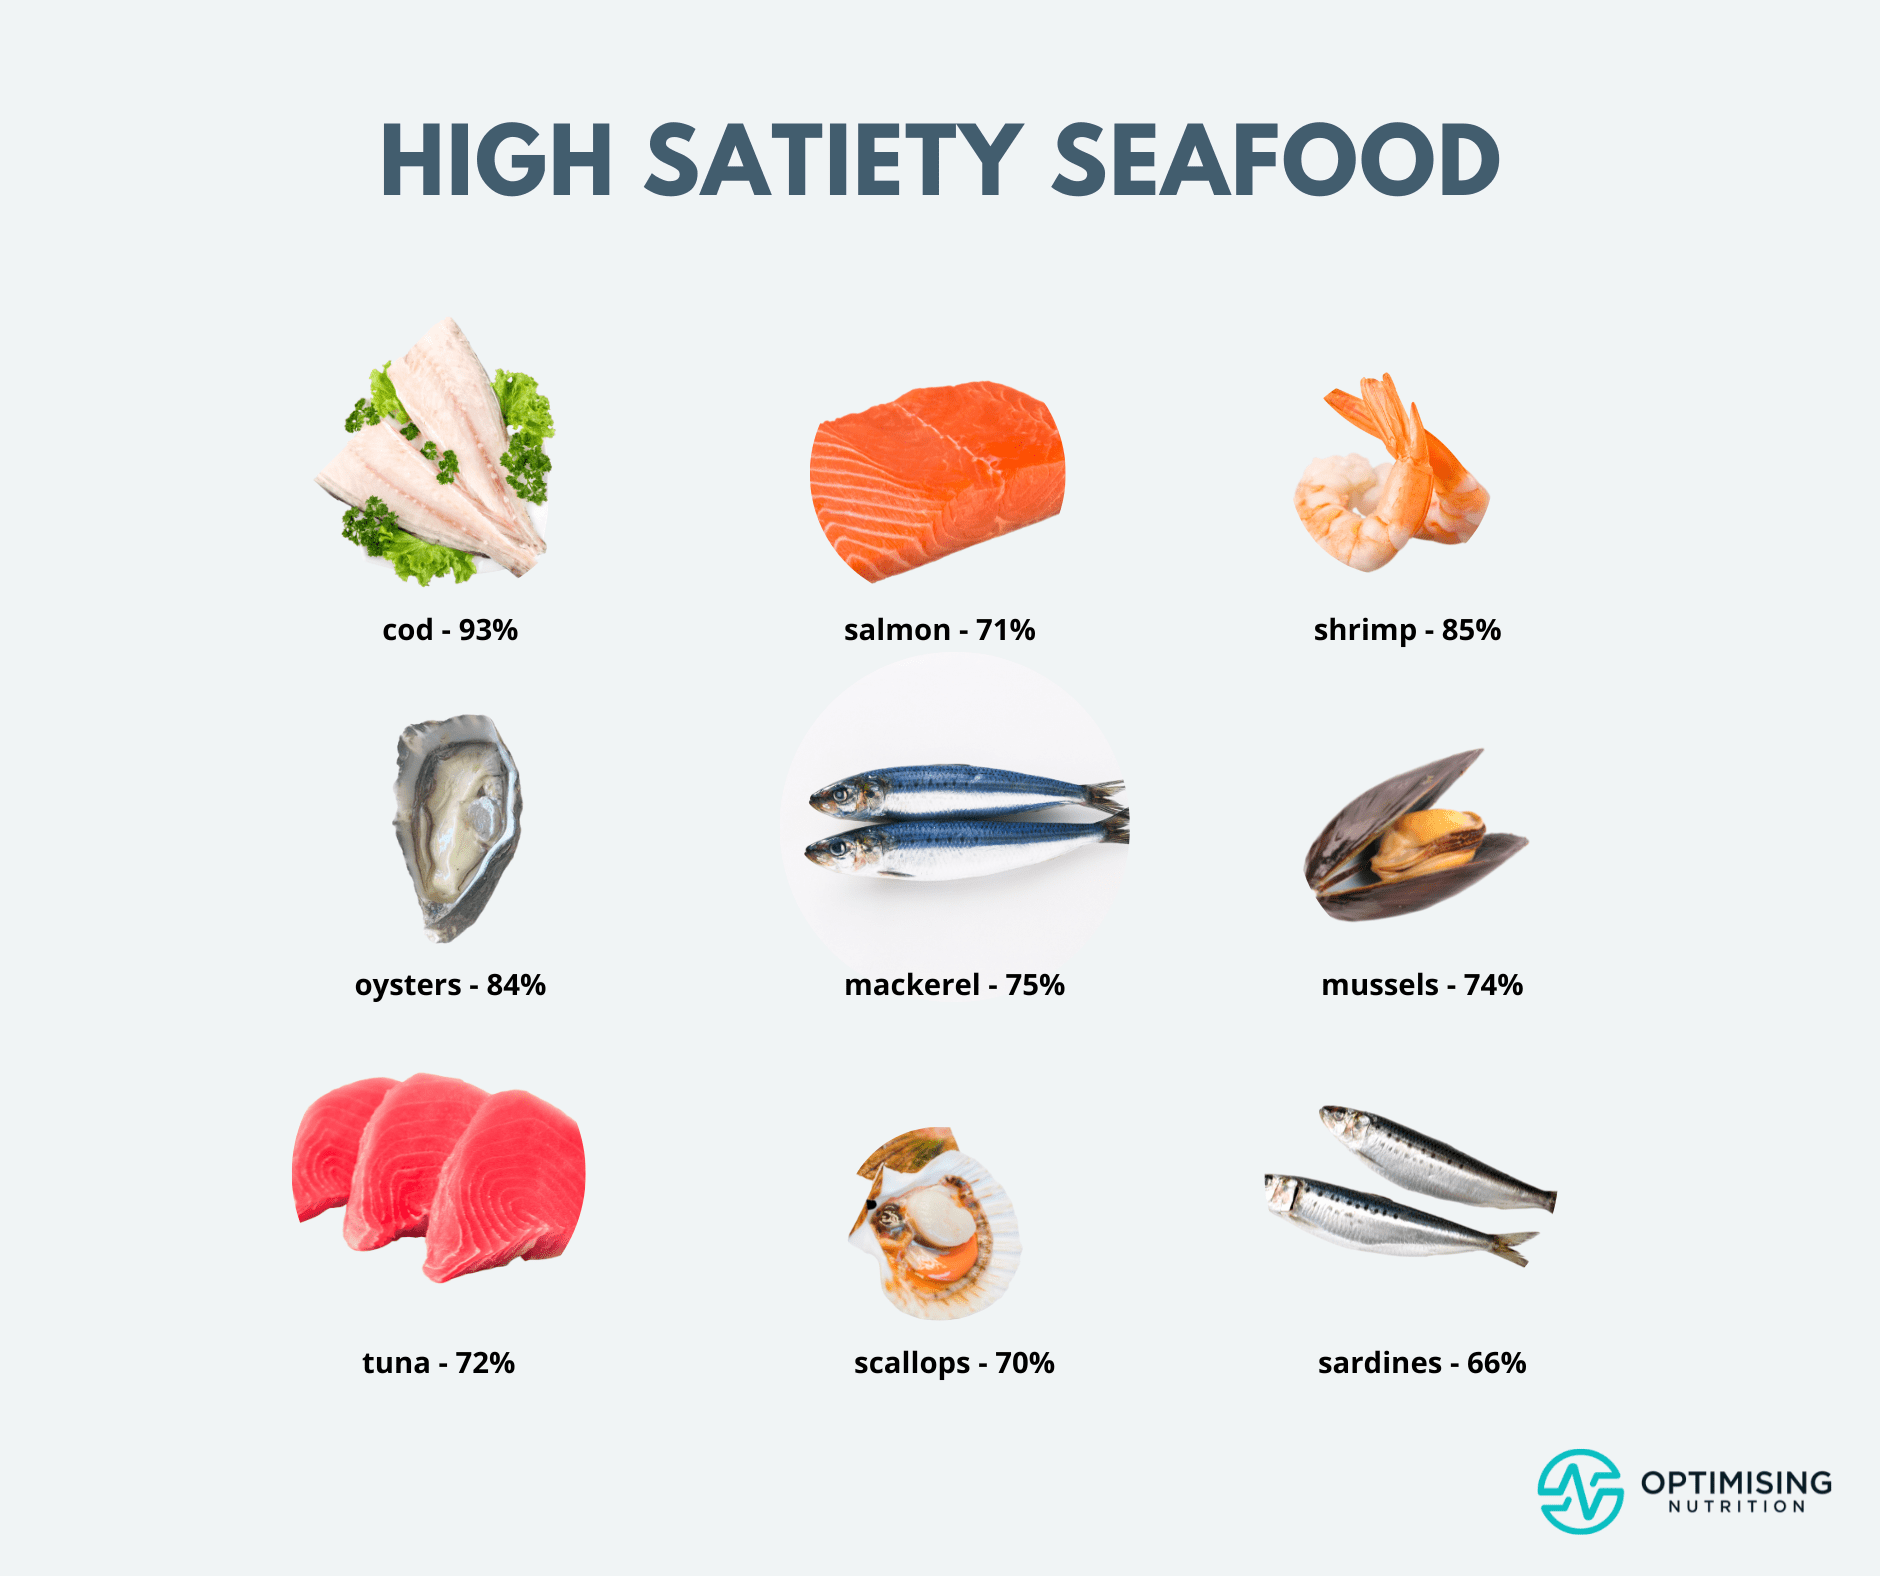
Because it has plenty of protein and a higher nutrient density, seafood tends to be satisfying. Seafood will also provide more energy to get you through the day than the non-starchy veggies listed above.
| Food | Satiety Score |
| cod | 93% |
| salmon | 88% |
| shrimp | 85% |
| oysters | 84% |
| mackerel | 75% |
| mussels | 74% |
| tuna | 72% |
| scallops | 70% |
| sardines | 66% |
| caviar | 60% |
Animal-Based
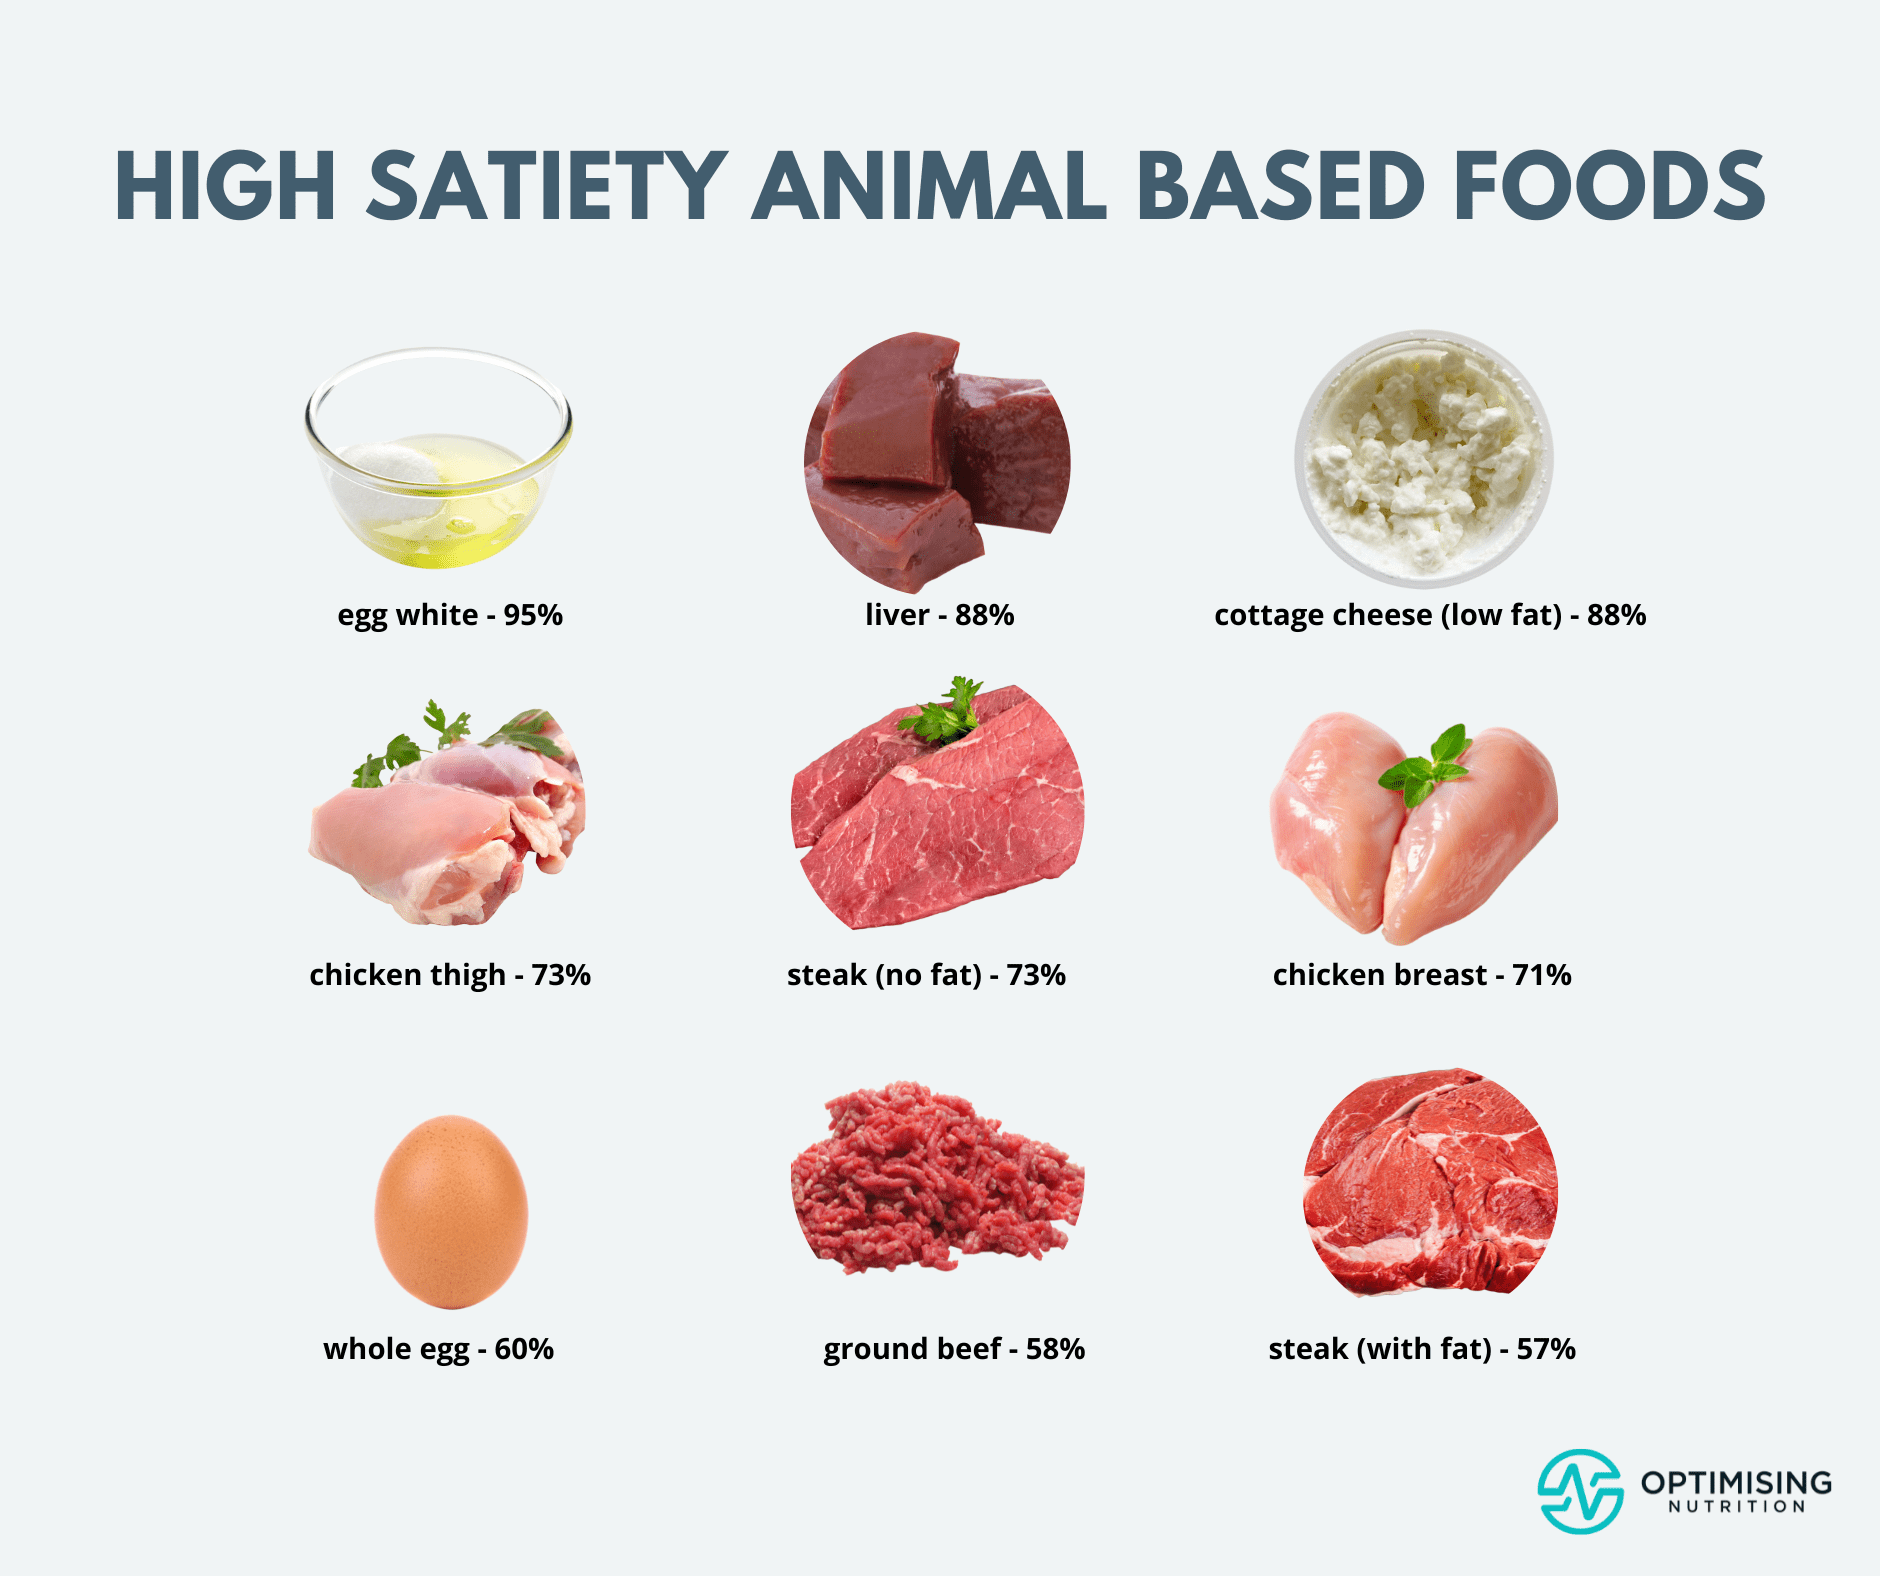
Next, we have animal-based foods like meat, poultry, eggs, and dairy products. Bodybuilders often use high-protein, low-fat foods like egg whites, low-fat cottage cheese, skinless chicken breast, and lean beef (listed towards the top) to lean out quickly.
| Food | satiety score |
| egg white | 95% |
| liver | 88% |
| cottage cheese (low-fat) | 88% |
| chicken thigh | 73% |
| sirloin steak (fat not eaten) | 73% |
| chicken drumstick | 72% |
| chicken breast (no skin) | 71% |
| whole egg | 60% |
| ground beef (lean) | 58% |
| sirloin steak (fat eaten) | 57% |
To identify your ideal protein intake, see Protein – Optimal vs Acceptable Macronutrient Distribution Range (AMDR).
Nutrient Density of High Satiety Index Foods
The chart below shows the micronutrient fingerprint of the most satiating foods, as evidenced by their high satiety index scores. Because micronutrients are part of the satiety index equation, high satiety index foods tend to be fairly nutrient-dense.
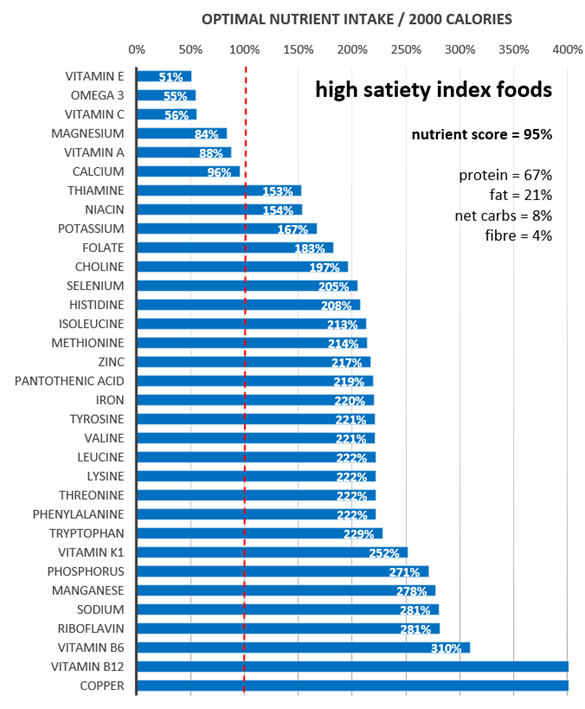
We know from our satiety analysis that the amino acids that make up protein are the #1 most critical nutrient for satiety. However, it’s worth pointing out that these high satiety index foods have a very high protein percentage. While these foods would be ideal for short-term rapid fat loss, this intense approach may not be sustainable for long.
For comparison, the following chart shows the micronutrient fingerprint of our maximum nutrient density foods. Because our nutrient density system emphasises all the micronutrients, we see a higher nutrient score and a more palatable protein level (45%).
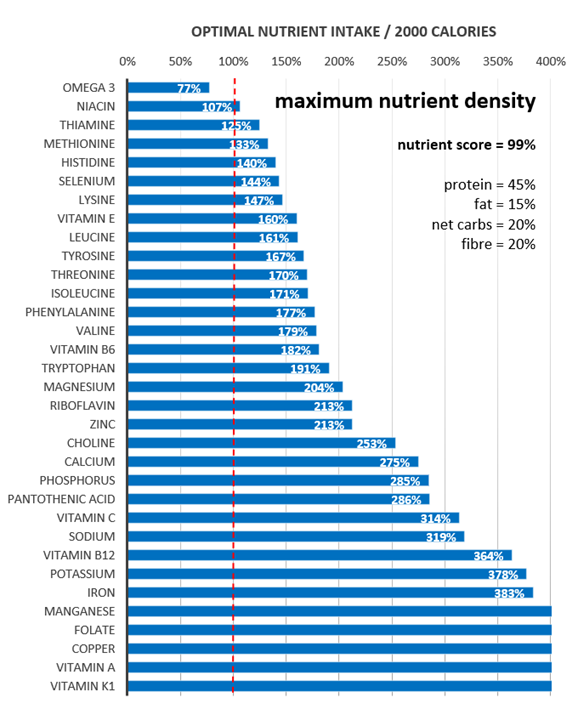
Except for people in the final weeks of prepping for a bodybuilding show who need to lean out fast, most people will benefit from adding more of these nutrient-dense foods instead of maxing out satiety or the protein:energy ratio. Instead, thinking in terms of nutrients vs energy (from fat and carbs) tends to be more helpful.
For more detail on these nutrient-dense foods, check out The Most Nutrient Dense Foods – Tailored to Your Goals and Preferences. You can also access our full suite of food lists ranked for different goals here.
If you’re interested in learning more about the details behind how we created our new satiety index ranking, read on.
The Satiety Index
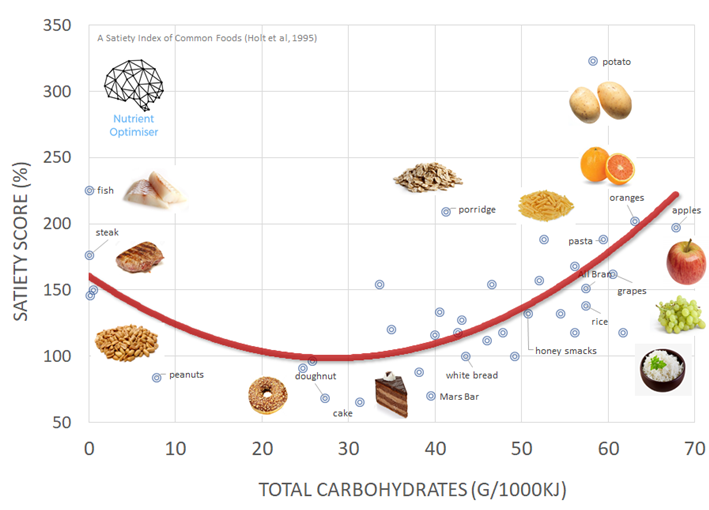
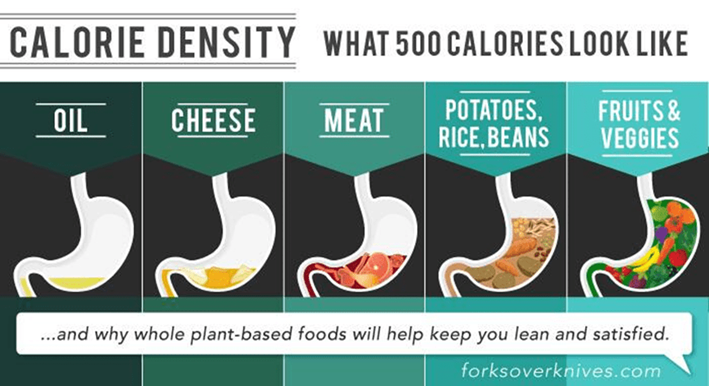
Our original research into which foods are satiating started with the 1995 paper A Satiety Index of Common Foods.

Researchers at the University of Sydney fed participants 1000 kilojoules (239 calories) each of 38 foods. They then measured their perceived hunger every fifteen minutes for three hours, and they quantified the amount of food they ate at a buffet three hours later to determine how full they stayed.
The results from this study are shown in the Satiety Index chart below. White bread was given a score of 100%. Foods with a score higher than 100% are more satiating than white bread per calorie, and vice versa.
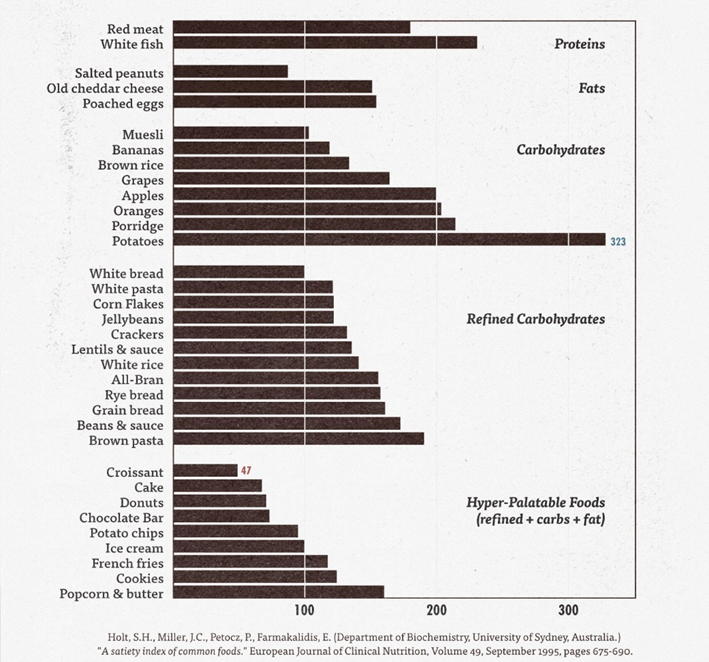
Are Potatoes the Most Satiating Food?
The cooked and cooled plain potato, full of resistant starch, with no salt or added fat, achieved the highest satiety score.
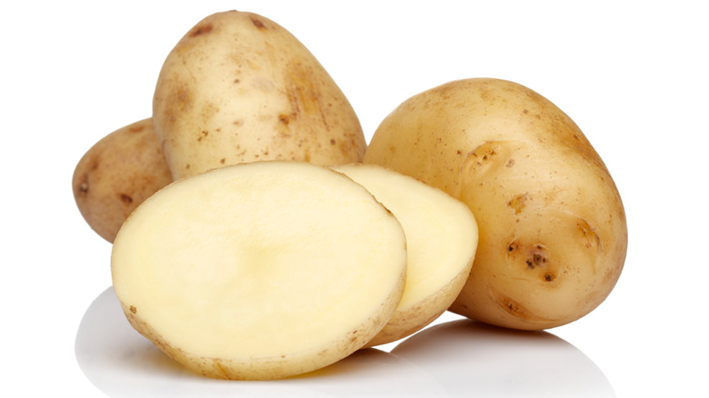
Many people have successfully lost weight on the potato hack diet because they are bland and have a low energy density. You would probably lose interest in eating if all you had to eat was potatoes. However, you may also lose more muscle with a diet that offers only 8% protein.
In an associated paper, using the Satiety Index Study data, Susanna Holt and her team also noted that high-carb foods that raise insulin and blood glucose quickly have a more significant short-term impact on satiety.
However, given that the researchers were studying feelings of fullness during the course of three hours, their study would have been more appropriately titled A Satiation Index of Common Foods rather than a satiety index, which is a longer-term phenomenon.
High-starch foods that raise blood glucose and insulin quickly often lead to short-term satiation but not long-term satiety.
Your appetite quickly shuts down until you have cleared the extra glucose from your blood. But once your blood glucose comes crashing down, you’re likely to be ravenously hungry, eat again sooner, and make poorer food choices at your next meal.

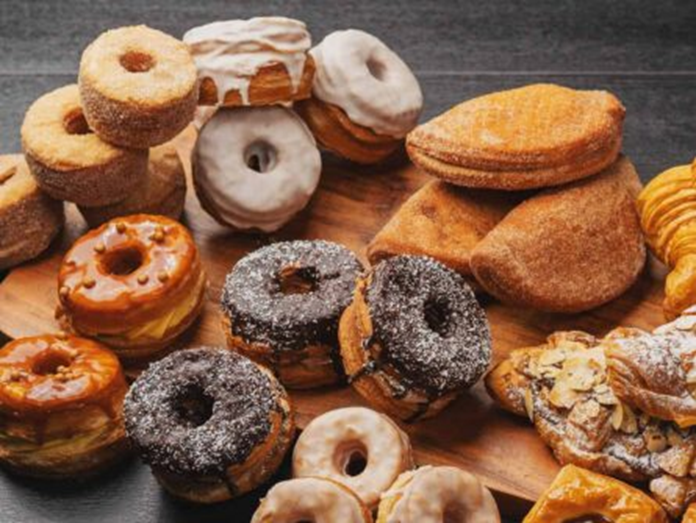
What Foods Are the Least Satiating?
Unsurprisingly, croissants, cakes, and doughnuts achieved the lowest satiety index scores in the study. We all know how easy these foods are to overeat!
Satiety Index of Foods List
The complete list of foods tested by the researchers, along with their satiety index score, is shown in the table below.
| Food | Satiety Index Score (%) |
| croissant | 47 |
| cake | 65 |
| doughnut | 68 |
| Mars bar | 70 |
| peanuts | 84 |
| yoghurt | 88 |
| chips | 91 |
| ice cream | 96 |
| white bread | 100 |
| muesli | 100 |
| Kellog’s Sustain | 112 |
| French fries | 116 |
| banana | 118 |
| jellybeans | 118 |
| cornflakes | 118 |
| Special K | 118 |
| cookies | 120 |
| crackers | 127 |
| brown rice | 132 |
| Honey Smacks | 132 |
| lentils | 133 |
| white rice | 138 |
| cheese | 146 |
| egg | 150 |
| All-Bran | 151 |
| popcorn | 154 |
| grainy bread | 154 |
| wholemeal bread | 157 |
| grapes | 162 |
| baked beans | 168 |
| beef steak | 176 |
| white pasta | 188 |
| brown pasta | 188 |
| apples | 197 |
| oranges | 202 |
| porridge | 209 |
| ling fish | 225 |
| potatoes | 323 |
Shortcomings of the Satiety Index of Foods
Unfortunately, in addition to only considering the response to foods over three hours, the 1995 Satiety Index Study contained only 38 data points and is therefore hard to make much sense of or apply to other foods.
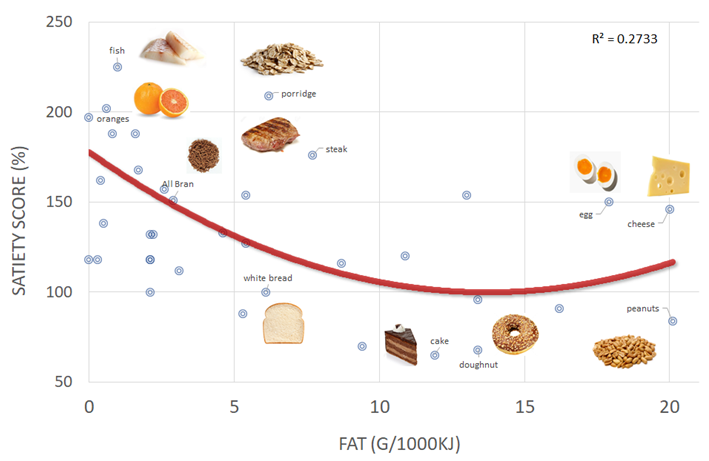
We started investigating why these foods were so satiating with our 2018 data analysis. We also saw similar trends when we analysed half a million days of MyFitnessPal data. Both analyses showed that foods with a higher protein % and more fibre tended to be more satiating.

Meanwhile, foods that combined energy from fat and carbs tended to be the easiest to overeat.
Given how crucial satiety is to nutrition and weight loss, it’s surprising that no further studies have been done on this topic in the past twenty-five years. However, while Kellogg’s funded the original research, it’s probably no shock that food companies don’t want to compare their products to the most satiating whole foods listed above!
Macronutrients and Satiety
As the database from our Optimisers has grown, we have gained a more precise understanding of the numerous factors in food that influence how much we eat.
As of August 2022, we’ve had 2,899 Optimisers participate in our Macros Masterclass and Micros Masterclass, and many others complete the 7-Day Nutrient Clarity Challenge. From this, we have an average of eighteen days of data from each of nearly thirty-five thousand people worldwide who eat vastly variable diets.
To help you understand the relationship between macronutrients and satiety, the chart below shows how a lower calorie intake aligns with less energy from fat and non-fibre carbohydrates and a higher protein % and more fibre.
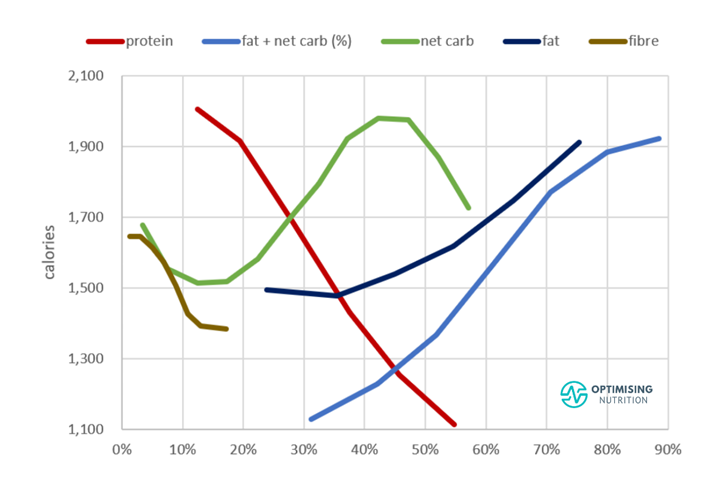
This observation aligns with the protein leverage hypothesis: we continue to eat until we get enough protein. You can watch my interview with Professors David Raubenheimer and Stephen Simpson, who pioneered this work, here.

The macronutrient profile of your food undoubtedly has the most significant impact on how much you’ll eat. However, as you’ll see, it doesn’t stop there!
One of the unique things about our data from Optimisers is that it is based on daily recorded calorie intake rather than a subjective feeling of fullness described three hours after a single meal. This allows us to understand true satiety across the entire day instead of just short-term satiation.
Additionally, because most people don’t change the type of food they eat, our data also provide a deeper understanding of the eating patterns that align with eating less or more than we need to.
Micronutrients and Satiety
As we dug deeper into the data, we found that, in addition to protein, many essential micronutrients also play a role in satiating our cravings with less energy.
As well as amino acids, it appears that we crave a certain amount of all the essential vitamins, minerals, and fatty acids in something we like to term the nutrient leverage effect.
Not only do we eat more until we get the protein we require, but we also keep eating until we get enough of the essential nutrients, regardless of whether we’ve consumed more energy than we need.
While the research in this area is sparse, the recent study by Jeffrey Brunstrom and Mark Schatzker, Micronutrients and food choice: A case of ‘nutritional wisdom’ in humans? also showed that humans prefer foods that contain more of the nutrients we require. You can watch my interview with Mark here.

Which Nutrients Align with Eating Less?
The table below lists the satiety response to various nutrients. The ‘satiety benefit’ refers to the difference in calorie consumption we see when we move from low to high intakes of each of these nutrients.
| Nutrient | Satiety Benefit |
| protein (%) | 55% |
| potassium (g/cal) | 49% |
| cholesterol (%) | 33% |
| folate (mg/cal) | 33% |
| calcium (g/cal) | 33% |
| niacin (B3) (g/cal) | 32% |
| vitamin B5 (g/cal) | 28% |
| riboflavin (B2) (g/cal) | 28% |
| iron (g/cal) | 28% |
| selenium (g/cal) | 26% |
| sodium (g/cal) | 24% |
| vitamin A (g/cal) | 23% |
| magnesium (g/cal) | 22% |
| fibre:carb ratio | 21% |
| vitamin B6 (g/cal) | 20% |
| energy density | 20% |
| vitamin K1 (g/cal) | 19% |
| thiamine B1 (g/cal) | 17% |
| vitamin E (g/cal) | 17% |
| fibre | 16% |
| manganese | 15% |
| vitamin C (g/cal) | 14% |
| zinc (g/cal) | 13% |
| omega 3 (g/cal) | 11% |
| vitamin B12 (g/cal) | 9% |
| copper (g/cal) | 8% |
Which Nutrients Have a Statistically Significant Impact on Satiety?
As you can see, many nutrients influence whether we eat less or more. However, each nutrient’s satiety effect is not independent! These nutrients are often found in foods alongside one another.
If you summed the right-hand column in this table, you would get a nonsensical 614% reduction in energy. Therefore, identifying the nutrients that have a statistically significant effect once all other nutrients are considered together is critical.
To understand which micronutrients have the most statistically significant effect on how much we eat, we ran a multivariate regression analysis to identify the parameters that align with eating fewer calories.
We’ve listed the results in the table below, which narrowed it down to the six significant parameters:
- protein %,
- potassium,
- sodium,
- vitamin B2 (riboflavin),
- fibre:carb ratio, and
- calcium.
| Nutrient | Units | 15th | 85th | Calories | % |
| protein | % | 19% | 41% | -419 | -25.7% |
| potassium | mg/2000 cal | 2182 | 5170 | -115 | -7.1% |
| sodium | mg/2000 cal | 1473 | 4557 | -53 | -3.2% |
| vitamin B2 | mg/2000 cal | 1.5 | 4.1 | -34 | -2.1% |
| fibre:carb | N/A | 0.13 | 0.42 | -29 | -1.8% |
| calcium | mg/2000 cal | 494 | 1649 | -29 | -1.8% |
It’s worth noting that:
- All p-values in the multivariate analysis were extremely low (i.e. p < 0.0000000005), showing that the relationship between calorie intake and these micronutrients is not due to chance.
- The calories column shows the (average) reduction in total calories that results from moving from what we consider low (15th percentile) to high amounts (85th percentile) of each nutrient.
- The % column shows the potential calorie reduction that aligns with moving from low to high intakes of that nutrient.
A 25.7% reduction in calories is attributable to protein (i.e., all the essential amino acids together). However, an extra 15.9% satiety benefit is cumulatively attributable to potassium, sodium, vitamin B2, calcium, and the fibre:carb ratio.
This data analysis shows that other micronutrients that often accompany protein work synergistically to satisfy our cravings for fewer calories.
What About the Other Nutrients?
The multivariate analysis identifies the handful of micronutrients with the most statistically significant impact on satiety and weeds out the rest.
However, that doesn’t mean the others aren’t also important! It’s just that in this population, these 34,519 people crave this handful of nutrients the most.
The lack of statistical significance of the other nutrients may be because these people may already be getting enough of those other nutrients. Additionally, the data for some nutrients can be ‘noisy’ because of people’s use of supplements and fortified foods. Hence, some of the micronutrients found readily in supplements or fortified foods have a lower degree of statistical significance.
To identify the micronutrients you need to prioritise and the foods and meals that contain them, you can take our free 7-Day Nutrient Clarity Challenge.
Can You Get Too Much of a Good Thing?
As with many things in nutrition, more is not necessarily better.
There is an upper limit to how much benefit each nutrient provides. Our cravings drive us to keep eating until we get enough of our current highest-priority nutrients before searching for other critical nutrients we need more of.
Using our analysis, we developed our Optimal Nutrient Intakes (ONIs) to determine the quantity of each nutrient from whole foods (i.e., without supplements) that optimises our satiety.
The table below shows that the ONIs are often significantly more than the minimum Estimated Average Requirements (EARs) and Adequate Intakes (AIs). This makes sense, given that the AIs and the EARs were initially set to create rations that would help WWII soldiers evade disease!
| Nutrient | ONI | DRI or AI | Units |
| calcium | 1650 | 1000 | mg |
| iron | 30 | 18 | mg |
| magnesium | 825 | 320 | mg |
| phosphorus | 1250 | 700 | mg |
| potassium | 6000 | 2600 | mg |
| sodium | 4000 | 1500 | mg |
| zinc | 25 | 8.0 | mg |
| copper | 3 | 0.9 | mg |
| manganese | 5.5 | 1.8 | mg |
| selenium | 300 | 55 | mcg |
| vitamin A | 10000 | 2333 | IU |
| vitamin E | 25 | 15 | mg |
| vitamin D | 1200 | 600 | IU |
| vitamin C | 350 | 75 | mg |
| thiamine (B1) | 3 | 1.1 | mg |
| riboflavin (B2) | 6 | 1.1 | mg |
| niacin (B3) | 60 | 14 | mg |
| Pantothenic acid (B5) | 12 | 5 | mg |
| vitamin (B6) | 5 | 1.3 | mg |
| vitamin (B12) | 12 | 2.4 | mcg |
| vitamin K1 | 1100 | 90 | mcg |
| folate | 1000 | 400 | mcg |
| tryptophan | 2.2 | – | g |
| threonine | 8.1 | – | g |
| isoleucine | 8.8 | – | g |
| leucine | 15.2 | – | g |
| lysine | 15.2 | – | g |
| methionine | 4.8 | – | g |
| cysteine | 2.4 | 0.9 | g |
| phenylalanine | 7.9 | 1.6 | g |
| tyrosine | 6.6 | 1.6 | g |
| valine | 9.8 | 2.3 | g |
| histidine | 5.4 | 1.4 | g |
| omega 3 | 6 | 1.1 | g |
The EAR and AI are the minimum intakes of nutrients observed to prevent diseases of deficiency in most of the population most of the time. The DRIs were developed using the EARs and represent the intake of nutrients that is adequate for 97.5% of the population. In other words, these are not the intakes of nutrients associated with optimal health and satiety!
Our ONIs are a critical component in our new satiety index; we have used them to ensure that too much weight wasn’t given to one nutrient.
Similar to our Diet Quality Score, our ONIs ensure that no further benefit is counted after you reach the Optimal Nutrient Intake for that nutrient.
The Satiety Response to Key Nutrients
To help you understand the inner workings of our satiety index, we’ve provided the relevant satiety charts for each nutrient included in the satiety index ranking.
Protein
The chart below shows the average satiety response to protein %. We tend to eat fewer calories overall when we consume foods with a greater protein % and moving from very low to very high protein % aligns with a substantial 55% reduction in calorie intake! It is tough to overeat foods with less energy from fat and carbs when we focus on getting the protein we require.

When we run the regression analysis of just protein, we see a 32% reduction in total calories as we move from low (19%) to high protein (41%). However, we see a smaller 25.7% satiety response when we account for the satiety effect of other nutrients.
While many are tempted to jump to extremes, we find that 40% of total calories from protein is a healthy stretch target to work towards. In our four-week Macros Masterclass, our Optimisers do just this by dialling up their protein and fibre while dialling back on fat and carbs. This allows them to lose fat sustainably without the rebound bingeing that often accompanies diving headfirst into a diet. For more detail on the perils of swinging from low to high protein intakes overnight, see Secrets of the Nutrient-Dense Protein Sparing Modified Fast.
Protein tends to be a contentious macronutrient, and many people are confused over whether they should aim for high vs low protein. But in reality, most people are already close to the right amount of protein. They’re likely just overconsuming energy from fat and carbohydrates in pursuit of the protein they require. To learn how to find the right protein intake for you, see Protein – Optimal vs Acceptable Macronutrient Distribution Range (AMDR).
Potassium
Similar to protein, we see a substantial satiety response to foods containing more potassium.
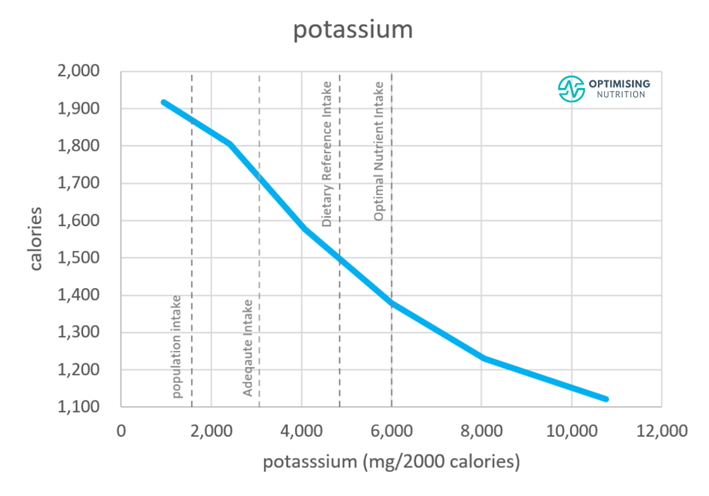
Once we account for the impact of the other nutrients, we see a 7.1% reduction in calories when we move from low to high potassium! This is not surprising, as potassium has been deemed a nutrient of concern, and most people are known not to get enough. It makes sense that we would have strong cravings for this important mineral!
Sodium
Sodium is another mineral we crave intensely. This is why it’s added to junk food — so we eat and buy more and more of it! But many people don’t get enough sodium once they clean up their diet and reduce processed foods.
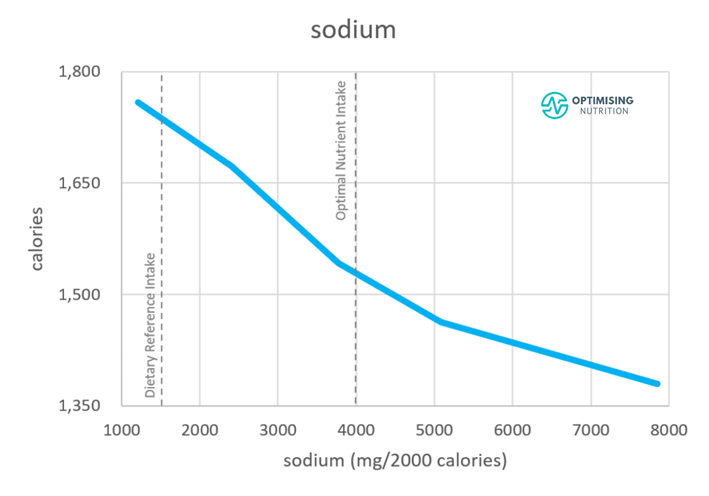
Once we account for other nutrients, moving from low to high sodium aligns with a 3.2% reduction in calories.
Calcium
We also see a strong satiety response to calcium in our food.
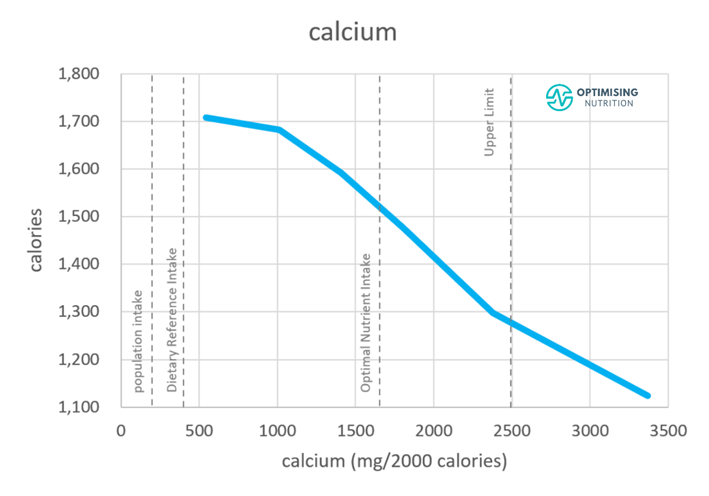
While the benefits of calcium seem boundless, we set our ONI target at 1650 mg/2000 calories because it’s hard to get more from food while also obtaining the other nutrients.
Once we consider other nutrients, we see a 1.8% reduction in calories in the multivariate regression analysis.
Riboflavin (Vitamin B2)
Vitamin B2, or riboflavin, also elicits a similarly substantial satiety response. Interestingly, any benefit from vitamins quickly falls off once we exceed higher levels that can only be achieved through supplementation or fortification.
It’s important to remember that the satiety benefit we see comes from foods containing these nutrients; you do not get the same effect from taking a multivitamin as ‘insurance’ and continuing to eat ‘fortified’ junk!
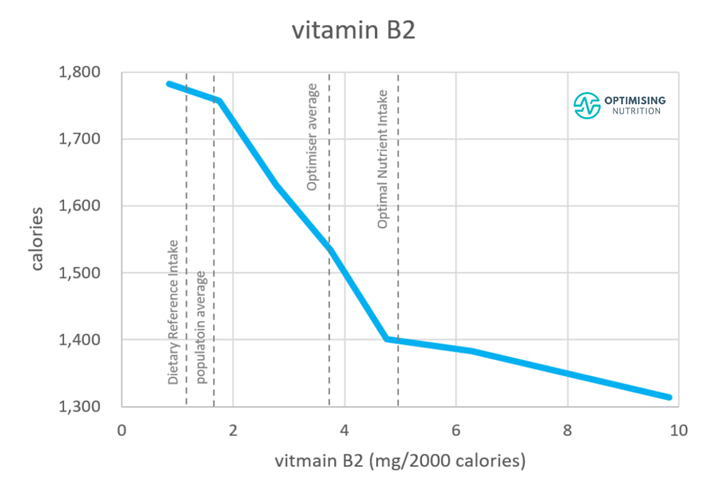
We set our Optimal Nutrient Intake (ONI) for riboflavin at 5 mg/2000 calories which is where we see the satiety benefit taper off.
Once we account for the impact of the other nutrients, vitamin B2 provides a 2.1% reduction in calories when we move from low to high.
Fibre:Carb Ratio
While foods with more fibre tend to be harder to overeat, we see the greatest statistically significant response to a higher fibre:carbohydrate ratio. In other words, simply eating more fibre on its own, or even fibre supplements, does not guarantee satiety. Instead, eating a high proportion of fibre in relation to carbs optimises how full we feel over the long term.
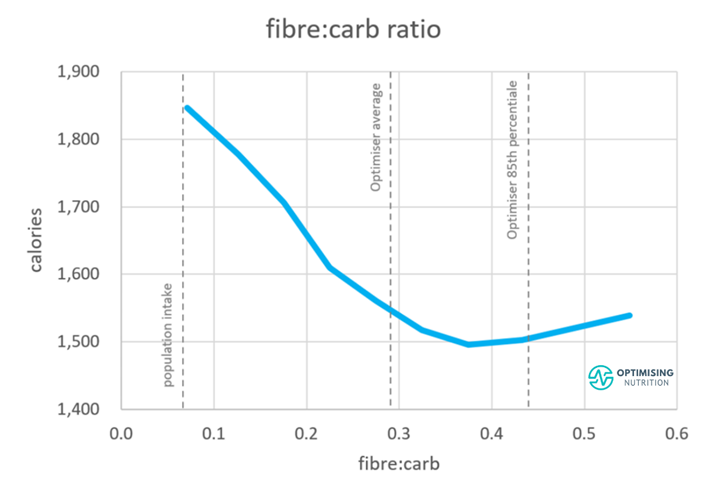
When up to about 40% of our carbohydrates are fibrous, we tend to eat less overall. The left side of this chart represents most people who eat more refined carbohydrates with less fibre that are easier to overeat. Moving from a low to a high fibre:carb ratio aligns with an additional 1.8% reduction in total calories once other nutrients are also considered.
Will Low-Energy-Density Foods Help Me Eat Less?
Before we wrap up, let’s touch on energy density.
Many believe that high-volume foods with a low energy density are more satiating.
Professor Barbara Rolls’s Ultimate Volumetrics Diet is based on this concept.
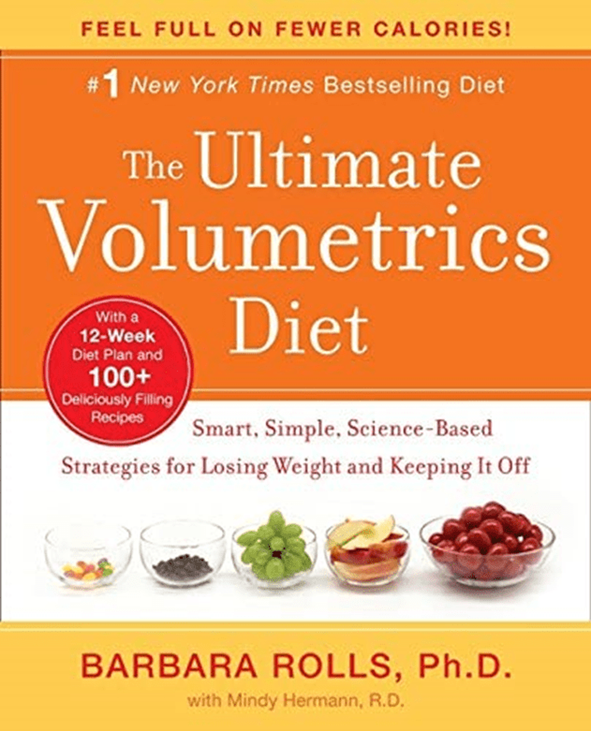
Foods with higher energy densities tend to be harder to overeat, but only to a point. On the other side of the extreme, a big bottle of water or a few heads of lettuce won’t keep you full for long.
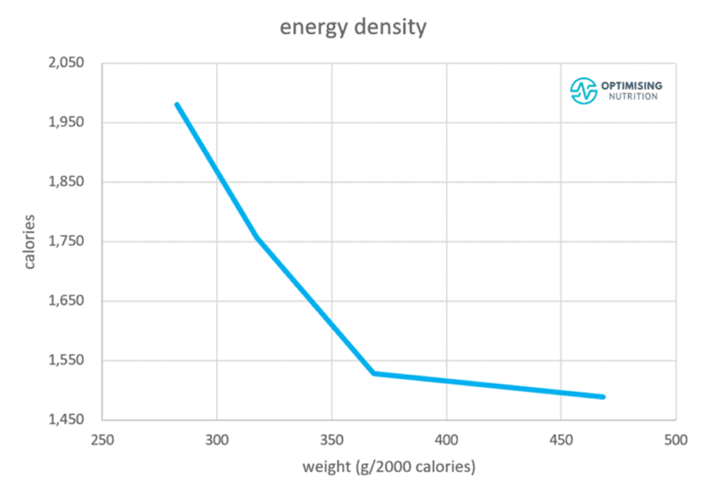
When we consider protein, the fibre:carb ratio, and the statistically significant nutrients, we do end up with a relatively less energy-dense diet, but without going to ridiculous extremes.
Our multivariate regression analysis found that energy density did not align with a lower energy intake once the other factors were considered. Worrying about energy density will worsen your satiety if you already have the other parameters in place.
For more details, see Low Energy Density Foods and Recipes: Will They Help You Feel Full with Fewer Calories?
Next Steps
We hope this article has helped you understand how various nutrients in food promote satiety and satisfy your cravings with fewer calories.
To help you start your journey towards Nutritional Optimisation, we’ve assembled a range of food lists tailored to different goals and preferences and optimised for nutrient density, which you can access in our Optimising Nutrition Community here.
We’ve also assembled more than 1000 nutrient-dense recipes that you can access here.

Satiety Series
- The Satiety Index
- How to Maximise Satiety Per Calorie (Across the Whole Day, Every Day)
- Satiety: How to Lose Weight with Less Hunger
- Highest Satiety Index Meals and Recipes
- How Much Protein Should I Eat to Lose Weight?
- Vitamins for Weight Loss and Satiety: Which Ones and How Much Do You Need?
- The Impact of Electrolyte Minerals on Appetite, Hunger and Satiety
- Does Eating Fat Make You Fat? The Surprising Truth About Cholesterol and Saturated Fat!
- Optimal Amino Acid Intakes for Weight Loss, Satiety and Health
- Optimal Nutrient Intakes (ONIs) for Satiety and Health
- The Diet Quality Score: Your Ultimate Measure of a Balanced Diet
interesting, I have been tailoring my diet these past 3 plus months to higher satiey foods and carbs with protein and fiber (like beans) salads sometimes I get tired of eating salads sometimes, but I have found other ways to use veggies, so when I want cereal I make sure the caloires are modest adn fiber is high and it still has a little sweetness frm say raisins for example, and eat only one serving. I use lower carbs fruits when I can such as blueberries and strawberries eat a half of banana with a meal when i want it, which latly has not be often. your really did alot of work onthis post. I hope alot of people see it and consider it in their food choices to fight obesity and all the other healht problems caused by malnorishment
cheers. glad you found it useful.
A food I haven’t seen on any of the satiety lists is sourdough bread. I make whole-wheat sourdough and it keeps me amazingly full & satisfied for hours. Much longer than regular whole-wheat bread would. I usually eat it with a lean protein, but often just by itself.
Sourdough bread will definitely be more satiating per calorie than more refined bread options. However, not as satiating as non-starchy vege, meat and seafood which are more nutritious and have a higher protein %.
As an Australian I have noticed very different attitudes here towards good nutrition compared to the USA. We have a government research body CSIRO that promotes a evidence-based higher protein, high vegetable, moderate fat diet, and hitting most of your recommendations. Around half the households in Australia have one of their books at home. We also have substantial research coming from USydney and other universities that encourages evidence-based recommendations – for glycaemic load, protein, etc. These are taken up in women’s magazines and TV (along with crazy diets too, unfortunately!) Plus we don’t have the powerful anti-meat lobbyists seen in the USA, so our mental pictures of what is ‘normal’ are different. Fortunately our longevity rates are up there with Italy and Japan (etc) – higher than the USA.