
The official Acceptable Macronutrient Distribution Ranges (AMDRs) were determined by the Food and Nutrition Board of the Institute of Medicine in 2005.
The AMDR for fat was set at 20% to 35% of total calories for ‘the planning and assessment of the diets of healthy people.
However, disagreement and discussion over these recommendations have increased in recent years.
More people have started questioning whether these targets are suitable for the growing number of people who aren’t metabolically healthy.
Many popular dietary interventions have been used successfully for weight loss and diabetes management, with fat intakes much greater than the AMDR.
From Atkins in the 1970s to the more recent keto and carnivore diets, more fat and fewer carbs have brought many people the blood glucose stability, satiety, and weight loss that had evaded them for so long following the official mainstream guidelines.
Many have swung to the opposite extreme, believing they can ‘eat fat to satiety‘ while all avoiding carbohydrates to achieve weight loss and optimise their metabolic health.
In this article, we will review the AMDR for fat vs the optimal fat intakes that align with greater satiety and nutrient density.
This information will empower you to cut through the noise and confusion to identify the ideal fat intake for your goals, context, and preferences.
- What Are the AMDRs?
- What Is an ‘Acceptable Macronutrient Distribution Range’ (AMDR)?
- How Was the AMDR For Fat Determined?
- More Recent Research
- What Is the Optimal Fat Intake?
- The Interaction of Fat, Carbs, and Protein
- What Is a Typical Fat Intake?
- What Is the Minimum Fat Intake?
- How Has Our Intake of Fat Changed Over Time?
- Nutrient Density
- What About the Different Types of Fat?
- Is Fat Better or Worse Than Carbohydrates?
- Where Should You Start?
- Ideal Fat Intake for Different Goals
- So How Many Grams of Fat Should I Consume?
- Summary
- AMDR series
- More
What Are the AMDRs?
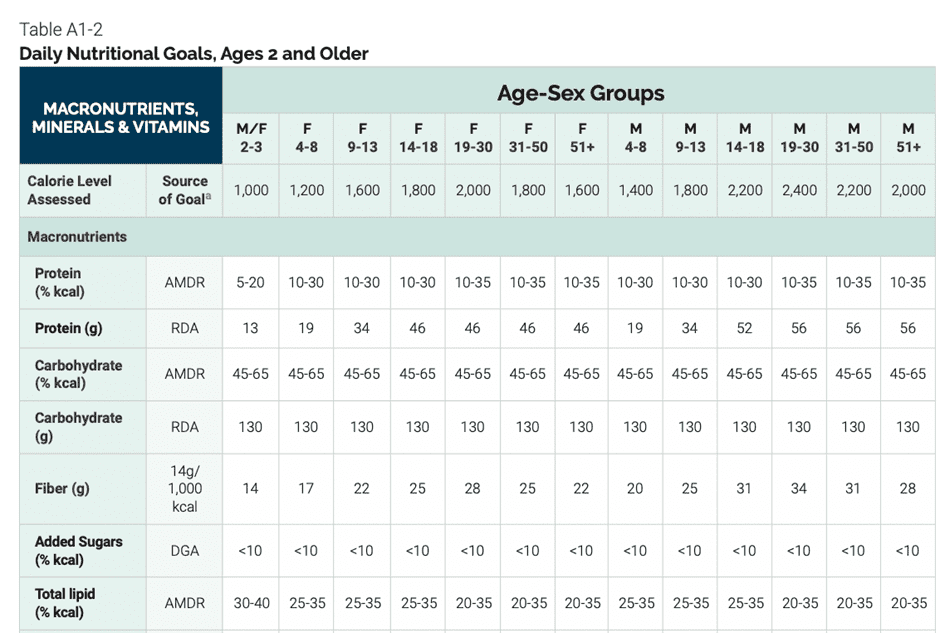
The chart below shows the recommended protein, fat, and carbohydrate intakes from the 2020-2025 Dietary Guidelines for Americans based on age for men and women. On the bottom row, you can see the recommended range of 20–35% of total calories from fat (lipids).
What Is an ‘Acceptable Macronutrient Distribution Range’ (AMDR)?
According to the Food and Nutrition Board: Institute of Medicine (FNB:IOM), an Acceptable Macronutrient Range, or ‘AMDR’ for short, is defined as ‘an intake range for a particular energy source that is associated with reduced risk of chronic diseases while providing adequate intakes of essential nutrients.’ The AMDRs have been set for the planning and assessment of diets of healthy people.
However, it’s worth noting that a recent study from Tufts University found that only 7% of the US adult population is metabolically healthy. Sadly, an ever-increasing number of people have diabetes, obesity, and other conditions related to metabolic syndrome.
From diabetes to cancer, many of our modern diseases stem from poor metabolic health and obesity. Hence, our discussion of the AMDR for fat must consider satiety and blood glucose control.
Keeping the goal of nutrient adequacy at the centre, we will also use our nutrient density analysis to see if their recommended AMDRs support it and identify what fat intake aligns with the greatest nutrient density.
How Was the AMDR For Fat Determined?
The FNB:IOM developed the AMDR for fat around their understanding that higher intakes were associated with a greater risk for chronic diseases. However, aside from hypertension, these chronic diseases were not detailed, nor were any studies undertaken to back up these assumptions. Before publication, these AMDRs were not studied as direct interventions.
The Food and Nutrition Board believed that consuming adequate intakes of essential nutrients and reducing ‘toxic’ saturated fats and cholesterol would minimise the risks for obesity, cardiovascular disease, diabetes, and other diseases related to metabolic syndrome.
The reality is that we require some fats to absorb fat-soluble nutrients like vitamins A, D, E, and K. Omega-6 and omega-3 fatty acids are also essential for life, and we need a small amount of them to make cell membranes, synthesise bile acids, and keep specific organs functioning. Thus, the lowest fat intake (20% of total calories) was set to avoid nutrient deficiencies related to very low-fat diets.
More Recent Research
The IOM published the latest updates to the AMDRs in 2005. At the time, studies showed correlations between higher fat intakes and higher blood fats. Hence, the maximum fat intake (35% of total calories) was arbitrarily set on this basis.
However, more recent research has shown that the association between dietary cholesterol and blood cholesterol is not what it was thought to be. In fact, the 300 mg/day dietary cholesterol limitation was removed from the US Dietary Guidelines for Americans in 2015. Even more recent studies have shown that very low cholesterol is associated with all-cause mortality.
Moreover, while diet culture has had us fearing saturated fat and cholesterol for almost half a century, more recent findings have shown that dietary saturated fats do not have the negative implications on health we once believed. However, it seems the 2005 IOM AMDRs have not caught up to our modern science!
Saturated fats were demonised after Ancel Keys pointed out an association between a substantial amount of saturated fats consumed from butter, eggs, red meat, and tallow — which humans had been eating for thousands of years — and heart disease. However, he failed to note the high stress levels that followed WWII, the increase in toxin exposure, reliance on cigarettes and alcohol, and the increased use of seed oils and refined flours around this time.
Despite saturated fats being an ‘obvious’ culprit, many Europeans, like the French, Spanish, and Danish, continued to consume high amounts of saturated fats. They experienced the lowest incidences of heart disease and myocardial infarction despite consuming a diet heavy in butter, cheese, and saturated fat. However, these observations were dismissed as ‘paradoxes’ when developing the 2010 edition of Dietary Guidelines for Americans.
Because evidence used to set the AMDRs was based on correlation with clinical endpoints (e.g., coronary heart disease, diabetes, cancer, obesity), and no specific causation was shown with higher fat intakes. In summary, because factors other than diet can contribute to chronic disease, it is impossible to determine a defined level of intake that may prevent or cause chronic disease.
What Is the Optimal Fat Intake?
The optimal fat intake in this article is based on our analysis of 125,761 days of food logs collected from 34,519 Nutrient Optimiser users over the past four years.
This analysis includes Optimisers participating in our Macros Masterclass and Micros Masterclass and the hundreds of people who have used Nutrient Optimiser to analyse their diet’s nutrient profile for just a few days.
On average, we have eighteen days of data per person, representing various macronutrient intakes and diet styles worldwide.
As you will see, while a lower-fat diet may be optimal for aggressive fat loss and maximal nutrient density, it is not necessarily ideal for everyone, particularly if you prefer a diet with fewer carbohydrates or more protein.
Satiety
The following chart shows the relationship between fat % vs calorie intake (satiety). As we can see, people consuming less than 40% of their calories from fat tend to eat the least.
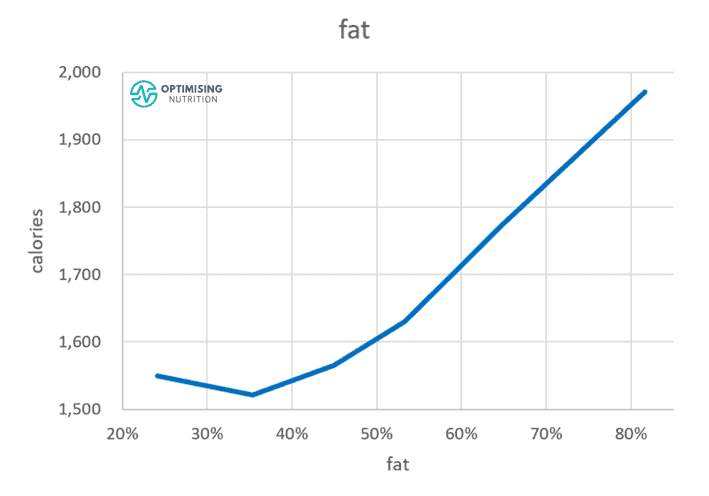
While lower fat aligns with a lower calorie intake, minimising fat is not necessarily better. While reducing your fat from above 80% to around 40% aligns with a significant calorie reduction, reducing your fat intake beyond this does not align with significantly greater satiety.
Diet Quality
The following chart shows fat % vs diet quality. Like the satiety response to fat percentage, people consuming less fat — but not too little — tend to have a higher nutrient density. However, again, there seems to be little benefit in reducing fat to below 40%.
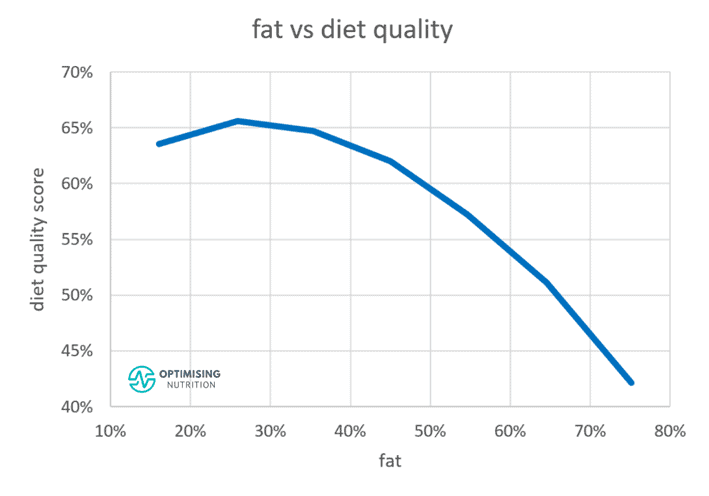
Increasing fat too much dramatically reduces the nutrient density of our diet. While we need to get adequate energy, pure fat contains a minimal amount of essential micronutrients, and it is the most calorically dense macronutrient we consume.
The Optimal and Ideal Fat Intake
To summarise, our analysis shows that the optimal fat intake for satiety and nutrient density is between 20% and 40%, which is similar to the AMDR for fat. However, it’s important to note that optimal is not necessarily ideal for everyone all the time, especially if they are not looking to lose weight in a hurry.
You need energy from somewhere to prevent starvation. The 20–40% optimal range should be seen as a stretch target that people can move towards for greater satiety or nutrient density.
In our Macros Masterclass, we guide people to identify their current macro intake and progressively dial in their macros to move towards a ratio that aligns with their goals. This allows them to make progress without jumping to unsustainable extremes.
If you’re interested in digging a little deeper, the following sections review the fat AMDR further.
The Interaction of Fat, Carbs, and Protein
It’s important to note that fat, carbs, and protein in our food are not independent variables. We can’t vary one macronutrient without affecting the others.
Our analysis has shown that your protein % — or the percentage of total calories from protein — has the most powerful effect on satiety.
As the chart below shows, increasing protein % aligns with a moderate increase in absolute protein intake (e.g., in grams) and a substantial reduction in total calories.
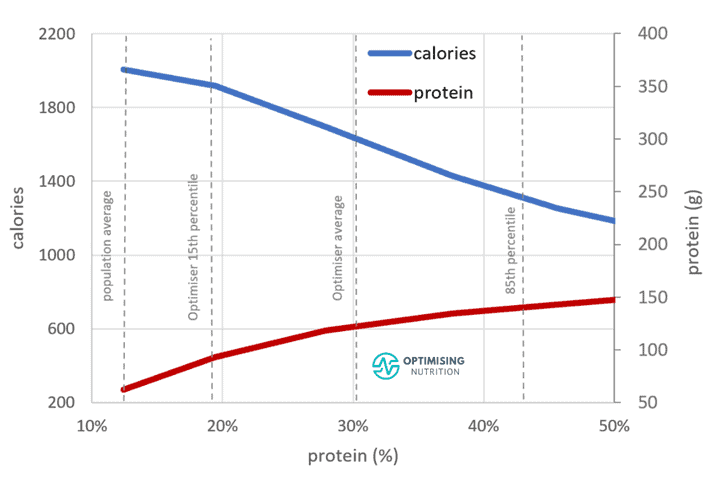
However, because protein often comes packaged with fat, it’s challenging to achieve a high protein % and very low fat intake at the same time.
What Is a Typical Fat Intake?
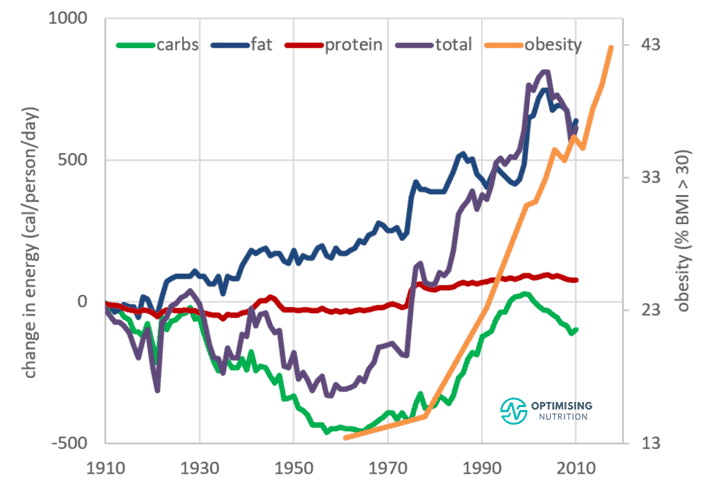
Using data from the USDA Economic Research Service, the chart below shows how our intake of fat and carbohydrates has changed over the past century.
- Fat has increased from around 30% to 42% since 1910.
- At the same time, we see that calories from carbs fell to about 47% of total calories.
- As low-protein, higher-fat-and-carb combo foods have increased, obesity has continued to climb.

The following frequency distribution chart shows the range of fat intake our Optimisers consume, averaging 46% amongst the population who are typically focussing on nutrient density and adequate protein. Interestingly, only 22% of the data falls below the AMDR upper limit for fat (35%).
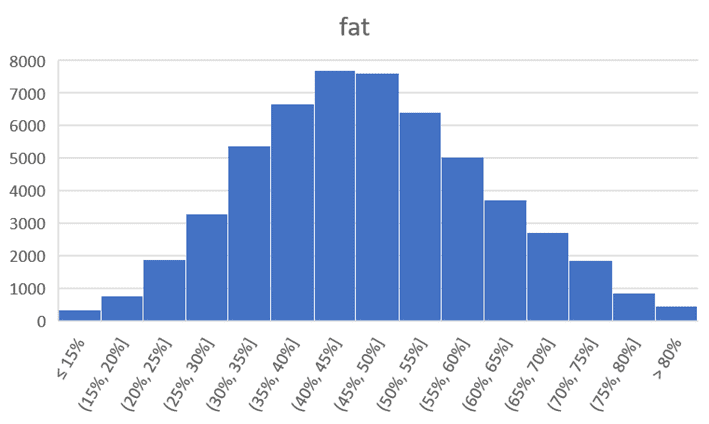
This data suggests that, while a lower fat % does allow us to lower our calorie intake, the 20–35% range appears to be unrealistically low for many. In addition, reducing fat below 35% also makes it challenging to obtain adequate protein, which is critical to promoting satiety.
What Is the Minimum Fat Intake?
We need some daily dietary fat.
- A low-fat diet can compromise our intake of essential fatty acids and fat-soluble nutrients like vitamins A, D, E, and K.
- Because fat elicits the release of bile acids, our gallbladder needs at least 10 g of fat per day to function healthily. Of the various fats, we also require a small amount of omega-3 and omega-6 fatty acids to execute bodily processes.
- Because high-protein foods come packaged with fat, intakes of other micronutrients typically packaged with protein, like zinc, iron, riboflavin, calcium, choline, and vitamin B12, may also suffer if we try to minimise fat.
How Has Our Intake of Fat Changed Over Time?
The chart below was created using data from the USDA Economic Research Service. Here, we can see how our fat intake has increased steadily over the past century. Compared to what the average person consumed 100 years ago, we’re eating approximately 750 extra calories per person per day, mainly from extra fat!

The following chart shows that calories from carbohydrate intake initially fell in the early part of the last century. However, it increased from the 1960s until around 2000. In contrast, our consumption of protein has increased only marginally.
But where’s the extra fat coming from?
According to USDA data, this increase mostly comes from monounsaturated and polyunsaturated fats, which comprise hydrogenated vegetable oils like palm, soybean, and sunflower oils — common ingredients in processed foods.
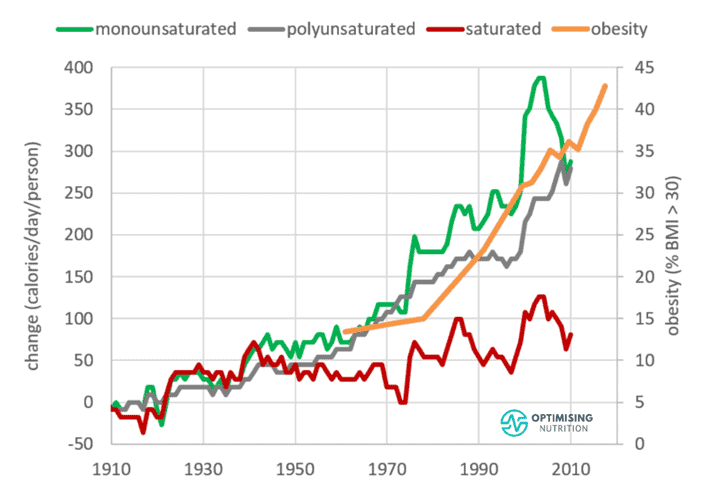
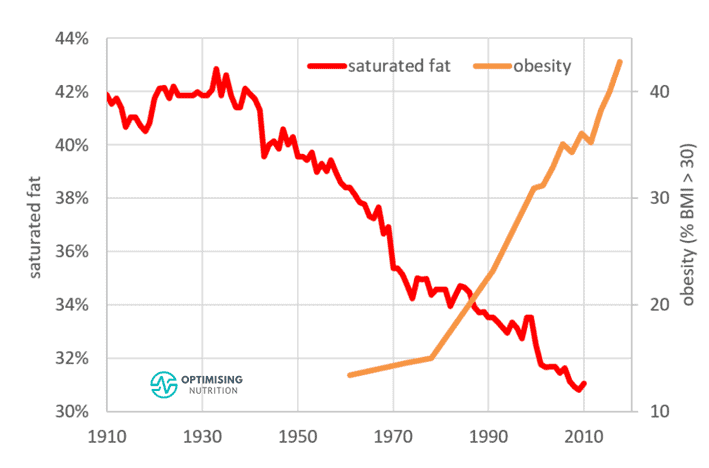
While saturated fat has increased in absolute terms, it has decreased significantly since the 1930s in percentage terms.
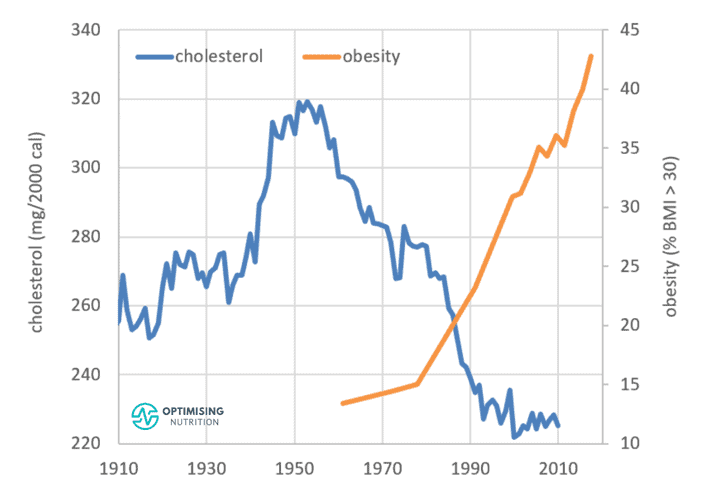
The dietary cholesterol trend may surprise you. Similar to saturated fats, it has also fallen since the 1950s.
Increased food processing and manufacturing have enabled us to combine refined starch, sugar, and vegetable oils in hyper-palatable food products in ways never possible before.
This increase in fat and carbs has allowed the average diet to consist of similar proportions of these palatable nutrients, making it hard not to overeat them.
In addition, combining fat and carbs elicits double the reward system in the brain, making you want to eat more, more, more!
Nutrient Density
As mentioned above, we tend to see nutrient density increase when we consume less fat. Fat is primarily an energy-dense fuel source that adds minimal essential nutrients.
But what happens to our micronutrients at extremes of high-fat and low-fat intakes?
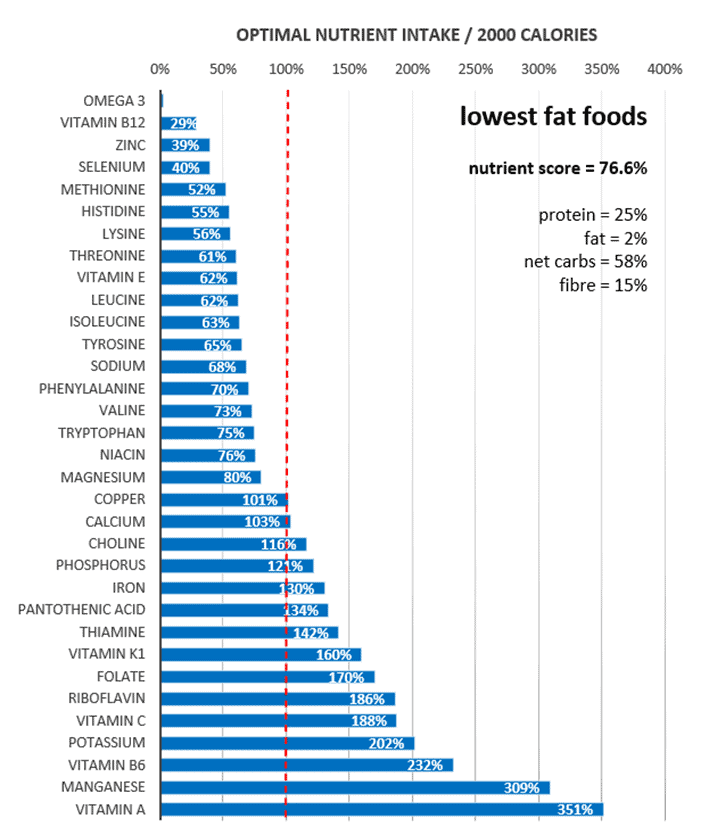
The micronutrient fingerprint chart below shows the nutrients in the lowest-fat foods. At the top of the chart, we can see that it’s challenging to get adequate omega-3, vitamin B12, zinc, and selenium when we minimise fat.
In comparison, the following fingerprint chart shows that the highest-fat foods have a much lower nutrient score. As you can see, it’s tough to get adequate vitamins like C, K1, B3 (niacin), B6 (pyridoxine), B2 (riboflavin), B9 (folate), and B12, as well as calcium, potassium, and zinc.
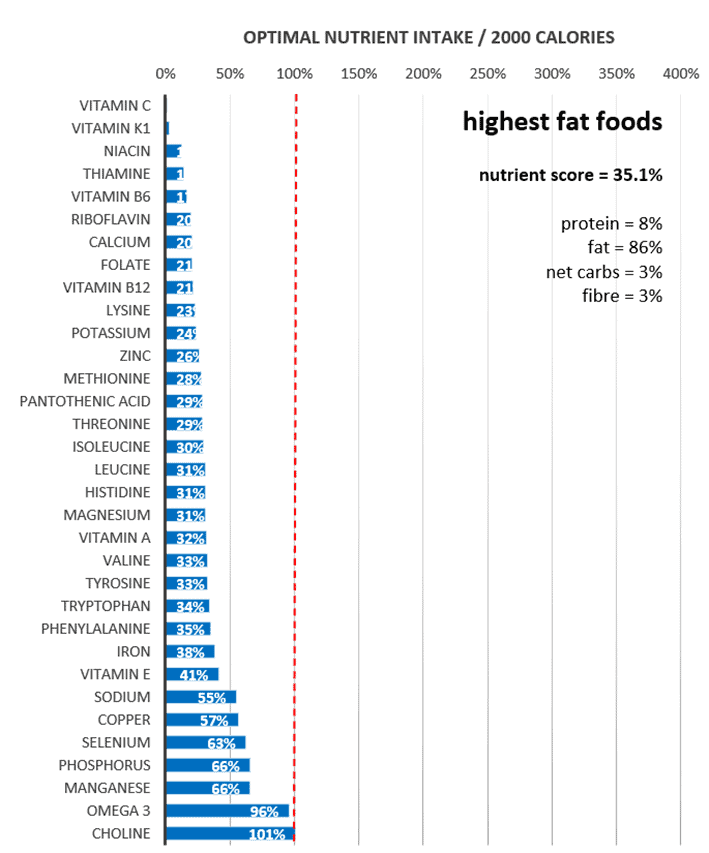
So it seems that defining your diet as ‘high fat’ or ‘low fat’ doesn’t help us achieve a nutritious diet.
But what happens if we stop worrying about macronutrients and focus on maximising nutrient density?
As the fingerprint chart below shows, the answer is that we get plenty of all of the micronutrients and a macro profile that is also lower in fat and non-fibre carbohydrates.

When we prioritise nutrient density, we not only get plenty of protein, but we also get plenty of all of the essential micronutrients. For some nutrient-dense inspiration, see:
- Nutrient-Dense Meals and Recipes
- The Most Nutrient-Dense Foods – Tailored to Your Goals and Preferences
What About the Different Types of Fat?
For the most part, fat is simply a source of slow-burning energy that is easy to store. Thus, fat is an excellent option to fuel a large quantity of low-intensity activity. But if you want to lose body fat, you may need to reduce the amount of dietary fat you consume.
Because of a principle known as oxidative priority, fat is the last in line to be used for fuel, after your blood glucose, glycogen from your liver, and the fatty acids in your blood. In other words, what you do not burn is likely stored on your bum, hips, thighs, and belly.
However, as you will see in the following sections, different types of fat, like omega-3 fatty acids, cholesterol, saturated fat, monounsaturated fat, and polyunsaturated fats, behave a bit differently.
Omega-3 Fatty Acids
Omega-3 fatty acids have been shown to have many promising effects on human health. But because most people do not consume much fatty fish, most of us are not getting enough omega-3s.
While many people associate omega-3 fatty acids with seed oils like canola, cottonseed, and rapeseed, these oils do not contain omega-3 in forms bioavailable to humans. Instead, they contain the precursor — alpha-linolenic acid — which can be converted into bioavailable forms of omega-3s like DHA and EPA. However, the rate at which they are converted is often inefficient. On another note, these seed oils are often oxidised during processing, ironically increasing our demand for omega-3s!
The following chart shows the association between omega-3s consumed and calories consumed.

As we can see, consuming more omega-3s per calorie aligns with a lower caloric intake overall. Based on this analysis, we have set a stretch target of 6 grams/2000 calories for omega-3 fatty acids.
For more info on omega-3s, see Omega-3 Foods and Recipes: A Practical Guide.
Cholesterol
Cholesterol is a controversial fat.
After the rise of heart disease and heart attacks in the 1950s and some questionable research led by Ancel Keys, it was once deemed a nutrient of concern. This prompted the US Dietary Guidelines to strictly limit this nutrient until it quietly removed this recommendation in 2015.
The chart below shows that foods with more cholesterol per calorie align with a lower overall calorie intake.
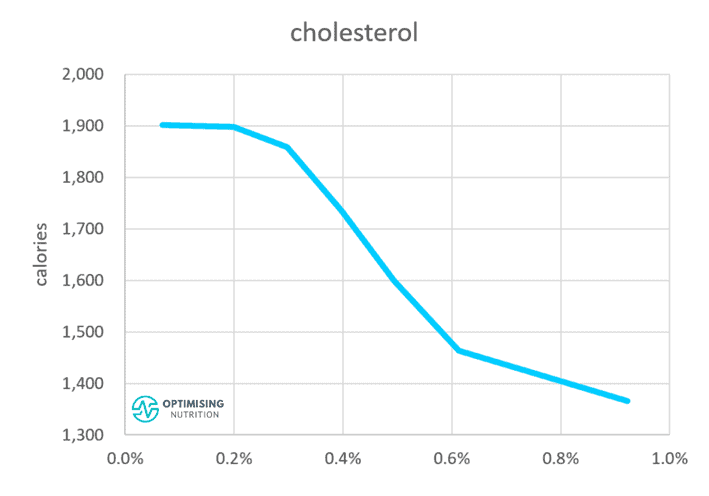
Cholesterol isn’t an essential nutrient; your body produces about 90% of its cholesterol demands whether you consume fat, protein, or carbs. Hence, we have not set a stretch target for cholesterol. However, our calorie intake tends to decrease when we consume more.
Per more recent science, there appears to be no need to avoid whole foods that are otherwise nutrient-dense due to concerns about cholesterol. Dietary cholesterol does not necessarily equate to blood cholesterol. Science has shown that cholesterol only becomes a problem when it oxidises, particularly when we have high levels of fat and glucose in our blood.
While you don’t need to go out of your way to consume more cholesterol, we believe there’s no need to avoid nutritious foods like eggs, liver and beef that contain cholesterol.
For more details, see:
- Cholesterol: When to Worry and What to Do About It, and
- Dietary Cholesterol and Blood Cholesterol: Are They Related?
Saturated Fat
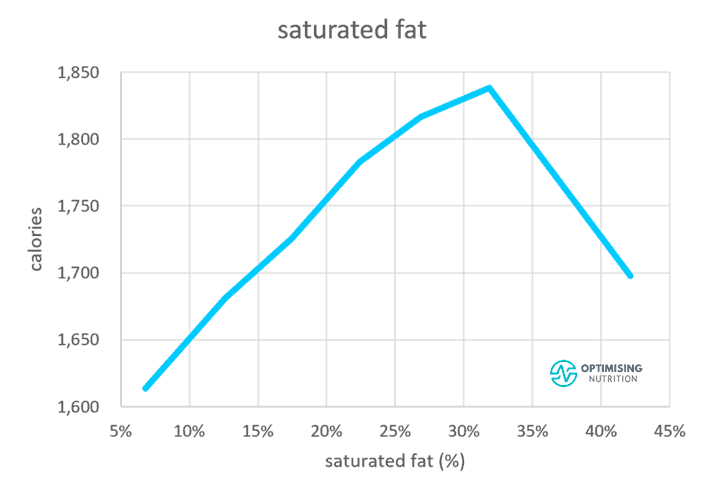
Saturated fat elicits an even more intriguing satiety response.
Up until about 30% of calories eaten, saturated fat tends to align with a higher calorie intake. After that, however, energy intake appears to decrease. This may be because mixed foods that contain this percentage of saturated fat — like a burger and chips — are easy to overeat. In contrast, foods with a higher percentage of energy from saturated fat that contain protein, like cheese and meat, are more satiating.
Another factor may be that saturated fat leads to insulin resistance quicker than unsaturated fat.
While this is typically considered ‘bad news’ for saturated fat, it’s helpful to remember that insulin resistance occurs when we exceed our Personal Fat Threshold due to a long-term intake of low satiety nutrient-poor foods that cause us to eat more and store more fat than our bodies can comfortably hold.
When your fat cells are relatively empty, your appetite will increase, and you will be driven to seek more food. However, once you approach your Personal Fat Threshold and become insulin resistant, your appetite will settle because you can’t store more energy efficiently.
We become insulin resistant more quickly from overconsuming foods high in saturated fat. Hence, satiety kicks in at a lower body fat level. Meanwhile, unsaturated fats will keep you eating and gaining more weight before you develop Type 2 diabetes.
This does not necessarily mean one option is better than another. Overconsuming more energy than you use from any source will result in weight gain.
You don’t want to overdo your fat intake to the point that you drive yourself to become diabetic, but saturated fat might slow you down before you become morbidly obese!
Monounsaturated and Polyunsaturated Fat
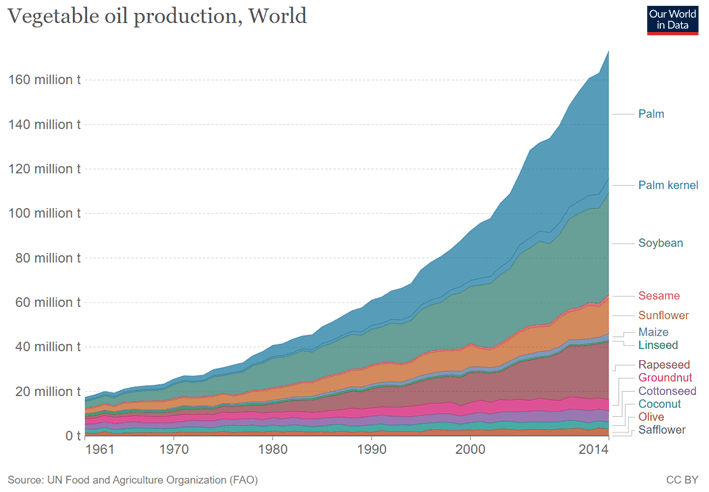
As noted earlier, monounsaturated and polyunsaturated fat has contributed to most of our additional calorie intake over the past century. This is all thanks to our booming production of vegetable oils like palm, soybean, and sunflower oil!
As you can see in the chart below from Our World in Data, our worldwide production of vegetable oils has increased from 20 million tonnes per year to more than 160 million tonnes since the 1960s!
The chart below shows that polyunsaturated fats have risen from 3% to 10% of total calories. Similarly, monounsaturated fat has increased from 12% to 18% of total calories. At the same time, consumption of saturated fat has decreased since the 1960s.

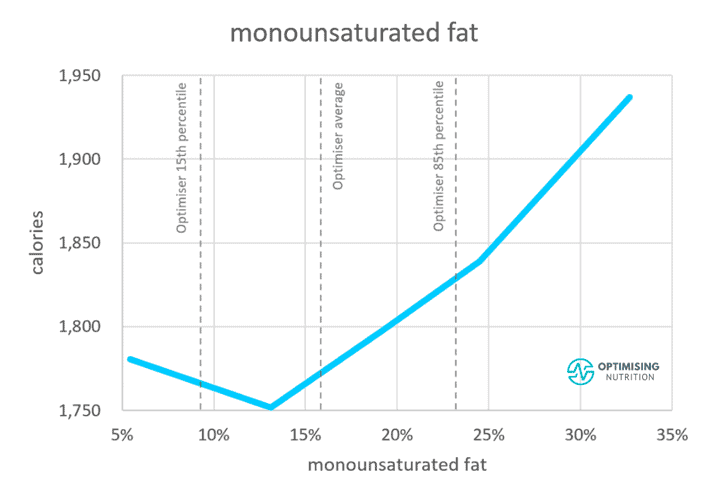
The next satiety response curve shows that we consume much more energy when monounsaturated fat intake exceeds 15% of calories.
A lower intake of polyunsaturated fat also appears to be ideal. Similar to monounsaturated fat, higher intakes of polyunsaturated fat align with greater energy intakes.
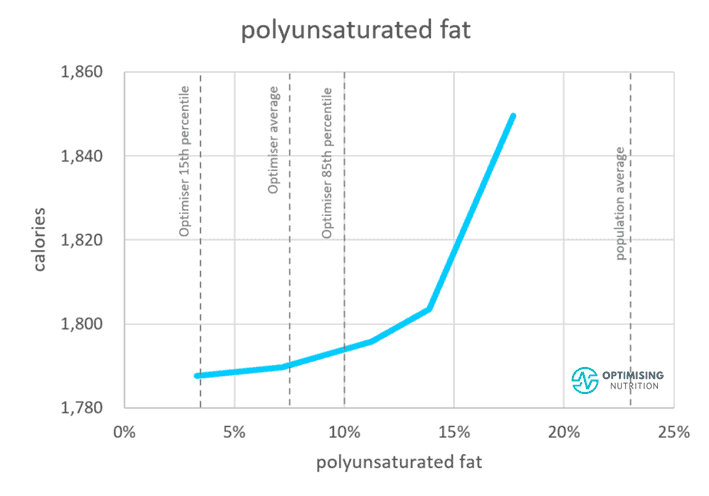
While there is no need to be concerned about unsaturated fats from whole foods like nuts and seeds — unless you’re eating them by the kilo — reducing added fat from seed oils, particularly in processed foods, is wise if your goal is weight loss and improved metabolic health.
Is Fat Better or Worse Than Carbohydrates?
As the following chart illustrates, we see a similar satiety response from reducing fat or carbohydrates. Therefore, reducing energy from carbohydrates or fat while still optimising nutrient intake could help increase satiety so you can lose weight.
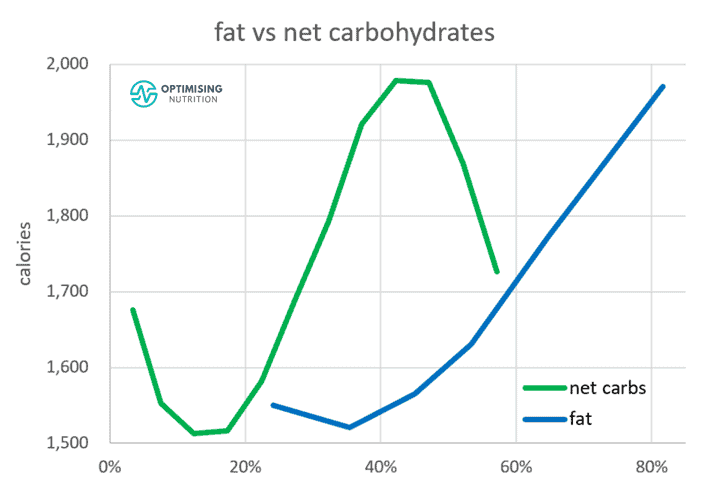
In the following section, we’ll look at how you can determine your ideal fat intake based on your goals.
Where Should You Start?
Due to concerns around cholesterol, saturated fat, and total fat intake, mainstream macronutrient guidance starts with reducing fat calories. Thus, the remainder of energy comes from carbohydrates and protein.
Because most people are interested in losing weight and stabilising their blood glucose, and a higher protein % aligns with greater satiety and nutrient density, it makes sense to ensure they are getting adequate protein first.
From there, we can tailor their carbohydrate intake based on their blood glucose variability and energy expenditure and fill in the rest of their energy requirements with fat.
Ideal Fat Intake for Different Goals
As noted earlier, the optimal fat intake is not ideal for everyone, especially if you want to maintain or gain weight.
At the same time, the official AMDR ranges are intended for healthy people. However, it’s crucial to consider your context and goals when setting up your macronutrient targets, especially if you are not already healthy.
We believe it’s essential to lay your nutritional foundation by consuming enough protein and obtaining adequate amounts of vitamins and minerals while remaining within your daily energy budget. From there, you can use fat and carbs as levers and fill in your energy gaps with them based on your preferences and goals.
While carbohydrates and fats are energy sources, they behave differently in our bodies. Fat is a slow-burning fuel that is dense and easy to store, whereas carbs are harder to store and better for explosive activity.
Athletes
Athletes who expend a lot of energy require more carbohydrates and fat, a lower protein %, and less fibre. While this seems counterintuitive to our discussion, this combination meets their goals by allowing them to reduce satiety and eat more.
Long-duration, lower-intensity activity can be fuelled by fat, with targeted carbohydrates used to keep blood glucose from dropping too low. For endurance activities shorter than an hour, most athletes don’t need to worry about adding extra carbohydrates; refuelling with a hearty meal after exercise is usually adequate. Your body will crave more carbohydrates to refill glycogen stores at this point.
Excessive carbohydrates can lead to rebound hypoglycaemia. This occurs when your blood glucose rises and drops rapidly from an insulin response produced in response to the large bolus of carbohydrates you just consumed.
If you find this occurs when you eat before or during your workout, it may be beneficial to fuel with a little less carbohydrate and a little more fat. However, additional carbohydrates can also be helpful because we can burn them more quickly than fat if you are undertaking a more intense activity with a higher heart rate.
Diabetes
Mainstream dietary advice given to people with diabetes aligns with the mainstream ADMR.
When my wife was diagnosed with Type 1 diabetes at ten years of age, she was told she needed four servings of carbohydrates with each meal to match her insulin dosing—or she would die of hypoglycaemia.
Unfortunately, this amount of carbohydrates was more food than she could physically eat. As a result, she gained weight quickly and became obese following this advice. Yet when my son was recently diagnosed with Type 1 diabetes, we received the same carb-centric advice. It’s funny—although frustrating!—to see that these guidelines haven’t changed in nearly three decades!
Recently, more people who use insulin to manage their diabetes have started utilising counting methods to match their insulin doses to their carbohydrate intake. While this is a step forward, the reality is that it’s impossible to match your insulin dose to your carb intake accurately; large carbs and insulin inputs lead to significant dosing errors.
In our Macros Masterclass and Data-Driven Fasting Challenges, we guide people through reducing their carb intake gradually if their blood glucose rises by more than 30 mg/dL (1.6 mmol/L) after meals. Given that Type 2 diabetes is often related to obesity and excess fat, the next step, after blood glucose is under control, is to focus on reducing dietary fat so body fat can be used.
In our Macros Masterclass and Data-Driven Fasting Challenges, we guide people through reducing their carb intake gradually if their blood glucose rises by more than 30 mg/dL (1.6 mmol/L) after meals. Given that Type 2 diabetes is often related to obesity and excess fat, the next step, after blood glucose is under control, is to focus on reducing dietary fat so body fat can be used.
Weight Loss
If your goal is weight loss, you must prioritise adequate protein and nutrients from food while dialling back energy from carbs and fat.
In our Macros Masterclass, we guide Optimisers through identifying their typical maintenance diet and progressively dialling back their carb and fat limits to lose weight at a sustainable rate of 0.5% to 1.0% per week. Cutting calories more than this tends to provoke excess hunger and rebound binging.
Maintenance
People looking to maintain their weight also need to ensure they get the protein and nutrients required. From there, they can increase energy from fat or carbs to maintain their weight. The mix of energy from fat vs carbs doesn’t matter too much, especially if their blood sugars are in the normal, healthy range.
So How Many Grams of Fat Should I Consume?
Hopefully, you can see that the appropriate fat intake will depend on your goals and preferences.
The table below shows a range of possible fat targets (in grams) for different goals and calorie intakes.
- 20% fat: the lower end of the AMDR
- 35% fat: the upper end of the AMDR
- 45% fat: the average population intake
- 60% fat: the typical fat intake of a low-carb dieter who does not want to lose weight.
| Calories | 20% | 35% | 45% | 60% |
| 1000 | 22 | 39 | 50 | 67 |
| 1500 | 33 | 58 | 75 | 100 |
| 2000 | 44 | 78 | 100 | 133 |
| 2500 | 56 | 97 | 125 | 167 |
| 3000 | 67 | 117 | 150 | 200 |
For more bio-individualised guidance, you can try our free Macro Calculator here.
Summary
Fat is an energy source that often comes packaged with protein. While the official AMDR for fat of 20% to 35% of calories aligns with optimal satiety and nutrient density, it may not be ideal for you.
To find the ideal fat intake for you, we suggest:
- Ensuring you’re getting enough protein and micronutrients from your diet;
- Dialling back carbohydrates (if necessary) to achieve healthy blood sugar stability or sugars that rise by no more than 30 mg/dL (1.6 mmol/L) after meals and
- Using fat as a lever, either reducing dietary fat to lose weight or increasing dietary fat to gain weight or to support your activity levels.
AMDR series
- Protein – Optimal vs Acceptable Macronutrient Distribution Range (AMDR)
- Carbohydrates – The Optimal vs Acceptable Macronutrient Distribution Range (AMDR)
- Fat – Optimal vs Acceptable Macronutrient Distribution Range (AMDR)
- The “Acceptable” Macronutrient Ranges (AMDRs) for Protein, Fat and Carbs: A Data-Driven Review
- Dietary Fibre: How Much Do You Need?
- Low Carb vs LowFat: What’s Best for Weight Loss, Satiety, Nutrient Density, and Long-Term Adherence?
- High Protein vs High Fat: What’s Ideal for YOU?