

If you’ve ever felt like cholesterol is a riddle wrapped in an enigma, especially while navigating the landscape of low-carb or keto diets, you’re not alone.
For nearly a century, we’ve been told that consuming more dietary fat and cholesterol spells trouble for our blood cholesterol levels. So, should you be worried?
Breathe a sigh of relief because this article is about to unravel the cholesterol conundrum. Here’s the secret: when you make quality the cornerstone of your diet, your body becomes a master at managing the fuels you feed it.
In this eye-opening journey, we’ll demystify the perplexing realm of dietary cholesterol. Brace yourself to finally understand whether those blood cholesterol levels or your dietary cholesterol intake should keep you up at night.
- Cholesterol Myth Busting
- The Energy in Your Blood Is Influenced by the Fuel You Give Your Body
- What Are Optimal Cholesterol Levels?
- The Problem with Modern-Day Cholesterol Ranges
- The Straight Dope on Cholesterol
- What is Cholesterol’s Primary Role in Your Body?
- Cholesterol Particle Size Distribution
- What Should My Blood Sugar Be?
- When Should High Cholesterol Concern You?
- What Are the Warning Signs of High Cholesterol?
- Risk Calculator: Cholesterol HDL Ratio
- How Does Your Diet Affect Your Risk?
- It All Comes Back to Satiety!
- What About Dietary Cholesterol?
Cholesterol Myth Busting
Over the years, cholesterol has gotten a pretty bad rap.
The relationship between dietary cholesterol and blood cholesterol was thought to go hand-in-hand. However, recent research suggests that this is not necessarily the case. As a result, the 2015–2020 Dietary Guidelines for Americans removed the recommendations of restricting dietary cholesterol.
Your body actually synthesises around 90% of all cholesterol circulating throughout your body on its own, or ‘endogenously’. Only about 10-20% comes from your diet.
Most people have been led to believe there are ‘good’ and ‘bad’ cholesterols (i.e., HDL and LDL, respectively). However, LDL is simply a cholesterol transport molecule that takes fat to cells for energy. HDL brings cholesterol back to the liver to be excreted in bile.
In short, we NEED LDL to transport energy as lipids to our cells. But at the same time, excess energy in your bloodstream (i.e. energy toxicity) is never a good thing, whether that be in the form of glucose, fat or even ketones.
More recent research has shown that high cholesterol may not necessarily be from the cholesterol you eat, but instead a result of other factors like an imbalanced microbiome, environmental toxicity, or an effect—not a cause—of metabolic disorder that has resulted in our weakened ability to regulate cholesterol.
High cholesterol seems to result from faulty fat transport and energy utilisation in the body. As a result, eating more fat could make your blood cholesterol higher.
It seems that high cholesterol in the blood may be a symptom of poor health rather than the cause. However, as we will explore in this article, it may or may not be a problem depending on your bio-individual situation.
The Energy in Your Blood Is Influenced by the Fuel You Give Your Body
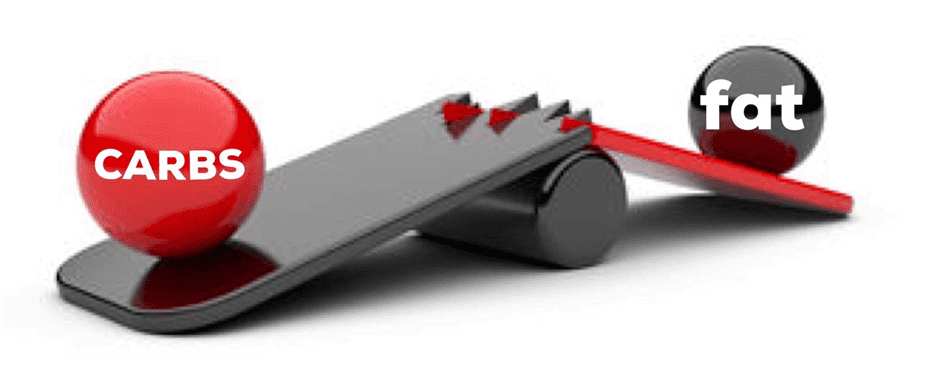
It makes sense that the balance of fat and glucose in your blood is significantly influenced by the fuel you give your body.
- If you tend to eat more carbs, you might see lower levels of fat in your blood and higher blood glucose. However, simply eating ‘low-fat’ might not guarantee lowered cholesterol numbers, as the body can make the cholesterol it needs from whatever energy source you give it.
- You might see lower blood glucose levels and higher cholesterol if you typically get more energy from fat.
- But, as shown by our satiety analysis, if you eat a diet that consists of a similar mixture of fat and carbs, you will not only eat more, but you will also see higher glucose and fat levels in your blood.
- While we tend to do OK if we get our fuel predominantly from fat or carbs, our body does not do well with a combination of both fuels at the same time.
What Are Optimal Cholesterol Levels?
We are usually told that high cholesterol is bad and low is good. But like most things in nature, optimal rarely occurs at extremes.
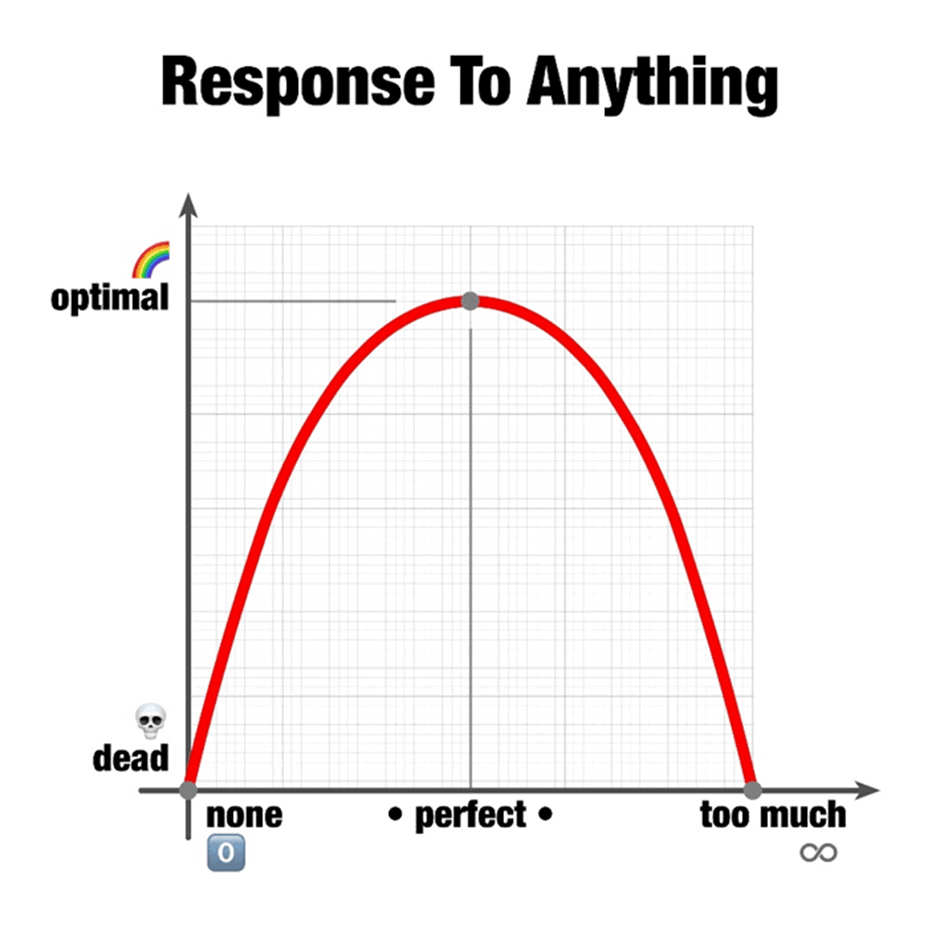
A 2019 study looking at all-cause mortality determined either too little or too much blood cholesterol could be a problem. According to its results, the total cholesterol value associated with the lowest risk of all-cause mortality lies between 200 and 250 mg/dL (or 5.2 to 6.5 mmol/L). Meanwhile, the standard reference range for total cholesterol you will see on your blood test is likely to be 125 to 200 mg/dL (3.2 to 5.2 mmol/L).

The Problem with Modern-Day Cholesterol Ranges
If you fall outside of the standard reference range for your cholesterol markers on your routine bloodwork, your doctor may encourage you to take a statin drug to lower it.
However, it’s important to consider that:
- The standard reference ranges are based on people regularly getting bloodwork who may not be the healthiest. Healthy people with fewer concerns about their well-being often do not pursue bloodwork;
- The general population tends to be consuming less fat and more carbohydrate, so they typically see less fat in their blood because they’re fuelling with less dietary fat, and
- If you’re currently losing weight, you will tend to see more blood fat as your body releases it from storage. This is a good thing because the high levels of fat in your blood are from the body fat you are using. Thus, it’s wise to re-test when your weight remains stable for several months.
The Straight Dope on Cholesterol
I usually don’t get caught up in debates over cholesterol; there is so much passionate debate and little clear consensus! However, I found this presentation by Dr Paul Mason to be very informative from the Low Carb Down Under on the Gold Coast. He spoke before my presentation on satiety, so, I had a front-row seat to this extremely helpful presentation!

For the rest of this article, we will discuss:
- a summary of the highlights from Dr Mason’s cholesterol presentation,
- a simple cholesterol calculator to determine if you are at risk, and
- simple action steps to help you optimise your diet.
What is Cholesterol’s Primary Role in Your Body?
Cholesterol transports energy through your bloodstream to be used as energy. Your liver tightly regulates the flow of energy from your food to ensure you have just enough–but not too much! –energy in your bloodstream.
While we typically carry around five grams (20 calories worth) of energy as glucose in our bloodstream, we have about sixteen grams (150 calories worth) of fat floating around at any given time.
Short-chain and medium-chain fatty acids are absorbed directly into the bloodstream in the intestines, where they are paired with a transporter protein to move throughout the body.
However, long-chain fatty acids are re-assembled upon absorption and packaged into something called chylomicrons, which we know as lipoproteins.
Chylomicrons are too big to enter directly into circulation, so they’re absorbed through the lymphatic system, where they eventually flow right into the venous circulation.
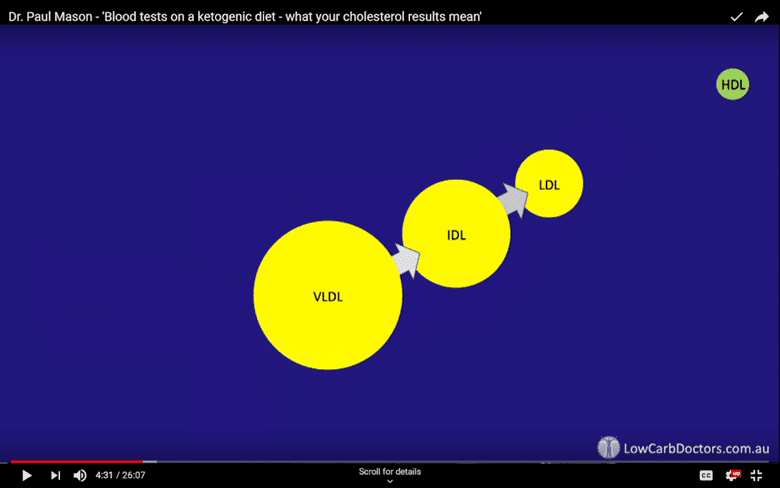
Once in circulation, these lipoproteins—or mixes of fat (lipo) and protein—move around the body to transport energy. Lipoproteins differ in size, density, and makeup and often begin as larger and less-dense molecules.
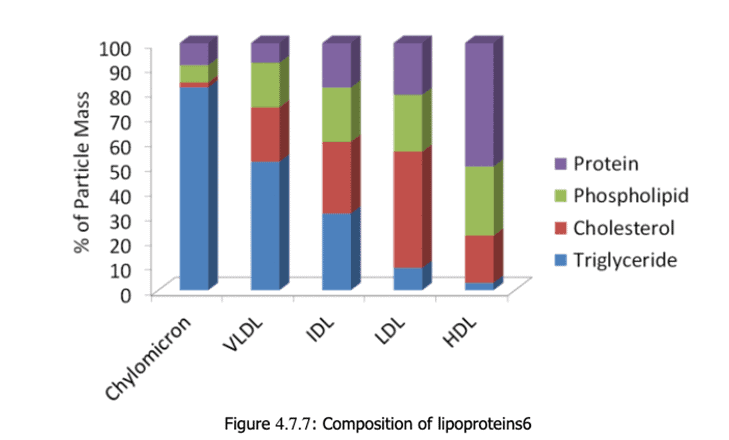
Cholesterol particles circulate throughout the body and drop off their energy cargo. Tissues in need of energy use enzymes to ‘clip’ off fatty acid molecules so they can be absorbed and transformed into energy.
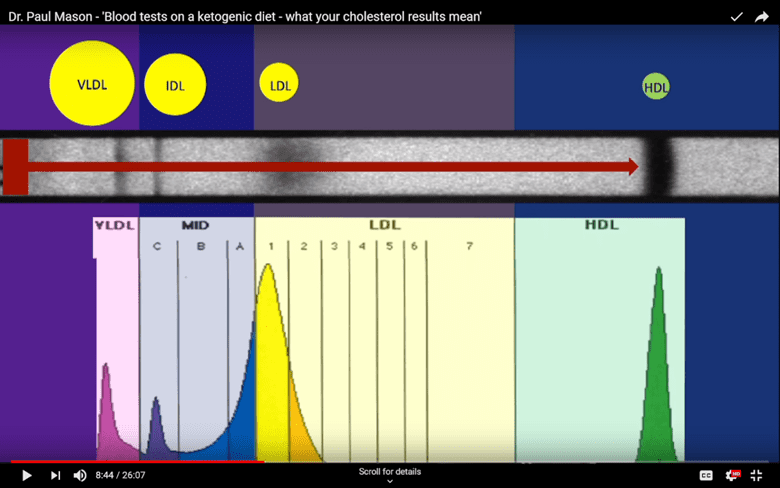
As this occurs, they transform from very-low-density lipoprotein (VLDL) to intermediate-low density lipoprotein (IDL) and then to low-density lipoprotein (LDL).
LDL contains a certain lipoprotein whose purpose is to attach to LDL receptors to allow LDL to enter them. Here, they are broken metabolised into amino acids and cholesterol the cell can use.
Low-density lipoprotein (LDL) is often referred to as ‘bad cholesterol’. However, this isn’t necessarily the case. LDL has critical roles in the body, and its connotation as ‘bad’ more or less is a result of being caught at the ‘wrong place at the wrong time’.
Like children who hang out with the naughty kids at school, LDL becomes “bad” when it oxidises after being caught by white blood cells after hanging in circulation for too long. Here, foam cells are produced, which can accumulate. If too many gather, we can see the formation of a ‘fatty streak’ and resultant atherosclerosis.
We can see higher levels of ‘small, dense LDL’ particles when they become damaged by glycation from an increased presence of glucose coupled with oxidation (rusting).
In short, an LDL molecule that undergoes glycation and oxidation becomes a pro-oxidant or a substance capable of causing damage to your body.
Hence, it’s likely that high LDL cholesterol isn’t a significant concern unless you also have elevated blood sugars and chronic inflammation.
Cholesterol Particle Size Distribution
The cholesterol particle size distribution shown below is from someone with a healthy, non-oxidised LDL profile. Notice how the big curve below the LDL particle (yellow section) has a smooth and even distribution.
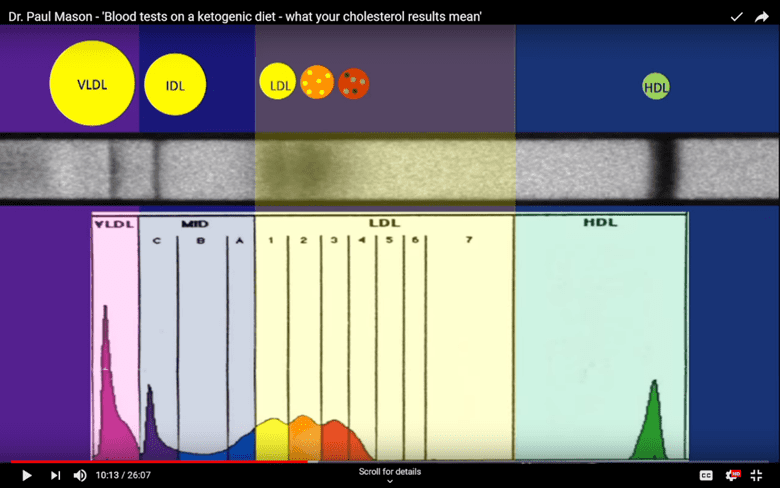
In contrast, the cholesterol particle size distribution of someone with small dense (glycated) LDL is markedly different. Rather than having a big smooth LDL particle distribution curve, we see several separate and distinct peaks in yellow, orange, and red.
Oxidised LDL causes atheromas or a build-up of plaque build-ups in the lining of blood vessels. This build-up of oxidised LDL is thought to contribute to blocked arteries and conditions like atherosclerosis.
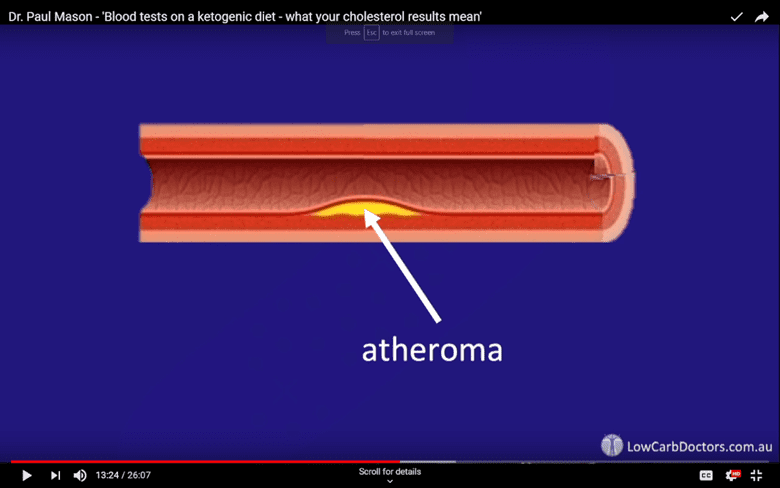
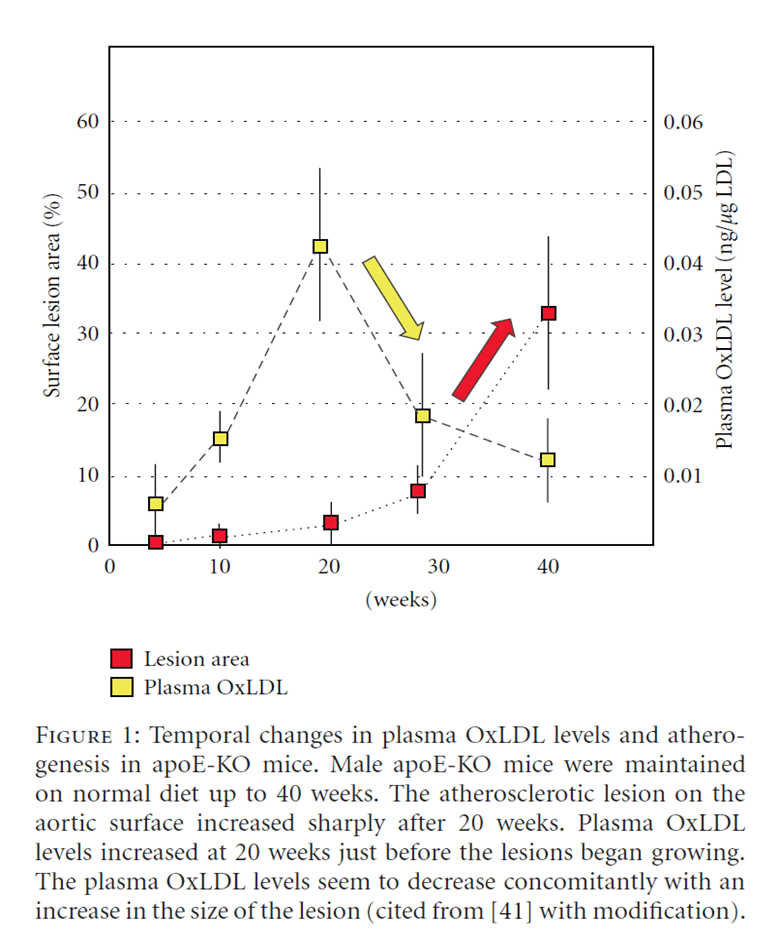
A long-term increase in oxidised LDL precedes the development of lesions in blood vessel walls, which appears to drive heart disease. As a result, LDL has been labelled the ‘cause’ of this epidemic.
Thus,
- if your blood glucose levels are low, “high LDL” may not be a significant concern – while your energy from fat is higher, the energy from glucose in your blood is low, however
- if your blood sugars and LDL are both high, you might have a problem.
What Should My Blood Sugar Be?
Your waking blood sugar, or your blood glucose taken upon rising, can help you understand your overall risk of having oxidised LDL from high glucose levels.
If your glucose is low and within a healthy range, your chances of seeing oxidised LDL are also low.
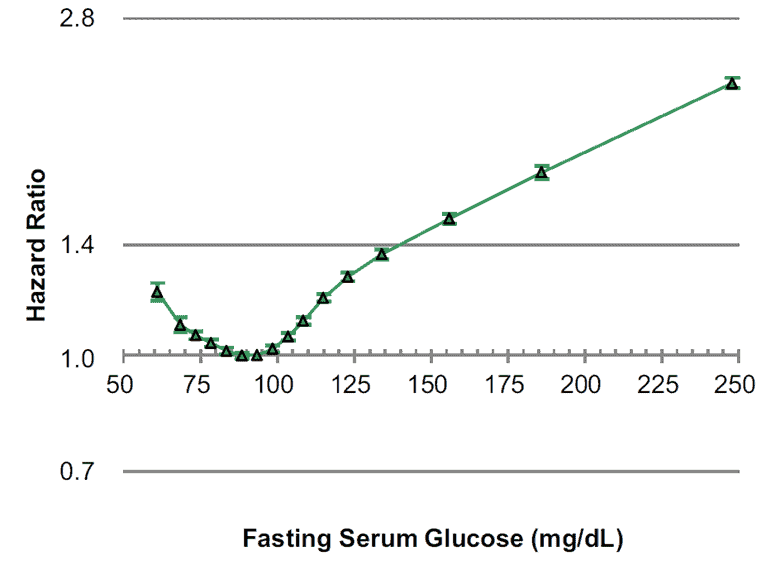
While having high blood fat levels is not optimal, having high glucose is not exactly a good thing, either. In the chart below, notice the lowest overall risk of all-cause mortality aligns with a fasting glucose of between 80 and 100 mg/dL (or 4.4 to 5.6 mmol/L).
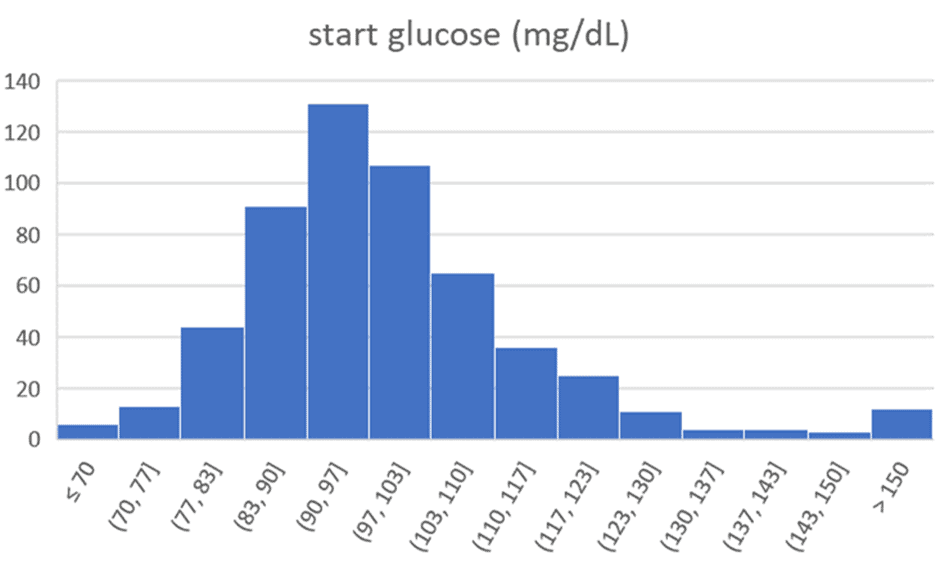
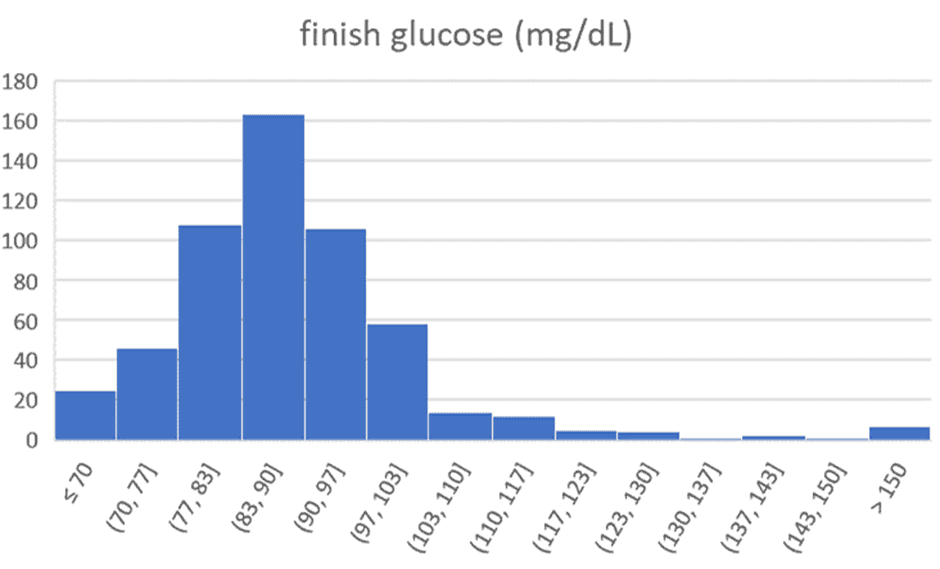
The charts below show the range of premeal blood sugars we see in people participating in our Data-Driven Fasting Challenges. The average starting glucose is 100 mg/dL (5.6 mmol/L). After 30 days of using their premeal blood sugars to guide what and when they eat, the average reduces to 90 mg/dL (5.0 mmol/L).
When it comes to managing blood sugar, keep in mind that minimising the rise in blood sugar after meals is not your only concern. In our Data-Driven Fasting Challenge and Macros Masterclass, we suggest people reduce their carb intake if their blood sugars rise by more than 30 mg/dL (1.6 mmol/L) after meals. Because most low-carbers fuel themselves with less carbohydrate, most of them already have reasonably stable blood glucose.
However, unfortunately, simply eating foods that achieve a small rise in blood glucose low after meals does not necessarily solve the problem. If it doesn’t lead to weight loss and lowered waking blood sugars over time, simply stabilising blood sugars is essentially symptom management and just a way to make your doctor happy with numbers that fall ‘in range’.
The data from Data-Driven Fasting users indicate no relationship between more stable blood sugars, lower waist: height (W: H) ratios, or healthier body mass indexes (BMI).

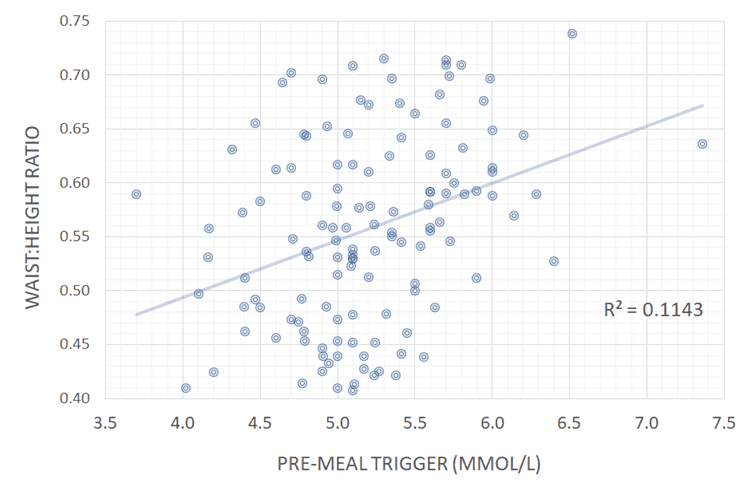
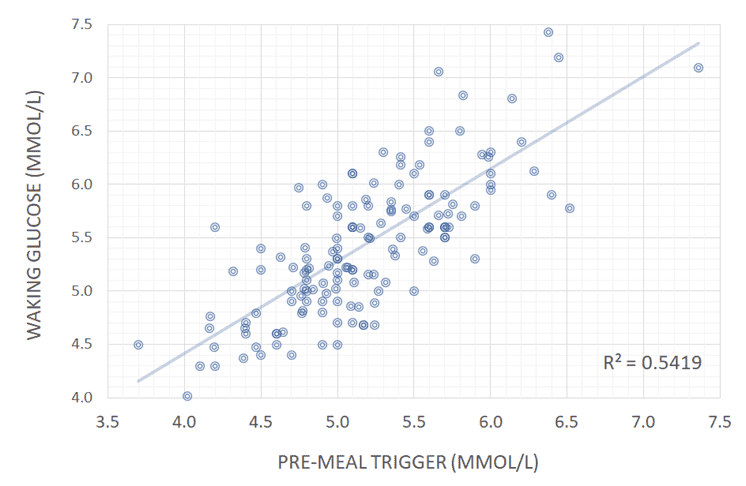
Instead, our data analysis showed that your blood sugar before meals is most strongly correlated to the waist: height ratio and BMI. Your blood sugar before you eat–and not the rise afterwards—correlates most strongly to your waking glucose and blood sugar levels throughout the day.
Achieving lower blood sugars and reducing your insulin levels across the day is a matter of improving body composition by decreasing your body fat and improving your lean muscle mass rather than simply decreasing dietary carbohydrates.
When Should High Cholesterol Concern You?
All of these substances work in tandem. Hence, looking at ratios between your LDL, HDL, and triglycerides is a better indicator of your metabolic health.
While advanced lipid particle size distribution tests are interesting, they are expensive and thus not regularly performed. However, routine lab tests looking at your triglycerides and HDL are a cheap and informative way to determine whether you have a high-risk cholesterol profile quickly.
As shown in the slides from Dr Mason’s presentation:
- If your triglycerides are less than 0.5 mmol/L (44mg/dL), it’s less likely your LDL will oxidise.
- If your HDL is higher than 1.5 mmol/L (58 mg/dL), you likely have a healthy ‘Pattern A’ profile with a minimal oxidation risk.
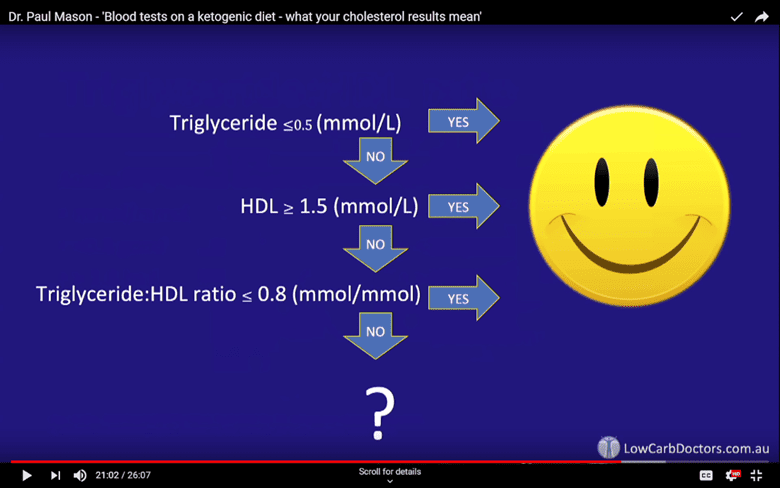
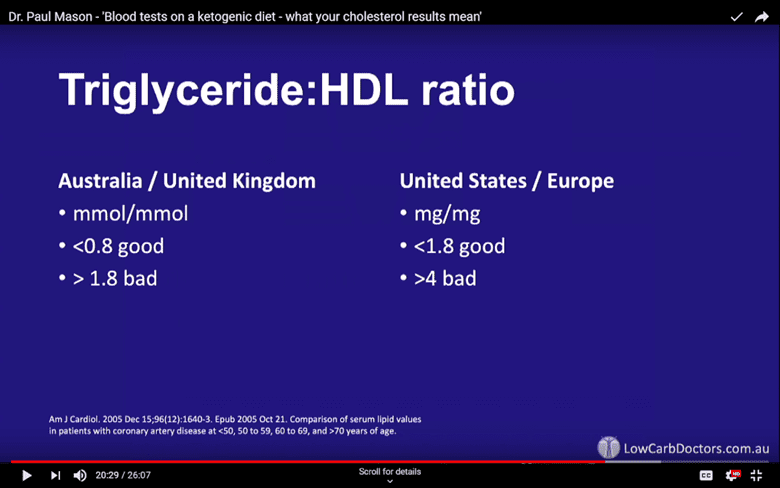
- The triglyceride: HDL ratio is a well-accepted marker for insulin resistance. If your triglyceride: HDL ratio is less than 0.8 (in Australia, NZ, or the UK), or less than 1.8 (in the US or Europe), you likely have a healthy ‘Pattern A’ cholesterol profile.
- If your triglyceride: HDL ratio is higher than 1.8 (in Australia or UK) or >4 (in the US and Europe), you may have cause for concern.
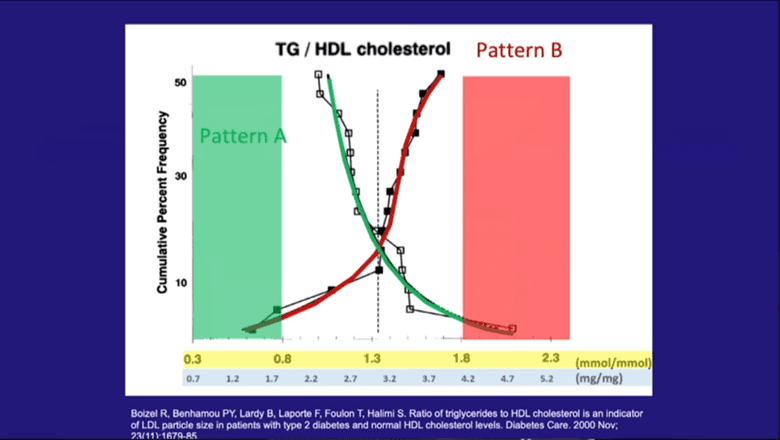
The figure below shows the triglyceride: HDL ratio vs the amount of IDL and LDL (open squares) and small dense LDL (black squares) (reference).
Triglycerides are fats found in the blood. They are created by the body to store excess energy. High triglycerides are linked to metabolic disorders, heart disease, and many other modern diseases.
- If your triglyceride ratio is low, you likely have a healthy ‘Pattern A’ cholesterol particle size distribution and minimally oxidised HDL (green area).
- If you have a high triglyceride: HDL ratio, you almost certainly have a “bad” ‘Pattern B’ cholesterol profile (red area).
- If you sit somewhere between the two (white area), you should pay attention to your blood sugars to minimise the risk of oxidised LDL. Levels here are considered to be at a higher risk of becoming problematic. You may want to consider pursuing more advanced tests like an LDL particle size distribution analysis, ApoB, or a Coronary Artery Calcium Score to better understand your risk.
What Are the Warning Signs of High Cholesterol?
Someone with high cholesterol without elevated blood sugars may not need to be concerned. However, if you have both high cholesterol and high blood sugars, it may be worth digging a little deeper.
If your blood sugar and cholesterol are both high and you’re regularly dealing with high blood pressure (hypertension), chest pain (angina), nausea, extreme fatigue, shortness of breath, poor circulation or numbness in your limbs you likely have issues you need to address.
Risk Calculator: Cholesterol HDL Ratio
We have set up a simple spreadsheet to help you make sense of all your blood results to decipher what path is best for you.
If you have your triglyceride and HDL numbers from your latest blood test handy and want to assess your risk, you can use this calculator.
Simply download it, enter your triglyceride and HDL values, and see if your levels warrant any concern.
How Does Your Diet Affect Your Risk?
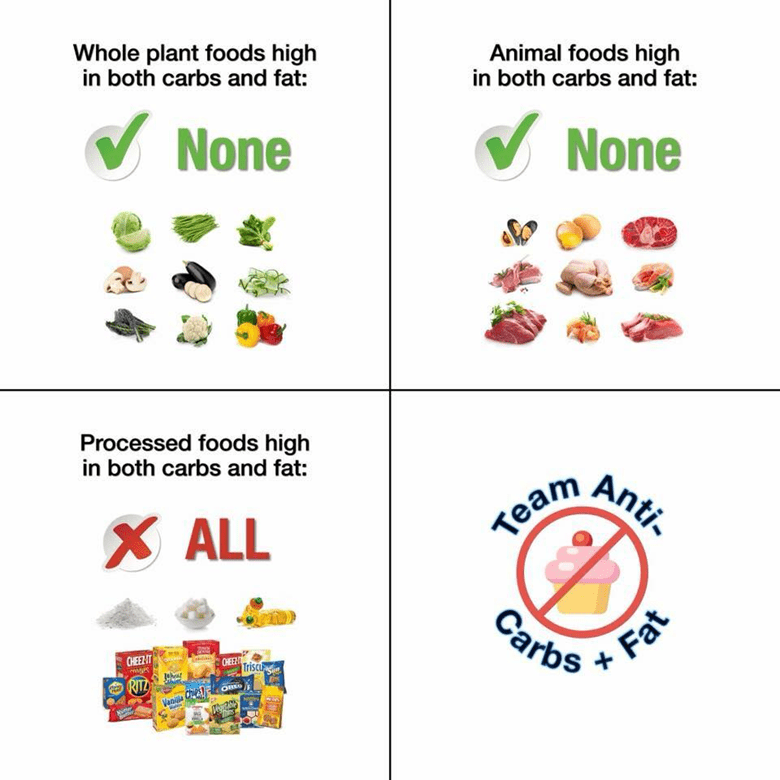
Whether your levels are concerning or not, one common theme is that most of us don’t do well when we mix high levels of fat and carbs.
It’s not necessarily fat or the carbs that are the problem. Instead, it’s rather the challenge your body has metabolising both of these energy sources simultaneously.
Fat and carbs are rarely found together in nature. When we combine them in modern processed foods, cholesterol and glucose hang around in the bloodstream together for extended periods. If it goes unaddressed, it can eventually lead to oxidised LDL and heart disease.
In nature, dietary fat, carbs, and protein tend to oscillate seasonally. Before modern industrial agriculture and food processing, we wouldn’t have had access to such high levels of carbs and fat year-round, on-demand, or simultaneously.
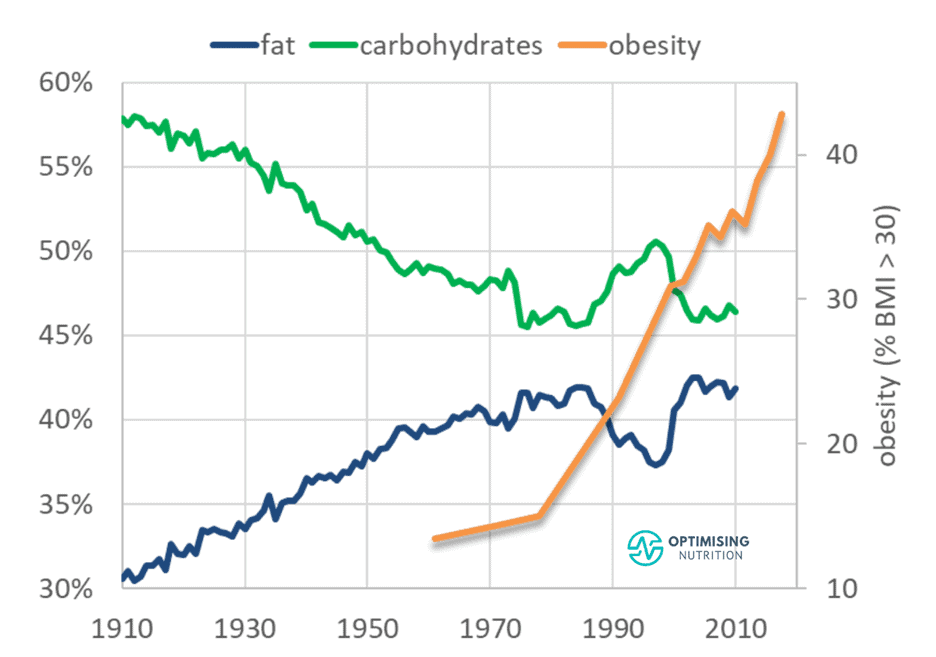
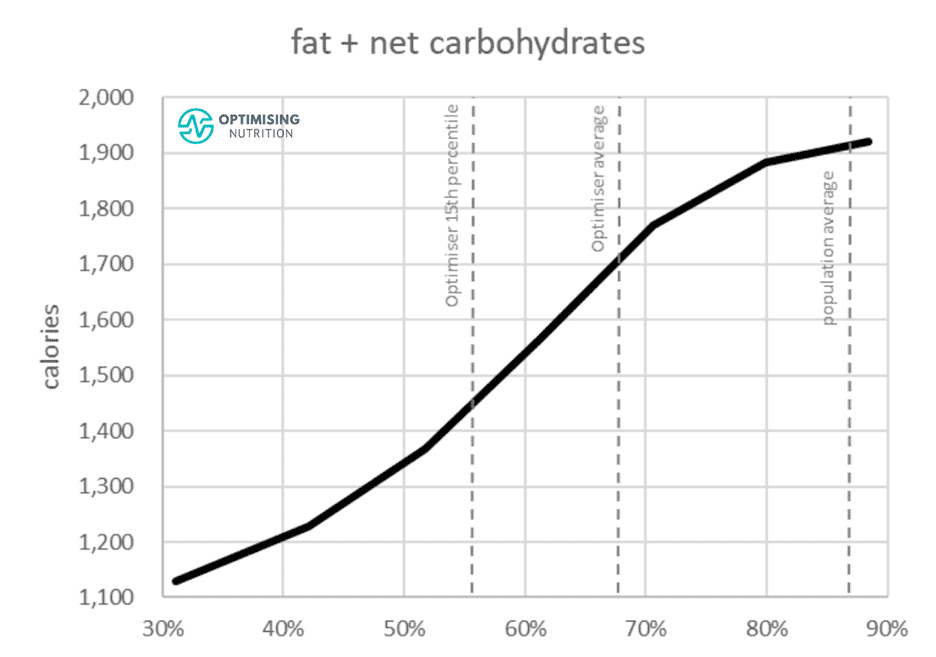
As shown in the chart below, over the last century, increased food processing and the addition of industrial seed oils to refined grains and sugars means that our diet has become a similar mix of fat and carbs together.
It All Comes Back to Satiety!
Our satiety analysis indicates that we struggle to overeat either low fat or a low carb diet. Instead, it’s rather the combination of carbs and fat that drives us to overeat.
Constantly over-fuelling with hyper-palatable, carb-and-fat combo foods causes our body fat stores to overfill. As a result, large amounts of energy in the form of fatty acids, blood sugar, and ketones subsequently overflow into our bloodstream.
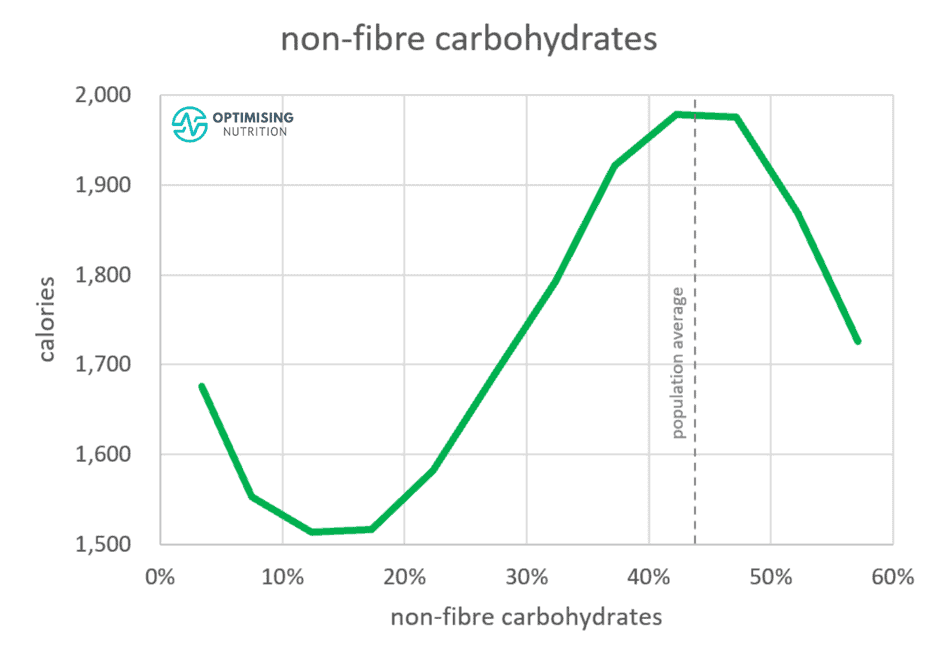
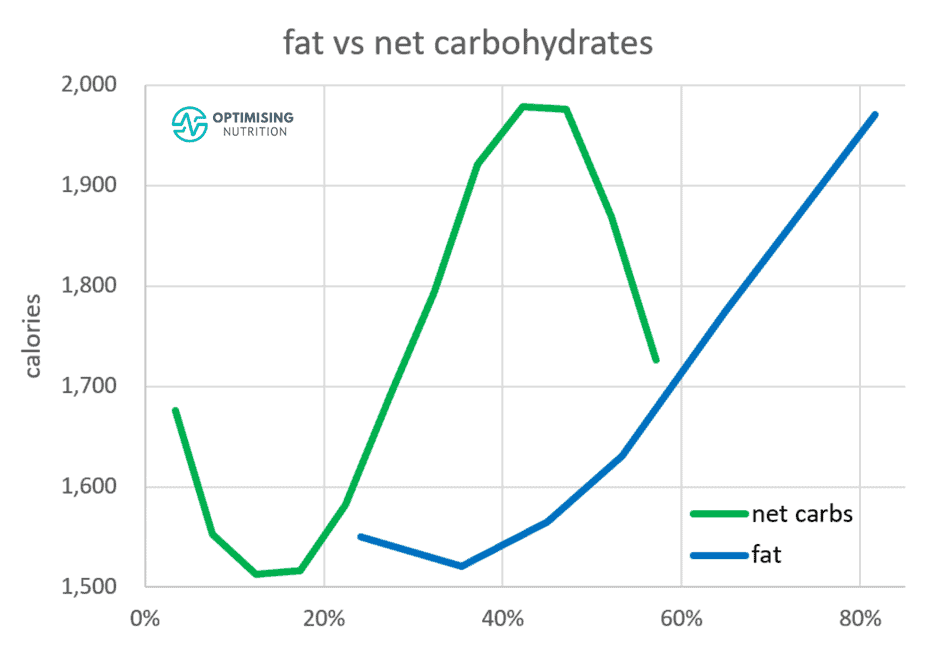
The chart below from our satiety analysis shows:
- we tend to consume the most calories when the food we eat contains around 43% non-fibre carbohydrates, and
- we tend to eat the least when our diet contains about 15% non-fibre carbohydrates.
Interestingly, reducing fat from 80% to 35% of calories has a similar effect on carbohydrate reduction.
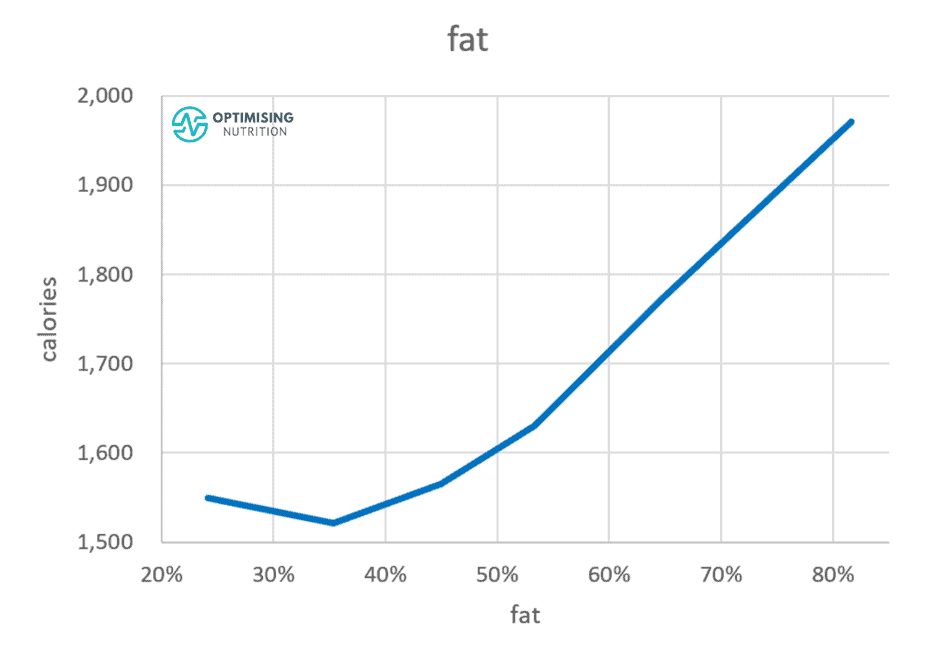
Reducing either carbohydrates OR fat impacts our satiety and likelihood of eating less to a similar degree.
We get the best overall satiety response if we reduce fat and carbohydrates and prioritise foods containing more protein, fibre, and nutrients per calorie.
What About Dietary Cholesterol?
This article wouldn’t be complete if we didn’t mention dietary cholesterol.
It’s interesting to note that our intake of cholesterol-containing foods has been falling since 1950. But despite this reduction, obesity rates have continued to climb.
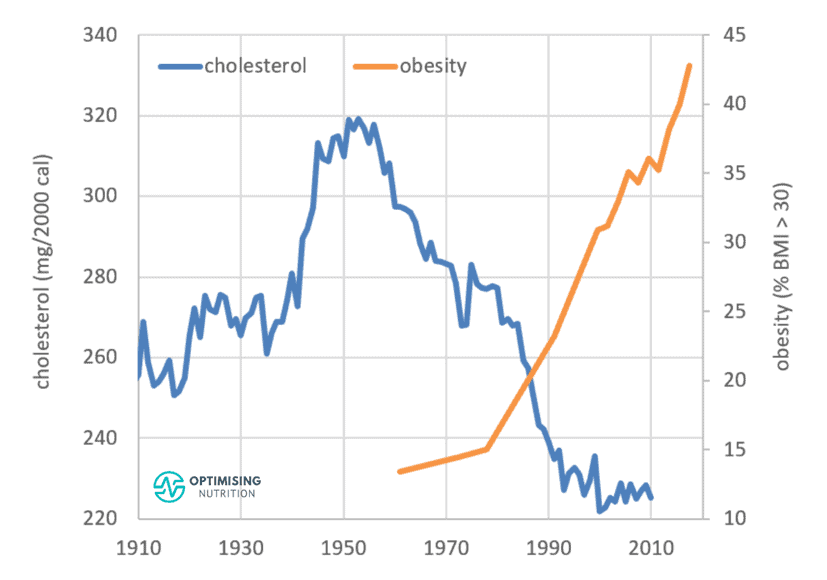
The decline in consumption of cholesterol-rich foods aligns closely with our increase in calorie intake. Consumers have swapped these foods with energy from industrial fats and refined carbs, fuelling the obesity epidemic.

Of course, cholesterol is not the only thing that has dwindled since the industrialisation of our food system. Cholesterol, sodium, and calcium are the top three nutrients that have decreased in our food system as our calorie intake has spiralled upwards.
| nutrient | correlation with calories |
| sodium (g/2000 cals) | -96% |
| calcium (g/2000 cals) | -96% |
| cholesterol (g/2000 cals) | -96% |
| saturated fat (%) | -92% |
| potassium (g/2000 cals) | -91% |
| vitamin A (RAE/2000 cal) | -81% |
Cholesterol is not deemed an essential nutrient as your intestines and liver make most of what you require for vital bodily functions. The body needs cholesterol to synthesise vitamin D, make hormones, and maintain fluid cell membranes.
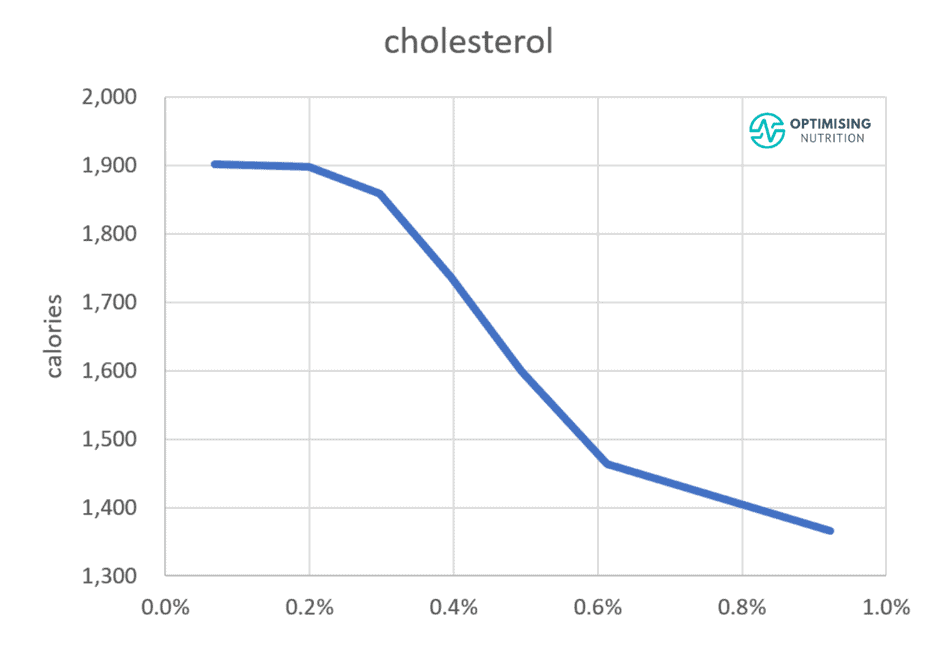
However, our satiety analysis showed that foods with more cholesterol per calorie tend to align with a lower overall energy intake, as shown in the graph below. People consuming more dietary cholesterol tend to consume 33% fewer calories than those who consume the least.
This doesn’t mean you should go out of your way to eat as much cholesterol as possible! There are many other essential nutrients to focus on. However, it seems there is no need to go out of your way to avoid nutrient-dense foods that contain cholesterol.
Nutrient-dense foods provide greater satiety and allow you to eat less, reduce body fat, and minimise the amount of excess energy from fat and glucose in your bloodstream.
More
- Dietary Cholesterol and Blood Cholesterol: Are They Related?
- The Satiety Index
- Data-Driven Fasting: How to Lose Weight and Reverse Type 2 Diabetes Without Tracking Your Food
- Does Eating Fat Make You Fat?
- Keto Lie #11: You Should ‘Eat Fat to Satiety’ to Lose Body Fat
- Macros Masterclass
Thanks
Special thanks to Paul Mason, Dave Feldman, RD Dikeman, Alexandra Bucko and Caroline Elizabeth for their review and feedback on this article and Ted Naiman for allowing me to use his awesome memes.
Wow! What a well researched and informative article. I learnt so much. Just brilliant Marty.
Thanks so much Jennie!
Yes, one of the best articles I have read in a long time – and I read a lot!!
Thanks
wow! thanks so much. I’m glad you found it so helpful!
Wow, I know quite a bit about the subject, but Marty explained it in such a way that someone who doesn’t have a great idea of the whole thing is also standing by. Fantastic Marty, just great… Thank you so much, Maurizio from Switzerland.
thanks so much Maruizio!
Very interesting and informative video. I do have a question. On the Sigma Nutrition site, they refer to large Pattern A LDL particles and small Pattern B LDL particles. Their article states that all LDL particle sizes will permeate the blood vessel wall. They state “Patients with small LDLs do have higher risk than those with larger LDLs if we do not account for overall particle number. However, this apparent effect of size disappears when we account for total particle number. When you have the same number of LDL particles, regardless of whether they are pattern A or B, risk is essentially the same.” They suggest to measure Apolipoprotein B 100 to get a true picture of risk. My question: are the same definitions of Pattern A and Pattern B being used by Dr. Mason and the Sigma Nutrition site?
Agree that it can get confusing quickly with passionate debate from the experts on both sides. What we do know is high levels of fat and glucose at the same time are not ideal. High levels of energy from glucose or fat by themselves are likely not ideal either. It would be interesting to hear Dr Mason and Alan from Sigma discuss the topic, though I’m not sure there would be much consensus or increased understanding.
OK, however, my question was are they defining Pattern A and Pattern in the same manner or are they two distinct concepts?