
Dive into the realm of carbohydrate consumption as we dissect the Acceptable Macronutrient Distribution Range (AMDR) for carbs.
In this article, we’ll illuminate the contrast between the recommended and optimal carbohydrate intake for different goals, showcasing how the right balance can significantly influence your satiety and nutrient density.
Embark on this enlightening journey to tailor your carb intake to align with your health objectives and lifestyle preferences.
- What Are the AMDRs?
- How Were the AMDRs Determined?
- Some of the Shortcomings of the AMDRs
- Lower Limit for Carbohydrates
- What Is the Optimal Carbohydrate Intake?
- Do We NEED a Minimum of 130 Grams of Carbs?
- How Much Carbohydrate Should I Eat?
- How Has Our Intake of Carbohydrates Changed Over Time?
- Ideal Carbohydrate Intakes for Different Goals
- Nutrient Density
- AMDR series
- More
Acceptable Macronutrient Distribution Ranges, or AMDRs, have been set for each macronutrient—protein, carbs, and fats—by the Food and Nutrition Board of The Institute of Medicine “for the planning and assessment of the diets of healthy people”.
The AMDR for carbohydrates is 45% to 65% of total calories. The Dietary Guidelines for Americans accompanied this with a recommended minimum daily carbohydrate intake (RDA) of 130 grams of carbohydrates per day.
While these recommendations may be appropriate for the healthy subset of the population, there has been plenty of disagreement and discussion as to whether these targets are ideal for the growing number of people who are not metabolically healthy.
From Atkins in the 1970s to the more recent keto and carnivore diets, many popular lower-carbohydrate trends have successfully been used for weight loss and diabetes management.
There are also communities consuming whole-food plant-based (WFPB) or high-starch diets (with no oil) that are leaner than people who stay within the moderate to high-carb AMDR targets.
In this article, we review the AMDR for carbohydrates vs the optimal carbohydrate intakes that our data has shown align with maximum satiety and nutrient density.
This understanding will empower you to cut through the confusion and identify the ideal carbohydrate intake that’s right for your goals, context, and preferences.
What Are the AMDRs?
The chart below shows the recommended intake of protein, fat, and carbohydrates based on age for men and women from the 2020-2025 Dietary Guidelines for Americans.

The following table summarises the macronutrient ranges, or AMDRs recommended in the guidelines.
| Macro | Min | Max | RDA |
| Protein | 10% | 35% | F – 46 g M – 56 g |
| Fat | 20% | 35% | – |
| Carb | 45% | 65% | 130 g |
These AMDRs are the amounts of protein, fats, and carbs deemed appropriate for healthy populations. However, it’s worth noting that a recent study from Tufts University found that only 7% of the US adult population is metabolically healthy, with many suffering from diabetes and obesity.
How Were the AMDRs Determined?
The explanation of how the AMDRs were developed highlights how greater HDL and lower LDL were observed in higher-carb studies.
It also mentioned that—based on the researchers’ observations—people were more likely to gain weight when eating fat above their AMDR reference range.
For more detail, see Dietary Reference Intakes for Energy, Carbohydrate, Fiber, Fat, Fatty Acids, Cholesterol, Protein, and Amino Acids (Food and Nutrition Board of The Institute of Medicine, 2005).
To summarise, the Institute of Medicine (IOM) observed:
- There appears to be an increased risk for heart disease at high carbohydrate intakes (>65%) (though this depends on the type of carbohydrate consumed).
- We require at least 15% protein and 20% fat, which leaves 65% remaining for carbohydrates.
- There is an increased risk of obesity with low carbohydrate, high-fat intakes (>45%) due to concerns about the energy density of a high-fat diet.
The AMDRs were established and published in the early 2000s and have not been revised since. However, numerous changes have since been made in the field of nutrition, including the removal of dietary cholesterol as a nutrient of concern from the 2015 Dietary Guidelines.
Much of the low-fat focus over the past half-century was due to concerns about excess cholesterol. However, since the release of the AMDR guidelines, multiple studies have also shown that lower blood cholesterol is associated with higher instances of all-cause mortality.
For more on whether cholesterol is worth all the worry, check out the article Cholesterol: When to Worry and What to Do About It.
It’s also worth noting that these reference ranges have not been used as an intervention to see if they improved health outcomes. Instead, the AMDRs were primarily established based on the quantities of carbs and fat that those healthier people appeared to be consuming. It did nothing to consider or account for other critical factors influencing energy tolerance, like activity levels or pre-existing conditions.
From diabetes to cancer, obesity, and neurodegeneration, many modern diseases stem from poor metabolic health and obesity. Hence, our discussion of the AMDR for carbohydrates will consider factors influencing satiety and blood glucose control.
We know from our in-depth satiety analysis that a greater nutrient density is associated with a higher degree of satiety. When someone feels more satiated, they are not only less prone to overeating energy-dense foods but can also keep their appetite under control.
Keeping our goal of nutrient adequacy front and centre, we will use our nutrient density analysis to drill deeper into what macronutrient ratios optimise nutrient intake and the carbohydrate intake that aligns with the greatest nutrient density and satiety.
Some of the Shortcomings of the AMDRs
The AMDRs have a few noticeable shortcomings, as outlined below.
They were based on associations between clinical endpoints like coronary heart disease, diabetes, cancer, and obesity that appeared to point to trends rather than those distinct endpoints themselves.
Because factors other than diet contribute to chronic illness, it is impossible to determine a defined intake level at which chronic disease may develop or be prevented. The mainstream mantra of “correlation does not equal causation” holds true here.
Additionally, while the institution developing the AMDRs looked at the association between populations currently free of chronic disease and what they eat, it neglected to examine which ways of eating contribute to these illnesses. In other words, it would make sense to determine dietary habits that led to disease and avoid them, right?
Despite looking at associations between disease and diet, the AMDRs don’t seem to have considered the relationships among macronutrient trends that coincide with obesity and metabolic disorders. The moderate carb, moderate fat recommendations align with the hyperpalatable junk foods that we tend to eat more of, especially when protein is low.
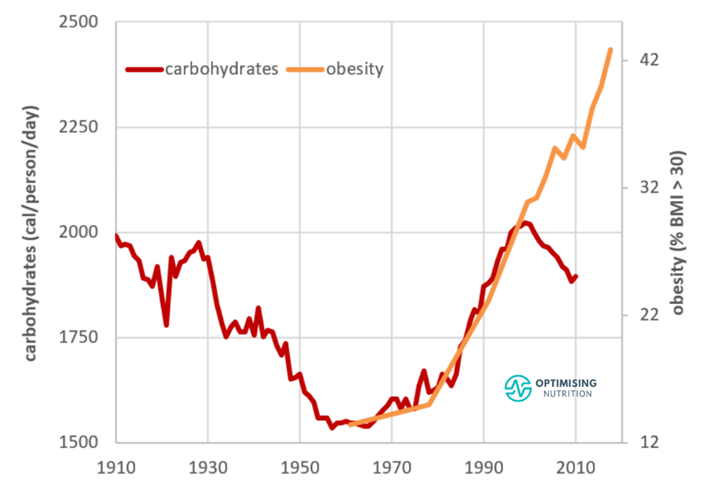
Based on data released from the United States Department of Agriculture (USDA) Economic Research Service, increasing obesity rates have more than coincided with our increased carb intake, at least up until the introduction of zero-calorie sweeteners in 1999.
While the AMDRs are based on how seemingly healthy people eat, these guidelines are not based on how humans ate in their natural food environment before the creation of ultra-processed foods.
While the AMDRs recommend consuming 45%–65% of calories from carbohydrates, the original paper does nothing to clarify the quality of these carbs. Are all carbs equal, or should we focus more on processed grains or whole ones? What about fruits? Vegetables?
Although we gained some clarity from the 2015-2020 Dietary Guideline for Americans and their MyPlate illustrations, the original publication gives no instructions, nor does it clarify the types of carbs those “healthy people” under observation were consuming.

From our satiety analysis, we know that the nutrient density of the food you’re eating—no matter the macronutrient content—has the most significant influence on the amount of calories you’ll eat.
Aside from quality, the AMDRs do nothing to elaborate on the quantity. There’s a vast range between 45% and 65% of total calories from carbs, and the original publication gives no detail on who might need more (or less) carbs.
Finally, and perhaps most concerningly, a recently published review found that 95% of the US Dept of Agriculture Dietary Guidelines Advisory Committee members had conflicts of interest.

All in all, the AMDRs seem to have a lot of flaws. After nearly twenty years of use, it might be time to update or retire these guidelines!
Lower Limit for Carbohydrates
All in all, the AMDRs appear to have a number of flaws. After nearly twenty years of use, it might be time to review and update these guidelines!
However, based on our analysis of the available data from our Optimisers, we believe IOM’s concern about excessive fat intake and energy density is valid.
Fat Intake
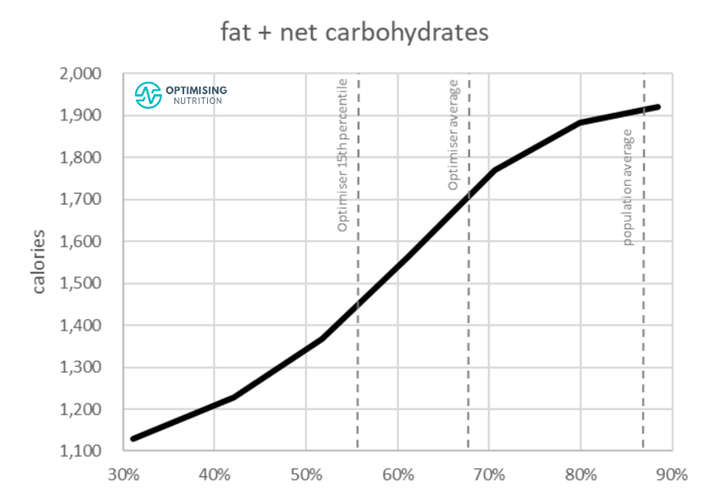
The following chart from our satiety analysis shows that a high-fat diet aligns with a greater calorie intake. We tend to eat more when our fat intake exceeds 40% of calories.
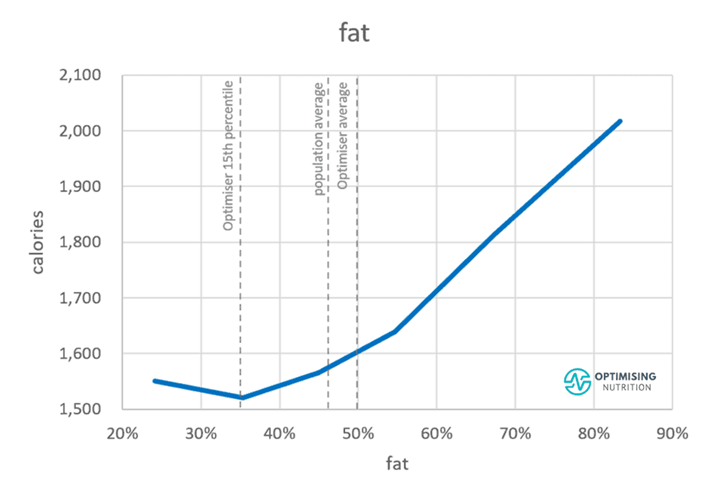
However, it’s worth noting that reducing energy from fat or carbs similarly influences energy intake. As the chart below shows, reducing carbohydrates from 45% to about 15% of total calories will have the same impact as reducing fat from 80% to 35%.

Energy Density
Our previous analysis also shows that a diet with a high energy density aligns with a higher energy intake.
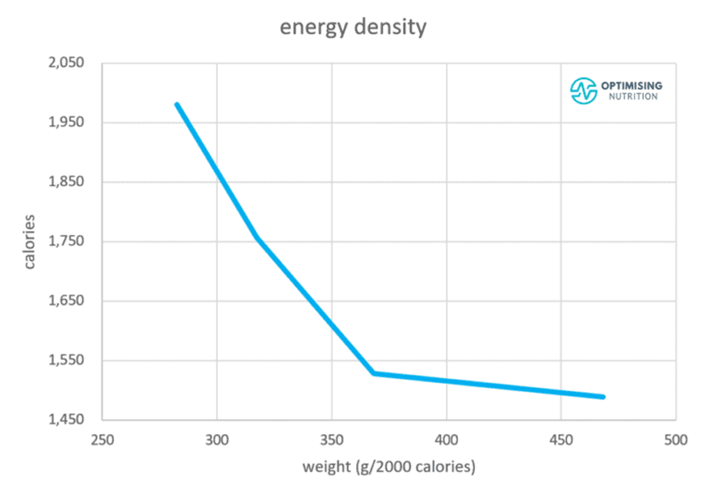
From this chart, we can deduce that we can eat fewer calories if we avoid unnecessary added dietary fat and decrease energy density.
That said, it’s important to note that energy density alone does not significantly impact how much we eat once we account for the effects of protein and fibre. In fact, prioritising energy density appears to negatively affect satiety once protein and fibre are taken into account. For more detail, see Low-Energy Density Foods and Recipes: Will They Help You Feel Full with Fewer Calories?
While the weight or volume of food may influence how much we can eat, in the short term, high-volume foods do not tend to keep us full over the longer term. For example, a big bottle of water or a whole head of lettuce may fill our stomachs immediately, but it won’t stop us from craving nutrients, protein, and energy before long.
Fibre
The type of carbohydrates consumed can significantly influence the energy density of someone’s diet.
For example, consuming a lot of refined grains and sugars can increase the energy density of a diet. In contrast, increasing our intake of non-starchy vegetables boosts our fibre intake and improves short-term satiation.
All carbs are not created equal. The chart below shows that a diet with more carbohydrates from fibre (up to 40%, or a 0.4 fiber:carb ratio) aligns with a lower overall calorie intake.

Interestingly, the people who consume a lower-carb diet achieve a higher fibre:carb ratio. This is represented as the red area to the left in the chart below of net carbs vs fat. In contrast, people on a higher-carb diet achieve a lower fibre:carb ratio, shown in the blue area to the right in the chart below.

What Is the Optimal Carbohydrate Intake?
We developed our optimal carbohydrate intake recommendations using our analysis of 125,761 days of food intake data that we’ve collected over the past four years from 34,519 Nutrient Optimiser users. These are people who have used Nutrient Optimiser to analyse the nutrient profile of their diet for a few days and Macros Masterclass and Micros Masterclass participants.
Satiety
As the chart below of carbohydrate % vs calorie intake shows:
- People consuming the least amount of energy eat between 10% and 20% of their calories from non-fibre carbohydrates.
- People who consume the most energy tend to eat around 45% of their energy as non-fibre carbohydrates (i.e., the lower end of the AMDR for carbohydrates).
- Towards the far right of the chart, we can see that people who can consume a very low-fat, high-carbohydrate diet (i.e., greater than 50% carbs) also tend to consume fewer calories. However, few people can maintain such a low-fat diet for long, and getting adequate protein on a low-fat, high-carb diet can also be challenging.
- Towards the far left of the chart, we see that zero-carb is not necessarily better than low-carb. This is likely due to an increased energy density and fat intake when non-starchy vegetables are eliminated.

Diet Quality
The following chart of non-fibre carbohydrates vs diet quality shows that people consuming 10% to 20% of their energy from non-fibre carbohydrates obtain more nutrients per calorie.
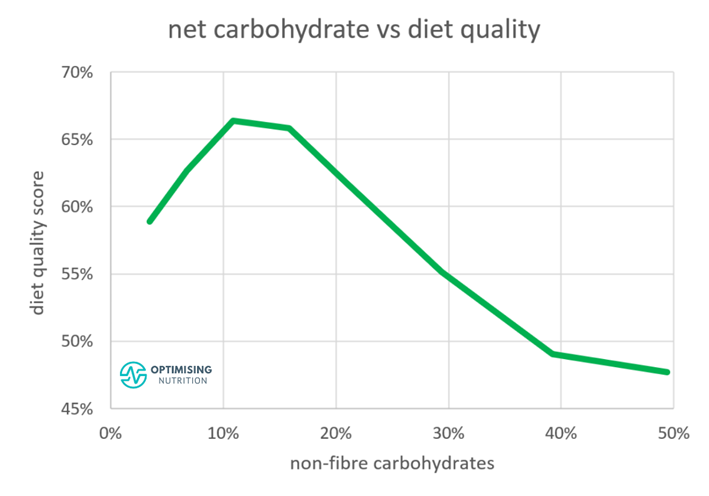
This optimal “sweet spot” for nutrient density aligns nicely with the lowest calorie intake and our nutrient leverage hypothesis. Similar to the protein leverage hypothesis, we are more satiated because we have the micronutrients our bodies require, and thus we eat less.
The Optimal Carbohydrate Intake
To summarise, the optimal non-fibre carbohydrate intake for satiety and nutrient density is between 10 and 20%. On the other extreme, people do tend to consume less energy with more than 50% carbohydrates.
However, nutrient density tends to be relatively poor. The danger zone of moderate (35% to 50%) non-fibre carbohydrates combined with fat aligns with the highest calorie intake.
To be clear, our optimal carbohydrate intake is not a one-size-fits-all prescription! Your ideal carbohydrate intake depends on your specific context and goals.
You may benefit from a greater carbohydrate intake if you are more active, lean, and have lower blood glucose levels. However, if you are sedentary, want to lose weight fast, or have high blood sugars, you may do better on a lower carbohydrate intake.
Moving toward this optimal target may be helpful if you want to increase your nutrient density to improve satiety, eat less without excessive willpower and hunger, and lose weight.
In our Macros Masterclass, we walk people through the process of identifying their current macronutrient intake and progressively dialling it in towards more optimal ratios that better align with their goals.
As a result, we see people obtain the best long-term success when they make progressive tweaks to their diet over time rather than quickly jumping to unsustainable extremes.
Do We NEED a Minimum of 130 Grams of Carbs?
Aside from recommending no less than 45% of total calories from carbohydrates, the Dietary Guidelines for Americans includes a minimum of 130 grams of carbohydrates per day.
This is based on the assumption that the brain needs a minimum of 130 grams of glucose per day. This minimum carbohydrate allowance also considers protein sparing. That is, if your carbohydrate intake is very low, your body will convert some of your protein to glucose.
Some of your organs do require glucose to operate, one of which being the brain. Red blood cells also require glucose to function. However, we do not have to consume glucose directly to get this minimum amount.
Our bodies are highly efficient, and we can convert protein and the glycerol backbone of fat into glucose via the process known as gluconeogenesis. Your brain and other organs can operate on ketones that your body produces from dietary fat or body fat when dietary carbohydrates are sparse.
So, if you’re consuming a minimal amount of carbohydrates, you may need to emphasise more protein to compensate for the amino acids lost to gluconeogenesis.
While many people, like the Inuit or people on a keto or carnivorous diet, appear to thrive on minimal carbohydrates, it’s worth noting that the optimal carbohydrate intake is not zero from a nutrient density or satiety perspective.
Non-starchy vegetables provide harder-to-find micronutrients that are sparse in meat and seafood.
Consuming a small amount of carbs also provides some glucose, which, as mentioned above, is protein sparing. This means you won’t need to consume as much protein to build and repair your muscles and organs.
How Much Carbohydrate Should I Eat?
For reference, the table below shows what 10% of non-fibre carbohydrates (i.e., the lower end of the optimal range) would look like in grams for 1000-, 1500-, and 2000-calorie diets vs 45% and 65% carbohydrates, or the upper and lower ends of the AMDR.
The lower end of the optimal range aligns with what many recommend for a very low-carb or ketogenic diet.
| Calories per day | 10% carbs | 45% carbs | 65% carbs |
| 1000 | 25 | 113 | 163 |
| 1500 | 38 | 169 | 244 |
| 2000 | 50 | 225 | 325 |
| 2500 | 63 | 281 | 406 |
| 3000 | 75 | 338 | 488 |
How Has Our Intake of Carbohydrates Changed Over Time?
The chart below was created using data from the USDA Economic Research Service. Here, we can see our carbohydrate intake dropped between 1910 and 1960 and increased up until 1999. Since then, surprisingly, it has fallen.

While it appeared that our carb intake aligned with the rise in obesity from 1960 to 2000, the trend has diverged since artificial sweeteners were introduced, which reduce the need for high-carb sweeteners like high-fructose corn syrup. Processed foods could use more vegetable oils with artificial sweeteners and flavourings to make them palatable.
In percentage terms, we see that our carbohydrate intake has decreased and fat has increased over the past century.

Our satiety analysis suggests that it’s not carbs or fats alone that should be feared, but rather the combination of the two in processed foods that leads to overeating. Fat-and-carb combo foods that mix sugar, starch, and fat are hyper-palatable for your tastebuds and lethal for your waistline.
As shown in the chart below, we tend to eat more when we consume less protein, fibre, and a similar combination of fat and carbs.
Ideal Carbohydrate Intakes for Different Goals
As noted earlier, the ‘optimal intake’ is not ideal for everyone! It’s crucial to consider your context and goals.
To determine the ideal carbohydrate intake for you, it’s important first to ensure you have an adequate foundation of protein and have started to hit your vitamin and mineral goals while remaining within your energy budget.
Once you’ve covered these bases, you can begin adding energy back in from fat, carbs, or a combination to fuel your activity.
The Difference Between Fat and Carbs
While carbohydrates and fats both contain energy as carbon-carbon bonds, they behave differently in our bodies.
Fat is a dense, slow-burning fuel that is easy to store. Meanwhile, carbohydrates are more volatile and harder to store in our bodies. For this reason, they’re better for explosive activity when required.
Athletes
Athletes expending a lot of energy require more carbohydrates and fat, a lower percentage of total calories from protein, and less fibre. While this may sound counterintuitive, this combination will allow them to eat more so they can fuel their intensive output.
Low-intensity, longer-duration activity can usually be fuelled by fat and some targeted carbohydrates to keep blood glucose from dropping too low.
While fat is a highly efficient source of energy and it produces nearly three times the amount of ATP that carbs do, fat takes more time to metabolise and is not ideal for explosive activity.
Thus, additional carbohydrates may be helpful for more intense exercise with a higher heart rate because they oxidise more quickly than fat.
Most recreational athletes don’t need to worry about adding extra carbohydrates for low-intensity activity shorter than an hour in duration. Refuelling with a hearty meal after exercise, or topping up with one a few hours before, is usually adequate for most people. Your appetite will likely guide you towards more carbohydrates to refill glycogen stores when needed.
While eating some carbs is good, more is not always better. You don’t want to start your workout with blood glucose levels much lower than normal for you. However, excessive carbohydrates can trigger rebound hypoglycaemia. This is where your blood glucose rises and then drops rapidly from the insulin response to a hefty dose of carbohydrates.
More energy from carbs and (or) fat are essential for athletes looking to build muscle, maintain it, and recover quickly. However, the same or similar macronutrient intakes would make a sedentary person consume excess energy and gain weight.
Hence, the percentage of your calories from carbs and fat depends on your activity. On the other hand, counterintuitively, the percentage of total calories from protein and fibre should increase if you are more sedentary.
Diabetes
To understand the best “diet” for diabetes, we must first understand the fundamentals of the condition. Contrary to popular belief, Type 2 diabetes does not arise from too much insulin. Instead, it results from too much energy backing up in the bloodstream. Thus, the actual root cause of the problem is energy toxicity. For more on this, see Keto Lie #8: Insulin Toxicity is Enemy #1.
So, it would make sense that someone would have to be able to unload this extra energy to reverse their diabetes! This requires long-term calorie restriction, which requires people to feel satiated enough to take on that challenge for long periods.
While some people approach weight loss with an extreme deprivation mindset or dabble with extended fasting, this often doesn’t work well in the long term. It’s critical to find an eating routine that provides enough of an energy deficit while still getting the nutrients that your body requires and craves.
To begin eating appropriately to offload that extra energy (rather than extended fasting), you would require more protein and fibre instead of fat and carbs. Due to their high nutrient density, fibre and protein are the most satiating macronutrients.
To stabilise blood sugars and supply the extra energy you need to fuel your daily life, you may consider initially adding in some fat to fill in additional energy requirements. Fatty foods have a lower insulin index and insulin load, allowing you to get off the blood sugar rollercoaster.
Reducing carbohydrates and adding fat to flat-line blood glucose levels is not your goal. We require some glucose variability to keep our metabolism going! However, reducing carbohydrates until blood glucose stabilises is a crucial first step in the satiety puzzle.
If your blood glucose levels rise by more than 30 mg/dL (1.6 mmol/L) after eating, your blood sugars will likely come crashing down before long, and you’ll find yourself on the prowl for energy-dense, nutrient-poor foods to raise your blood glucose levels.

Our satiety analysis shows that around 20% carbs, 40% protein, and 40% fat provide the most nutrients and highest satiety.
This macronutrient ratio is excellent for people with Type 2 diabetes, as it supplies them with the nutrients they need to feel full, so they can remain satiated and burn some of the extra energy they’ve stored.
However, mainstream dietary advice for people with diabetes, unfortunately, tends to align with the mainstream ADMRs.
Recently, more insulin-dependent people with diabetes use carbohydrate counting methods to match their insulin dosing to their carbohydrate intake.
While this is a step in the right direction, the reality is that it’s impossible to match the insulin dose to the carbohydrate intake accurately. Large inputs of carbs and insulin lead to significant errors in dosing.
Reducing carbohydrates enables people who inject insulin to achieve stable, healthy blood glucose levels because fuelling with more fat and less carbohydrate requires less insulin overall. The weight loss that often ensues also tends to improve insulin sensitivity and lower someone’s insulin requirement.
For more detail, see:
- The Real Reason You’re Insulin Resistant and The Macros to Reverse It
- The Insulin Load Theory: The Greatest Thing Since Carb Counting!
- Insulin Dosage Calculator for Type-1 Diabetes
In our Macros Masterclass and Data-Driven Fasting Challenges, we guide people through reducing their carbohydrate intake if their blood glucose rises by more than 30 mg/dL (1.6 mmol/L) after meals.
Since Type 2 diabetes is often related to obesity and excess fat, the next step after controlling blood glucose is to focus on reducing dietary fat so body fat can be used.
Weight Loss
If your goal is to lose weight, you need to prioritise adequate protein and nutrients from your diet while dialling back energy from carbohydrates and fat. In our Macros Masterclass, we guide Optimisers to identify their typical diet and progressively dial back their carb and fat limits until they lose weight at a sustainable rate of 0.5 to 1.0% per week.
Maintenance
People looking to maintain their weight also need to ensure they get the protein and nutrients their body requires.
From there, they can add in enough energy from fat or carbs to maintain their weight.
The specific mix of carbs and fat doesn’t matter as much, especially if their blood sugars are within a normal and healthy range.
Nutrient Density
To cap off our discussion, let’s look at how varying carbohydrate intakes influence micronutrient intake. Keep in mind that one of the stated goals of the Food and Nutrition Board of the Institute of Medicine with the AMDRs is to achieve adequate micronutrient intakes!
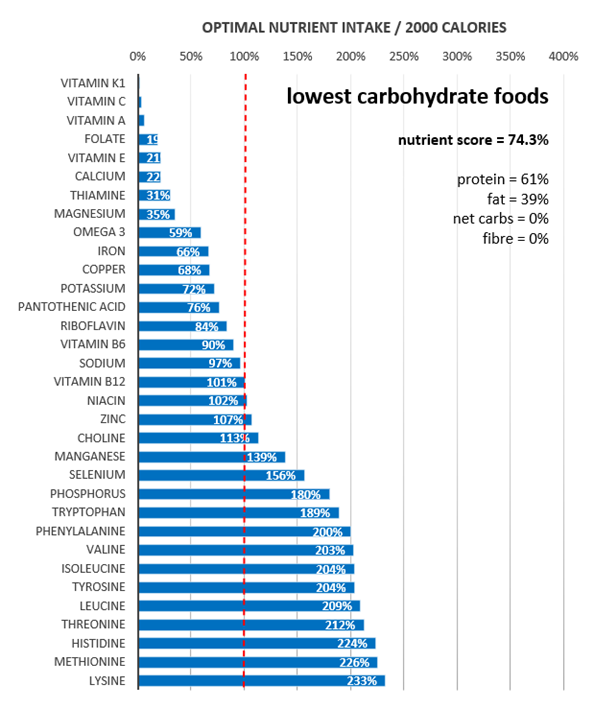
The following fingerprint chart shows the micronutrients and macronutrients provided by the lowest-carbohydrate foods. Most foods used to make this chart are high protein (average 61% protein), and they provide minimal amounts of vitamins like A, C, K1, and folate.
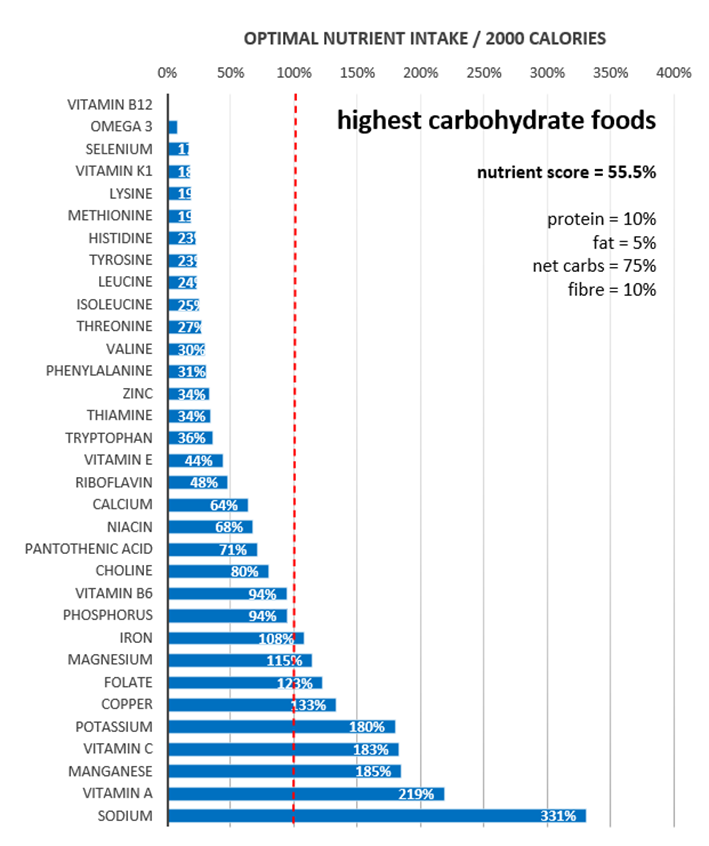
At the other extreme, the following fingerprint chart illustrates the nutrients found in the highest-carbohydrate foods (65% carbs). Unfortunately, this selection of foods is low in critical nutrients like vitamin B12, K1, omega-3 fatty acids, selenium, and all the amino acids.
Lastly, the following micronutrient fingerprint chart shows the nutrients provided when we focus on popular foods with a substantial nutrient density. Here, we see a much better micronutrient fingerprint overall.
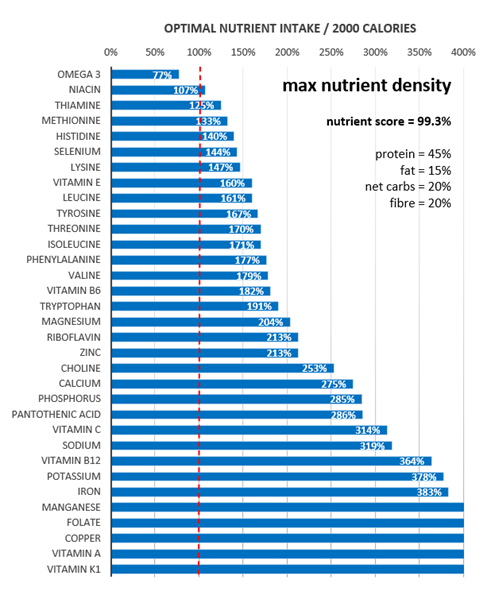
When you focus on micronutrients, the right macronutrient balance tends to look after itself. Once you have the foundation of protein and the other nutrients, you can add energy from carbs or fat based on your goals and preferences.
To find nutrient-dense foods and meals tailored to your goals and preferences, see:
- The Most Nutrient-Dense Foods – Tailored to Your Goals and Preferences
- Which NutriBooster Recipe Book Is Right for Me
- Nutrient-Dense Meals and Recipes
AMDR series
- Protein – Optimal vs Acceptable Macronutrient Distribution Range (AMDR)
- Carbohydrates – The Optimal vs Acceptable Macronutrient Distribution Range (AMDR)
- Fat – Optimal vs Acceptable Macronutrient Distribution Range (AMDR)
- The “Acceptable” Macronutrient Ranges (AMDRs) for Protein, Fat and Carbs: A Data-Driven Review
- Dietary Fibre: How Much Do You Need?
- Low Carb vs LowFat: What’s Best for Weight Loss, Satiety, Nutrient Density, and Long-Term Adherence?
- High Protein vs High Fat: What’s Ideal for YOU?