
The food insulin index is a powerful tool that can help you make better food and meal choices. It measures how much a food causes your blood insulin levels to rise.
Foods with a high insulin index cause a rapid spike in blood insulin, while foods with a low insulin index cause a gradual rise.
Why is this important?
Insulin is a hormone that helps your body absorb glucose from the bloodstream. When your blood insulin levels are too high, it can lead to a number of health problems, including weight gain, type 2 diabetes, and heart disease.
The food insulin index can help you in a number of ways:
- Stabilize your blood sugar levels: Eating foods with a low insulin index helps to keep your blood sugar levels stable, which can improve your energy levels, mood, and overall health.
- Lose weight: Eating a diet rich in low-insulin-index foods can help you lose weight or maintain a healthy weight.
- Manage diabetes: For people with diabetes, the food insulin index can help them improve the accuracy of their insulin dosing calculations.
While the food insulin index is a valuable tool, it’s important to consider other factors when making food choices, such as satiety and nutrient density.
This article will show you how to use the food insulin index to tailor your food and meal choices to your individual goals and get the desired results.
BONUS: FREE Video Lecture “Making sense of the food insulin index”
- What Is the Food Insulin Index?
- Who Developed the Food Insulin Index?
- How Do You Calculate the Insulin Index of Food?
- Is the Food Insulin Index Important?
- Limitations of the Food Insulin Index
- What Makes a Food High on the Insulin Index?
- Low vs High-Insulin-Index Foods
- Low vs High Insulin Index Recipes
- What Is a Good Insulin Index Score?
- How Can I Use the Food Insulin Index to Dose Insulin Accurately?
- Summary
- More
What Is the Food Insulin Index?
The food insulin index is a measure of how much a particular food or meal raises insulin in the two hours after eating.
- Foods with a high-insulin index are typically high in refined carbohydrates like white bread, sugary drinks, and processed snacks that are absorbed quickly by the body.
- Conversely, foods with a low-insulin index tend to be higher in fat and don’t increase insulin significantly over the short term.
- Meanwhile, the food insulin index data shows that high-protein foods raise insulin about half as much as carbohydrates over the first two hours.
Who Developed the Food Insulin Index?
The food insulin index was developed by Dr Susanne Holt, Professor Jenny Brand-Miller, and Professor Peter Petros of the University of Sydney in Australia.
They researched the relationship between diet and insulin resistance, a significant risk factor for developing Type-2 Diabetes.
Their 1997 paper, An insulin index of foods: the insulin demand generated by 1000-kJ portions of common foods, detailed the concept and insulin responses to various common foods.
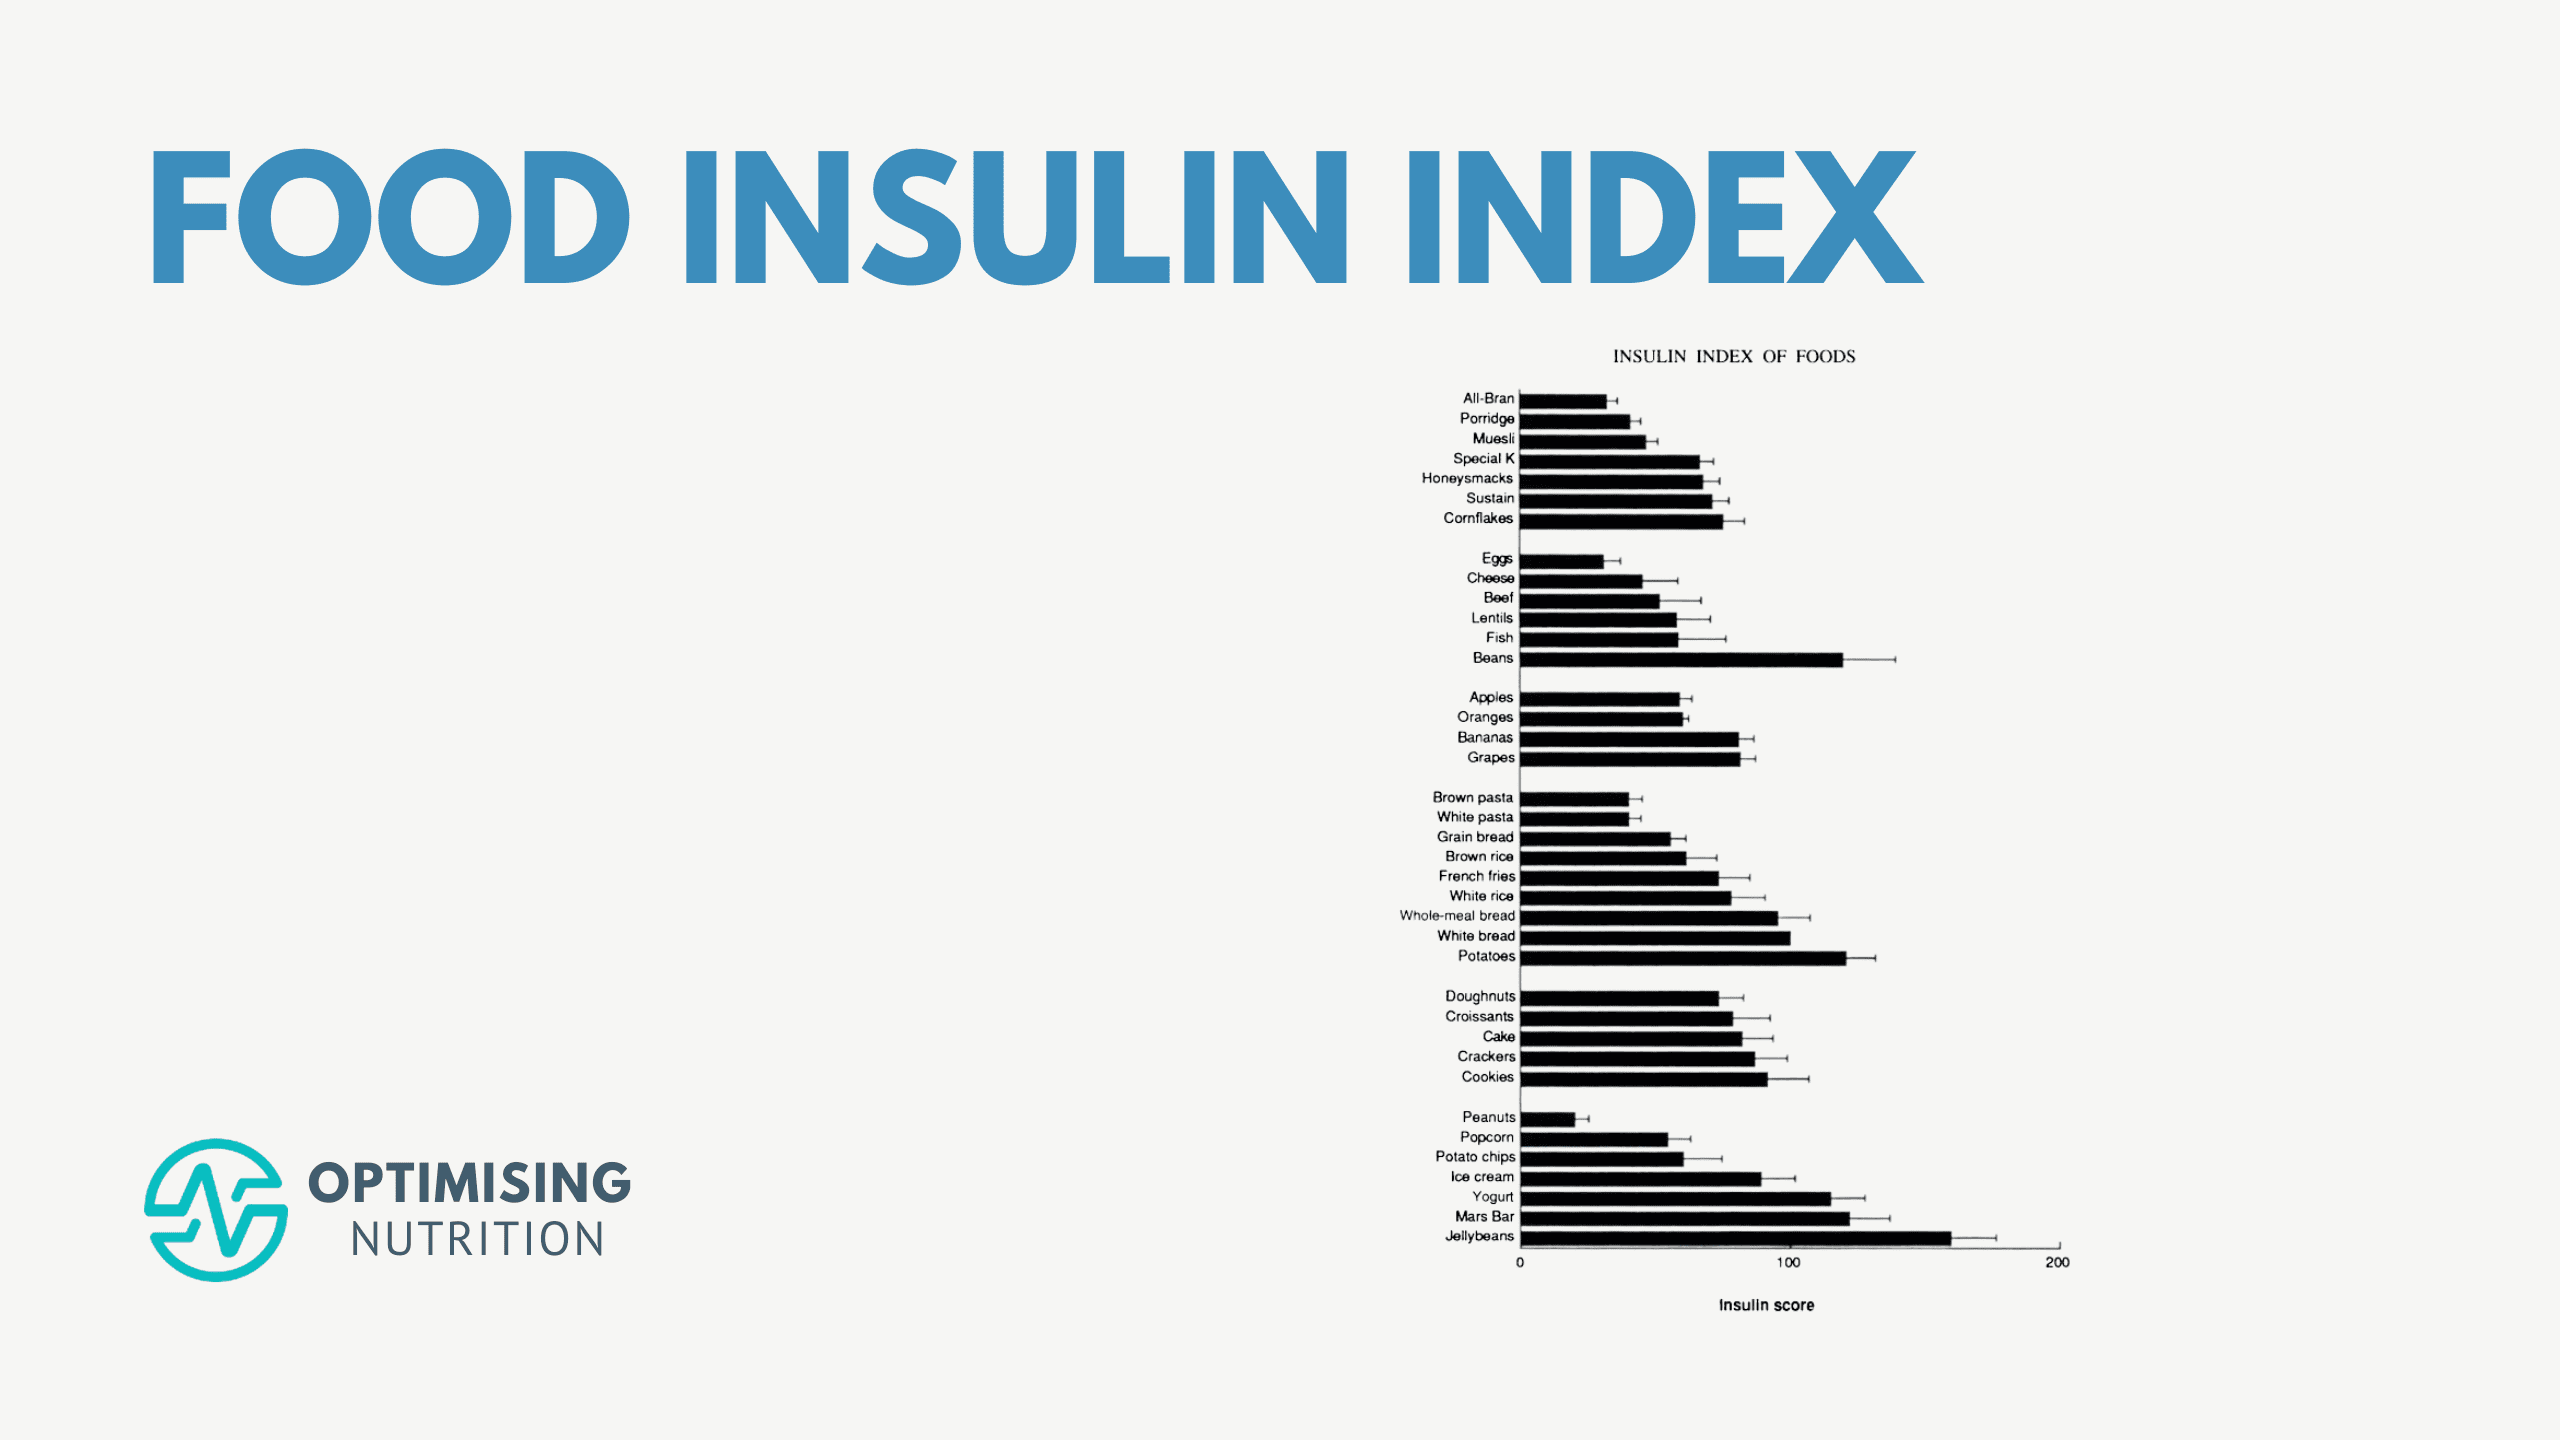
The chart below shows the insulin index values of the 38 foods tested. Here, researchers fed participants 1000 kJ (239 cal) portions of popular foods and their blood insulin responses were measured.

Foods with the highest insulin index scores from the original study included jellybeans, Mars Bars, potatoes and beans. Meanwhile, peanuts and eggs had the lowest insulin index scores.
For a printable version of the food insulin index chart, you can download the original paper here.
How Do You Calculate the Insulin Index of Food?
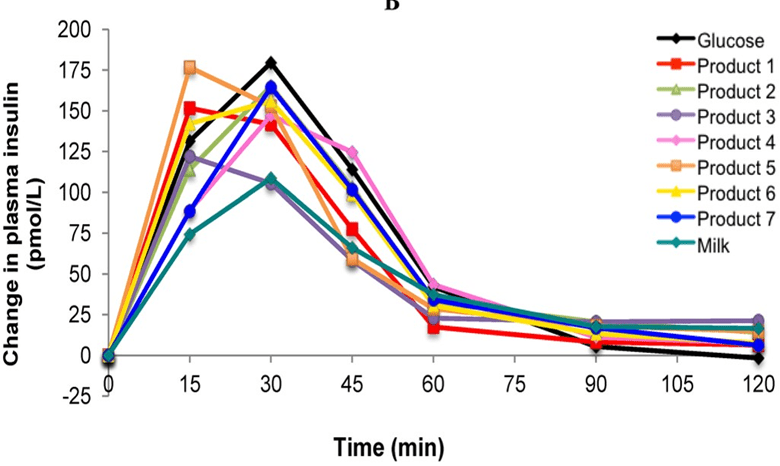
To determine a food’s insulin index score, researchers measured the change in insulin levels two hours after eating. The area under the insulin response curve was then calculated for each food. Pure glucose was given a score of 100, so any food with a food index score of less than 100 elicited a smaller insulin response than glucose (and vice versa).
Notice in the figure below how insulin levels peak quickly after eating pure glucose (black line) and then return to baseline at two hours. In contrast, insulin levels rise slowly for higher-fat foods like milk (aqua line) but remain elevated at two hours.
Is the Food Insulin Index Important?
I initially became interested in the food insulin index to help my wife Monica control her Type-1 Diabetes. The effect of accurately dosing for protein and avoiding food that required the most insulin was dramatic. She stabilised her blood glucose, reduced many adverse symptoms related to her diabetes, increased her energy levels, lost weight, and halved her daily insulin requirements!
The chart below shows her daily insulin dosing since she started using an insulin pump in 2008. Notice how her daily insulin dose dropped from 50 to 25 units per day in early 2011 when we transitioned to a lower-carb diet. That’s a 50% drop!
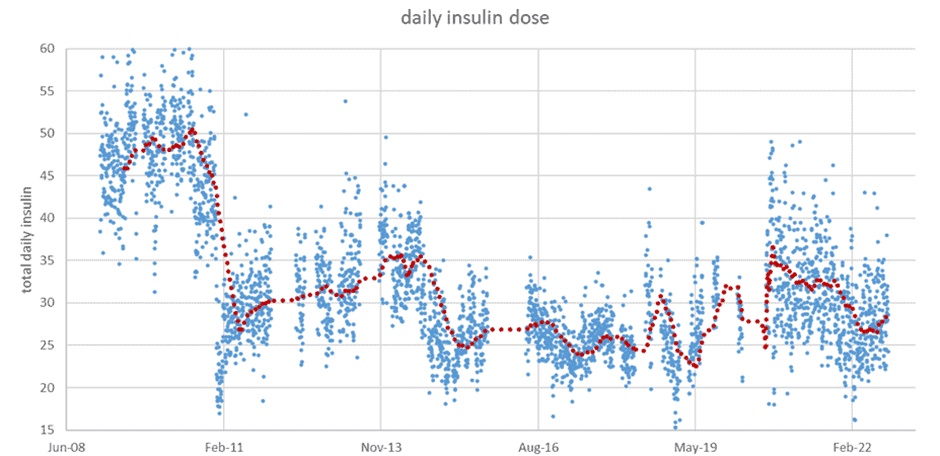
She reduced her bolus insulin requirements—or the insulin she requires at mealtimes—because her food choices improved. However, her basal insulin also dropped due to the weight she lost, as you can see from the photos of us below.

Many people have used the food insulin index to optimise their blood glucose management and insulin requirements. Other people following a keto diet have used it to identify more ketogenic foods.
However, I’ve since learned that the food insulin index can be counterproductive when taken to extremes (e.g. limiting protein because it has a short-term insulin response). As you will see, the food insulin index is not the only thing we need to consider.
Limitations of the Food Insulin Index
Before we get into the detailed food lists and charts, we should highlight several limitations of the food insulin index.
Testing Timeframe
When trying to make sense of the food insulin index data, it’s critical to remember that the food insulin index tests were only undertaken over the first two hours after a meal.
Thus, the two-hour test captures the insulin response to refined carbohydrates. However, it does not measure the complete response to protein and fat, which are metabolised over a longer timeframe.
Unfortunately, we don’t know much about the longer-term insulin response to our food because no studies (to date) have looked at it. The two-hour tests from the food insulin index are the best we have.
However, a recent study on people with Type-1 Diabetes showed that dietary fat initially lowered blood glucose in the short term when insulin wasn’t administered. Still, greater fat intake caused a significant increase in blood glucose three to eight hours after consumption.
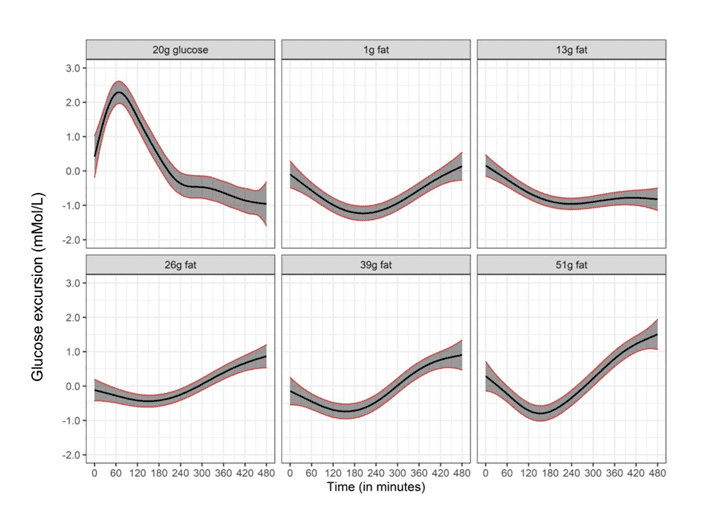
So, dietary fat appears to elicit a smaller yet still significant insulin response over a longer timeframe.
It Only Shows the Change in Insulin Levels
When trying to make sense of the food insulin index, it’s important to note that the tests measured the change in blood insulin levels after food (i.e., bolus insulin).
An underappreciated fact is that your pancreas still produces insulin to keep your energy reserves locked in storage even when you’re not eating. This is known as basal insulin.
If your body didn’t produce basal insulin, your body would effectively disintegrate, and all the fat, protein, and glucose in your body would flow into your bloodstream, similar to a person with uncontrolled Type-1 Diabetes. So, while insulin is often viewed as an anabolic hormone, most of the time, insulin works as an anti-catabolic hormone to prevent your body from plunging into uncontrolled catabolism.
For most people, most of their daily insulin is basal insulin. We know from people with Type 1 Diabetes that basal insulin makes up about half the daily insulin requirements for people on a typical Western diet. However, for people on a lower-carb diet, 70 to 80% of their daily insulin requirement is basal insulin and not related to food.
Simply eating high-fat foods with a lower insulin index will not turn off your pancreas. Reducing basal insulin requires weight loss, which requires higher-satiety foods and meals. For more on this, see:
- Insulin is NOT Making You Fat (and Here’s Why)
- What Does Insulin Do in Your Body?
- High-Satiety Index Foods: Which Ones Will Keep You Full with Fewer Calories?
Limited Dataset
The 1997 Food Insulin Index study only tested 38 foods, so applying the data to other foods and meals is difficult.
Fortunately, the food insulin index database has been expanded since the original study and now contains over one hundred foods. Dr Kirstine Bell’s 2014 thesis, Clinical Application of the Food Insulin Index to Diabetes Mellitus, expanded the Food Insulin Index database, which now contains 147 foods. You can view the complete updated Food Insulin Index database in Appendix 3 of the thesis here.
The chart below plots the data in terms of carbohydrates (%) vs food insulin index.
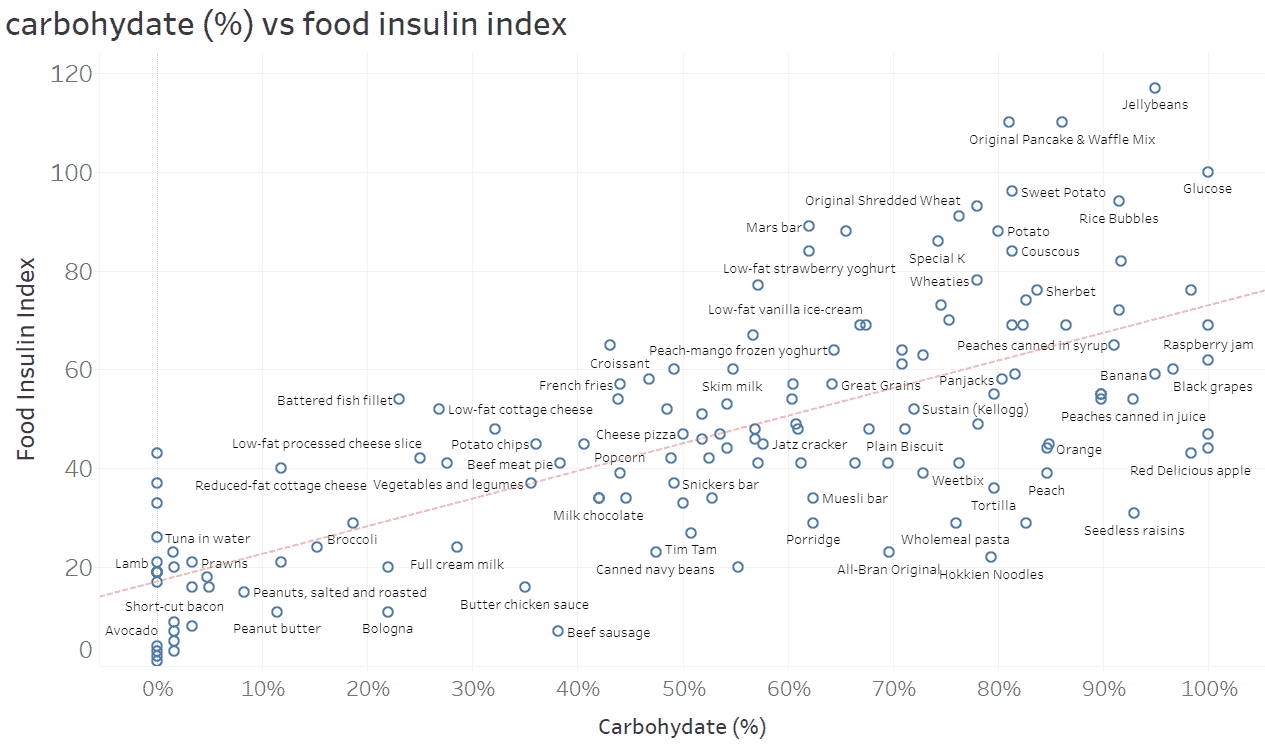
You can dive into all the data in the interactive Tableau version of this chart here. It’s best viewed on your computer screen, not your phone. You can mouse over each of the points to see more data.
Overall, we can see that while carbohydrates correlate with the food insulin index, there is a lot of scatter. Carbohydrates are clearly not the only factor at play.
- Towards the right, we can see that fruits (like peaches, raisins, and oranges) tend to sit below the trend line. This is because fructose (the form of sugar found in fruit) tends to be converted to fat in the liver and thus doesn’t raise insulin or glucose as much.
- Towards the left, we can see that the foods with the lowest insulin index are high-fat foods (like butter and olive oil).
- However, we can also see that low-carb, high-protein foods (like white fish, tuna and steak) have a significant insulin response).
What Makes a Food High on the Insulin Index?
While 147 foods is an improvement from the original 38 foods in the original study, it’s still hard to make much sense of such a limited dataset and apply it to other foods and meals.
So I ran a multivariate regression analysis on the 147 data points, which showed:
- Carbohydrates raise insulin the most;
- Protein raises insulin about half as much as carbohydrates (46%) over the first two hours;
- The fibre in food reduces the insulin impact of carbohydrates (by 78%); and
- Fat raises insulin by 15% as much as carbohydrates over the first two hours after eating.
Low vs High-Insulin-Index Foods
The regression coefficients from the multivariate analysis of the food insulin index data have allowed us to predict the two-hour insulin response to any food or meal.
Net Carbs vs Food Insulin Index vs Satiety Index
To demonstrate, the chart below shows the net carbohydrates vs food insulin index. The colouring is based on our satiety index score. Foods in green provide more satiety per calorie, whereas foods in red tend to be much easier to overeat.
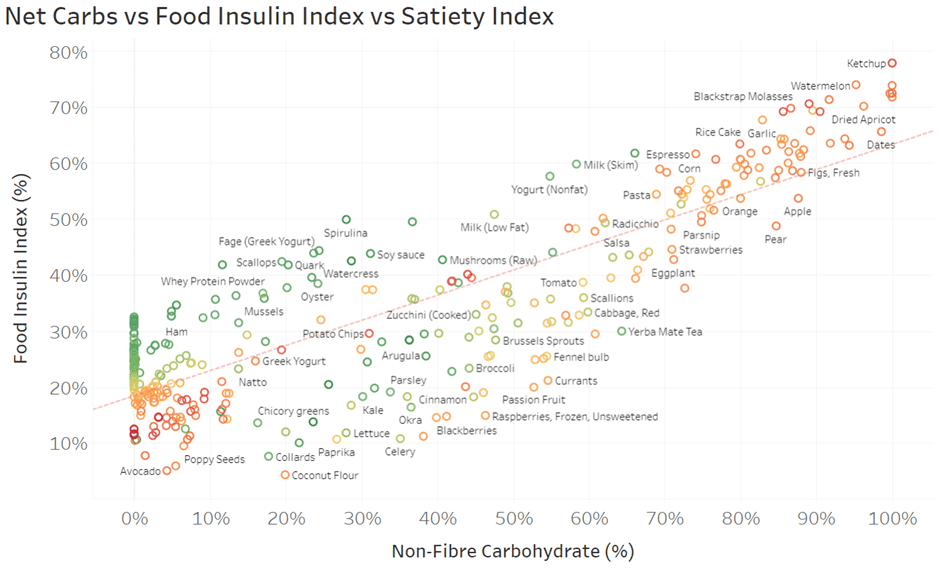
Again, you can dive into the detail in the interactive Tabluea version of this chart here. Make sure you hover your mouse over each food to see all the details.
In the top right of the chart, we can see how high-carb foods like rice, dates, and watermelon elicit the most significant food insulin index responses. However, things get more interesting when we look in the bottom left corner.
- Some foods like butter, olive oil and pork fat have the least amount of carbs and the lowest food insulin index. However, they also have meagre satiety index scores.
- Meanwhile, some low-carb, high-protein foods like turkey breast, tuna and cod that elicit a moderate insulin response have a very high satiety score.
So, what does this mean in practice?
While reducing carbohydrates is a great way to reduce your insulin response to food and stabilise your blood glucose, it’s crucial not to avoid high-satiety, high-protein foods just because they elicit an insulin response, particularly if weight loss is a goal.
Food Insulin Index vs Nutrient Density vs Satiety Index
To illustrate further, the chart below compares the food insulin index vs nutrient density (per serving). Again, the colouring is based on our Satiety Index Score. Notice how most nutritious foods have a moderate insulin response (e.g., 20 to 35% food insulin index).

Again, you can dive into the detail in the interactive Tableau version here.
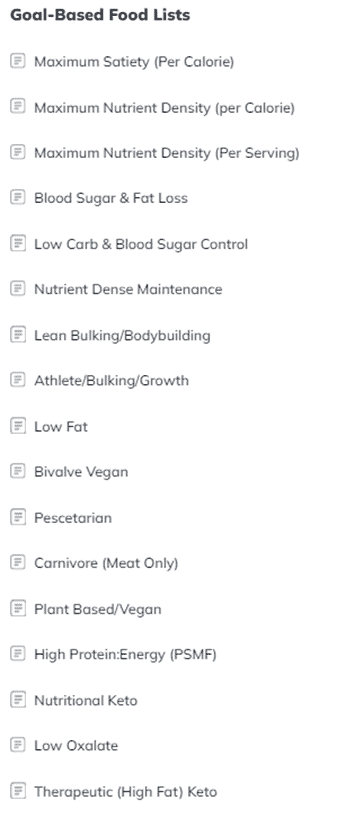
In addition to these charts, we have prepared a range of simple printable food lists tailored to a range of goals using the food insulin index as one of the ranking factors, along with satiety and nutrient density.
Low vs High Insulin Index Recipes
While it’s easy to look at the insulin index data of one food, we usually don’t eat things solo. Instead, we combine them into meals and recipes.
To help you identify recipes with a lower food insulin index, the chart below shows our 1000+ NutriBooster recipes regarding food insulin index vs Diet Quality Score. Again, the colouring is based on our Satiety Index Score.
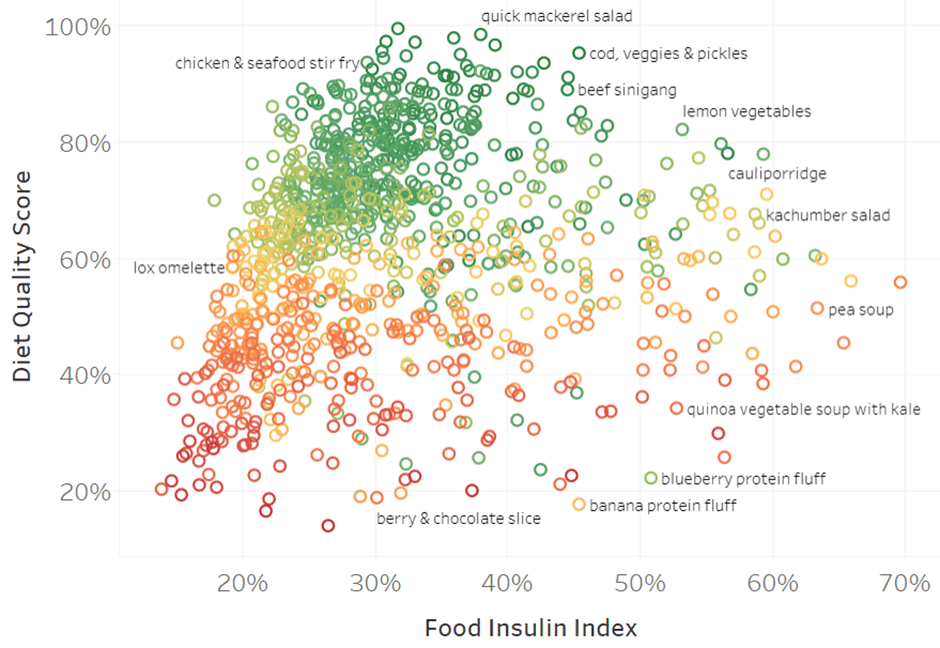
There’s a lot of data, so it will be best to dive into the detail in the interactive Tableau version here.
The critical thing to note is that the recipes with the greatest nutrient density scores and satiety responses tend to have lower—but not very low—food insulin index scores. In contrast, the recipes in the bottom left have considerably low food insulin index and nutrient density scores.
You can learn more about our suite of NutriBooster recipe books here. If you’re already part of our Optimising Nutrition community, you can download samples of each NutriBooster recipe book here.
What Is a Good Insulin Index Score?
If you’re insulin resistant and your blood glucose rises by more than 30 mg/dL (1.6 mmol/L) after eating, choosing foods with a lower food insulin index score can be beneficial.
Large rises in glucose tend to lead to crashes a few hours later that lead to increased hunger and overeating. For more on this, see our article on reactive hypoglycemia here.
However, you don’t need to push below 40% as it will force you to exclude many nutrient-dense, high-satiety foods.
If you require therapeutic ketosis and elevated ketones to manage a condition like epilepsy, dementia, Parkinson’s, or major depression, you may benefit from choosing foods with an even lower insulin index. However, you should be mindful that these foods and meals aren’t as satiating, so they are not ideal if fat loss is a goal.
How Can I Use the Food Insulin Index to Dose Insulin Accurately?
Despite its limitations, the food insulin index data is particularly helpful for people with diabetes who need to inject insulin. Accurately dosing insulin for carbohydrates and protein allows them to achieve better blood glucose control.
Unfortunately, the insulin requirement for protein is often overlooked because the amount people eating a higher-carb diet require is smaller than the insulin needed for carbohydrates.
However, following a lower-carbohydrate diet will likely push you to consume more protein. Hence, accurately calculating the insulin required for protein becomes more critical as it will make up most of your bolus insulin requirement.
Carbohydrate
Per usual practice, the insulin required for carbohydrates is calculated by multiplying net carbohydrates by the insulin:carb ratio (ICR). This is covered with a bolus dose of rapid-acting insulin.
Protein
As noted above, protein requires about half as much insulin as carbohydrates per gram over the first two hours. To calculate your insulin for protein, take the grams of protein in the meal, multiply it by the ICR and divide by two.
Rather than administering this as a bolus of rapid-acting insulin, many people on multiple daily insulin doses (i.e., insulin pens) use R-insulin, which works over a more extended period than rapid-acting insulin. This tends to match the protein digestion profile, which requires insulin over around five hours.
Alternatively, people using an insulin pump often use the ‘extended bolus’ (e.g. on Medtronic Pumps) or a ‘slowly absorbed meal’ (e.g. on CamAPS).
Fat
Because the response is more gradual, most people don’t dose insulin for dietary fat. Instead, the insulin is often covered by their basal insulin.
If you use a closed-loop artificial pancreas system, the algorithm will respond by increasing your basal insulin requirements to cover the dietary fat you consume. However, you may need to reduce your basal insulin if you are fasting.
For more tips on managing insulin-dependent diabetes, see How to Optimise Type-1 Diabetes Management (Without Losing Your Mind).
Summary
- The food insulin index measures the average insulin responses to a list of foods.
- Non-fibre carbohydrates spike insulin the most. Meanwhile, protein increases insulin to rise about half as much as carbs in the first two hours following a meal. Fat has a smaller response over a longer timeframe.
- Understanding how our bodies respond to food allows us to dose insulin and select foods that stabilise blood glucose more accurately.
- A diet with a very low food insulin index may be appropriate if you require therapeutic ketosis. However, these foods tend to sacrifice nutrient density, which is critical for satiety. Thus, a moderate insulin index diet will be more appropriate for most people as it provides for greater satiety and nutrient density.
More
- The Most Satiating Foods to Crush Your Hunger Efficiently
- What Foods Raise Your Blood Sugar and Insulin Levels?
- Does Protein Spike Insulin (and Does It Matter)?
- Insulin is NOT Making You Fat (and Here’s Why)
- The Carb-Insulin Hypothesis vs Protein Leverage Hypothesis of Obesity
- Navigating Your Personal Fat Threshold: A Guide to Weight Management and Metabolic Wellness
- Keto Lie #8: Insulin Toxicity is Enemy #1
- What Does Insulin Do in Your Body?
But the foods which cause the least insulin secretion, according to the above graph, are low carb. So, “independent of calories or carbohydrates” seems a little misleading.
I had the same question Alec. But if you read the actual thesis and the associated papers you’ll see that they actually kept the calories and carbohydrates consistent. They weren’t really testing a low carb approach. The only variable was the insulin index of the foods. In effect they would have been choosing foods with more fibre and less protein. A much better improvement would be achieved by adopting a low insulin load approach. Hopefully they can repeat a similar study in the future with this approach.
Has anyone yet come up with an
Insulin Index that tested isolated
foods? I haven’t found one. It’s
prohibitive to test insulin on one’s
own, since the testing process is
expensive and not universally
available.
Yes. That’s basically what the university of Sydney did in the work referenced in this post.
Marty:
No “reply” button on your last post.
Are you referring to the 38 “foods”
that they tested? “Jellybeans” are
food? “Mars Bars”, “donuts” “ice cream”
“Cake”? Well, okay if they say so.
Why not some real food? Tallow? Butter?
Nuts? Not on the list. “Fish”? What
kind of fish? There are many kinds
of marine foods. Do they all fall under
the heading “fish”? Are all meats “beef”?
The paper was behind a paywall. Maybe
it’s all explained there.
I’m talking about an insulin test for isolated
foods. This one isn’t it.
The consolidated insulin index testing is in this doc. https://ses.library.usyd.edu.au/bitstream/2123/11945/2/Bell_KJ_thesis_2.pdf
Still no “reply” button.
Thanks for that.
Great information ! I would have liked to see “lite” or skim milk included. The Swedish “Keyhole marking” requires less than 0.7% fat and in my opinion it is a pure early disease and widow maker! A 12 year study of 1600 men showed that those with lowest intake of milk fat compared to those with most high fat dairy had 3x = 300% higher incidence of central obesity = lots higher risk for diabetes, heart disease and risk for death of all causes. The study is here: http://www.ncbi.nlm.nih.gov/pmc/articles/PMC3656401/
As also well known, skim milk was used to fatten pigs when pig fat was more important than lean pork. It would not surprise me if skim milk was also given to geese with grain to speed up fois gras. But for now its insulin index is most interesting!
Hi Sten
I have listed 1% skim milk in this article at 64% insulinogenic compared to full cream milk which is 40% insulinogenic – https://optimisingnutrition.wordpress.com/2015/03/23/most-ketogenic-diet-foods/
You can run your own numbers using this calculator too if you wnated to http://www.burnfatnotsugar.com/calc/
Cheers
Marty
Thanks for reply!
Full cream milk comes out at insulin index 25% from the diagram in your “The most ketogenic foods”. What am I missing to arrive at 40% ?
One more thing to address is probably the carbohydrate fructose as has a very low insulin response but produces liver fat and leads to insulin resistance in a different pathway than through (over-) exposure to insulin. It may deserve an exclusion and a special goodbye? Is it one reason raisins are coming out good in the insulinogenic index, its 28% fructose? Looking forward to your analysis!
Maybe you have fattier milk than we do.
The 40% in the list is based on the USDA food database.
I just ran the numbers using the full cream milk that we have in the fridge (4.4g fat, 3.2g protein and 4.6g carbs) and I get 36.1% insulinogenic calories.
Here’s the link to the calculator… http://www.burnfatnotsugar.com/calc/
That’s a really good observation about fructose meaning that the insulin response is very low. I will have to look into that in more detail.
what are the dots without labels?
See https://public.tableau.com/profile/publish/foodinsulinindexanalysis/insulinloadvsFII#!/publish-confirm
Ah, very cool. Thank you for sharing!
Found it interesting that in the study, the Australian version of Kellogg’s Special K has an FII of 48, while the U.S. version has an FII of 86. And there’s not much difference in the macros. Be interesting to find out why such a huge difference.
Hey Marty
Excellent information.
One major premise of a low carb diet is that carbs increases insulin.
So instead of looking at how many carbs foods contain, and draw a correlation, its even better to look simply at how much insulin foods raises.
Your table list of foods is particularly useful to diabetics.
p.s. low fat yogurt could be renamed high insulin yogurt.
Yup.
Thanks Marty,
Do you have list the new Food Insulin Demand (FID) not the Food Insulin Index (FII) ? Which Do you think the most accurate to determine insulin shots? GI, GL, FII, FID, or Carb content?
Thanks
It seems FID is effectively insulin load which I think is more useful to track.
Do you have a youtube channel? What’s more important to maintain healthy insulin level? Insulinogenic or Insulin load?
Here’s a link to the videos that I have been involved in… https://www.google.com.au/search?q=marty+kendall&rlz=1CDGOYI_enAU590AU590&hl=en-GB&prmd=inv&source=lnms&tbm=vid&sa=X&ved=0ahUKEwjE9r3OxYjSAhXGipQKHd1qBzwQ_AUICSgD&biw=375&bih=591
Hi Marty, have been on a low carb, high fat diet now for 4 weeks, but am flying by the seat of my pants re insulin dosing. I’ve printed out the superfoods table, but have no idea how to translate this info into insulin requirements. Also,blackberries seem the only fruit on the list, unless I’m missing something. Can you clarify?
This article on insulin dosing may be useful. https://optimisingnutrition.com/2015/08/10/insulin-dosing-options-for-type-1-diabetes/
Unfortunately fruit doesn’t typically do too well in terms of nutrient density or insulin load. 🙁
Hai Marty, I have read Bell Thesis 1,page 214, how to count FID of the white bread of 26 (1 slice white bread has FII of 73 and contains 310 kj so 73 times 310/1000 is 22.63)? FID, Food Insulin Demand. (FID = FII x kJ in food portion /1000) scaled using the FID and carbohydrate content of 1000 kJ of glucose powder (100/59)).
How do substances that trigger insulin, but which don’t contain any calories, factor in? How do you calculate the insulin load of an artificial sweetener like Aspartame that has an insulin response? Is there a way?
From The book Brain Maker: David Perlmutter.
“We used to think that sugar substitutes like saccharin, sucralose, and aspartame didn’t have a metabolic impact because they don’t raise insulin, it turns out that they can indeed wreak tremendous metabolic havoc and cause the same metabolic disorders as real sugar. How so? They do this by changing the microbiome in ways that favor dysbiosis, blood sugar imbalances, and an overall unhealthy metabolism. And yes, the food and beverage industry has a splitting headache over this latest study, which was published in 2014 in the journal Nature.
https://www.nature.com/news/sugar-substitutes-linked-to-obesity-1.15938
Just forget Coke’s Zero. It is like drugs. Always side effects.
The research out of Israel and Stanford on personalised diets and gut micro biome see eran Segal’s ted talk one published research should help one size does not fit all.
Eric
Hi
Okay, I’m sorry if I sound stupid but I’m not getting it. According to the graphs withe pasta has a lower insulin response than beef. But that goes against everything everybody is saying. What am I missing? Why does it matter how far to the right the foods are on the x-axis? Surley the insulin response (y-axis) is the more important factor, which would mean all the foods towards the bottom of the graph are the ones to dig into. I’m completely confused. Can somebody please explain? I’d really appreciate it.
Isabella
Thank you so much for sharing this post ! =D
It was really helpful
I notice that most insulin indexes were done based on the 1000 Kj standard, it may startle people to think for example Potatoes which has 121 insulin index value is so much worse than brown pasta which has 40 insulin index value
However when we do compare the actual caloric value per 100g for potatoes and brown pasta , we get 77 calories for potato and 242 calories for brown pasta
Hence if we calculate to estimate the amount we need to eat in order to achieve 100 insulin index, potatoes and brown pasta is actually about the same with Potatoes being slightly ahead of brown pasta
256.52g of Potatoes needed to activate 100 insulin while
246.90g of Brown pasta is needed to activate 100 insulin
so technically that means we can eat more potatoes before we reach the same level of insulin as brown pasta
In my opinion, using this food weight per 100 insulin interpretation may be a more practical way of comparing food quality types for different foods
I have taken the liberty to extrapolate a table of the foods for the purpose of comparison here https://docs.google.com/spreadsheets/d/13VPPFQpsCryqwu9MQ-Lo1f24PxxfVN4Jo0JQAv22d5g/edit#gid=0
I also written more on longevity here today https://www.facebook.com/notes/eugene-leong/the-problem-of-health-the-key-to-living/10155929180121084/
Any feedback please feel free let me know =D
Thank you so much everyone !
God bless
There are certainly pros and cons of using cals vs grams, but in the end I’ve chosen calories as most people need to eat about the same amount of calories per day to maintain their body weight.
In the second graph is Special K so special because it is both low insulinemic and high insulinemic at the same time much like a quantum particle? Data with brand names is dubious at best.
Is FII and controlling insulin load good for reactive hypoglycemia? Mine is non-diabetic. I spike then crash but my A1C is actually low.
I’m 73, female and following LCHF most of my adult life (since 1972). My age group is largely ignored in all the research being done. The Science of ketogenesis and it’s long-term effects on health and mobility in postmenopausal women could use a bit of interest. We’re pretty much left to swing in the wind when attempting to refine our macros. Today I utilized your Nutrient Optimizer for the first time in hopes that I can stabilize my intake and output.
That’s awesome!!!
Thanks Marty – a very interesting article. I have yet to explore the interactive graphs properly – a really novel approach that you have developed to cover a lot of data.
Jason Fung in his comments “ Insulin Index- Hormonal Obesity XX111” says that 23% of the variability of insulin response depends on glucose – and that taking into consideration the other macronutrients only accounts for a further 10%. The vast majority of the insulin response is still unknown” he says. I find this quite extraordinary.
I think I first heard about the Food Insulin Index from that lecture of Jason’s. It got me intrigued and I went digging.
This has been one of the most popular articles on the blog over the years. I now found the time to go back and update it to incorporate some of my more recent learnings about insulin.
Basically, protein is a factor, but all food raises your bolus insulin. If you want to attack basal insulin (which makes up the majority of your insulin production, especially if carbs are already low) you need to prioritise protein for greater satiety. It’s not simple or intuitive, but important.