
Embark on a journey into the realm of nutrient density, a cornerstone for flourishing health.
This extensive guide elucidates nutrient density, unveils a meticulous nutrient density chart, and offers insightful tactics to harness the full spectrum of essential nutrients.
By understanding what nutrient density truly means and how to optimize it, you’re unlocking a pathway toward a robust and vibrant life.
- Why Is Nutrient Density Important?
- How To Measure Nutrient Density
- The Most Nutrient-Dense Foods (Per Serving)
- The Most Nutrient-Dense Foods (Per Calorie)
- Which Nutrients Do You Need to Prioritise?
- Can I Get Too Much of a Nutrient?
- The Optimal Nutrient Intakes
- How Do We Calculate Nutrient Density?
- Limitations of Other Approaches
- Will Nutrient Density Help Me Lose Weight?
- Why Can’t I Just Take a Supplement?
- What About Bioavailability?
- Are Carbs or Fat More Nutrient Dense?
- Nutrient Dense Recipes
- How to Increase Your Nutrient Density
Why Is Nutrient Density Important?
Nutrient-dense foods and meals empower you to get all the micronutrients you need while staying within your daily energy budget. This has numerous benefits, including:
- Health: Consuming foods rich in essential nutrients help you maintain good health, prevent chronic diseases, and support your immune system.
- Weight Loss: Eating nutrient-dense foods can help you feel fuller for longer, reduce cravings, and help control energy intake, which can lead to weight loss.
- Energy Levels: Nutrient-dense foods contain the nutrients that your mitochondria need to function optimally and use the energy from the carbs and fat, leading to sustained energy levels throughout the day.
- Nutrient Deficiencies: Consuming a diet that lacks essential nutrients can lead to various health problems and deficiencies, including anaemia, osteoporosis, and impaired immune function.
- Longevity: Consuming a nutrient-dense diet can help maintain good health and reduce the risk of chronic diseases, leading to a longer and healthier life.
How To Measure Nutrient Density
We have developed two approaches to measuring nutrient density. Each can be useful depending on your goal and context.
Nutrients Per Calorie
The simplest way to measure nutrient density is nutrients per calorie.
Foods with more nutrients per calorie pack in nutrients with very few calories. These are ideal to pack in more nutrients with as few calories as possible.
While this sounds great at first, we typically consume the most nutrient-dense foods per calorie in tiny quantities, so you may not be able to get enough nutrients from these foods alone.
Our analysis of more than half a million food entries from Optimisers found that the average serving size of the most nutrient-dense non-starchy green veggies (e.g., spinach, bok choy, watercress, chard and kale) is only 20 calories! Some people also experience gut distress when they try to increase their intake of these foods rapidly.
So, you’re unlikely to get the nutrients you need from only these foods, let alone enough energy or protein. Instead of trying to live on the most nutrient-dense foods, you can think of these foods as the icing on the cake once you’ve built the foundation of Nutritional Optimisation.
Nutrients Per Serving
After guiding thousands of Optimisers to dial in their nutrient density, we found it’s usually more helpful to start by thinking in terms of nutrient density per serving.
Once you build the foundation of your diet with nutritious foods that also provide enough energy and protein, you can fill in your nutrient gaps with foods that provide more nutrients per calorie.
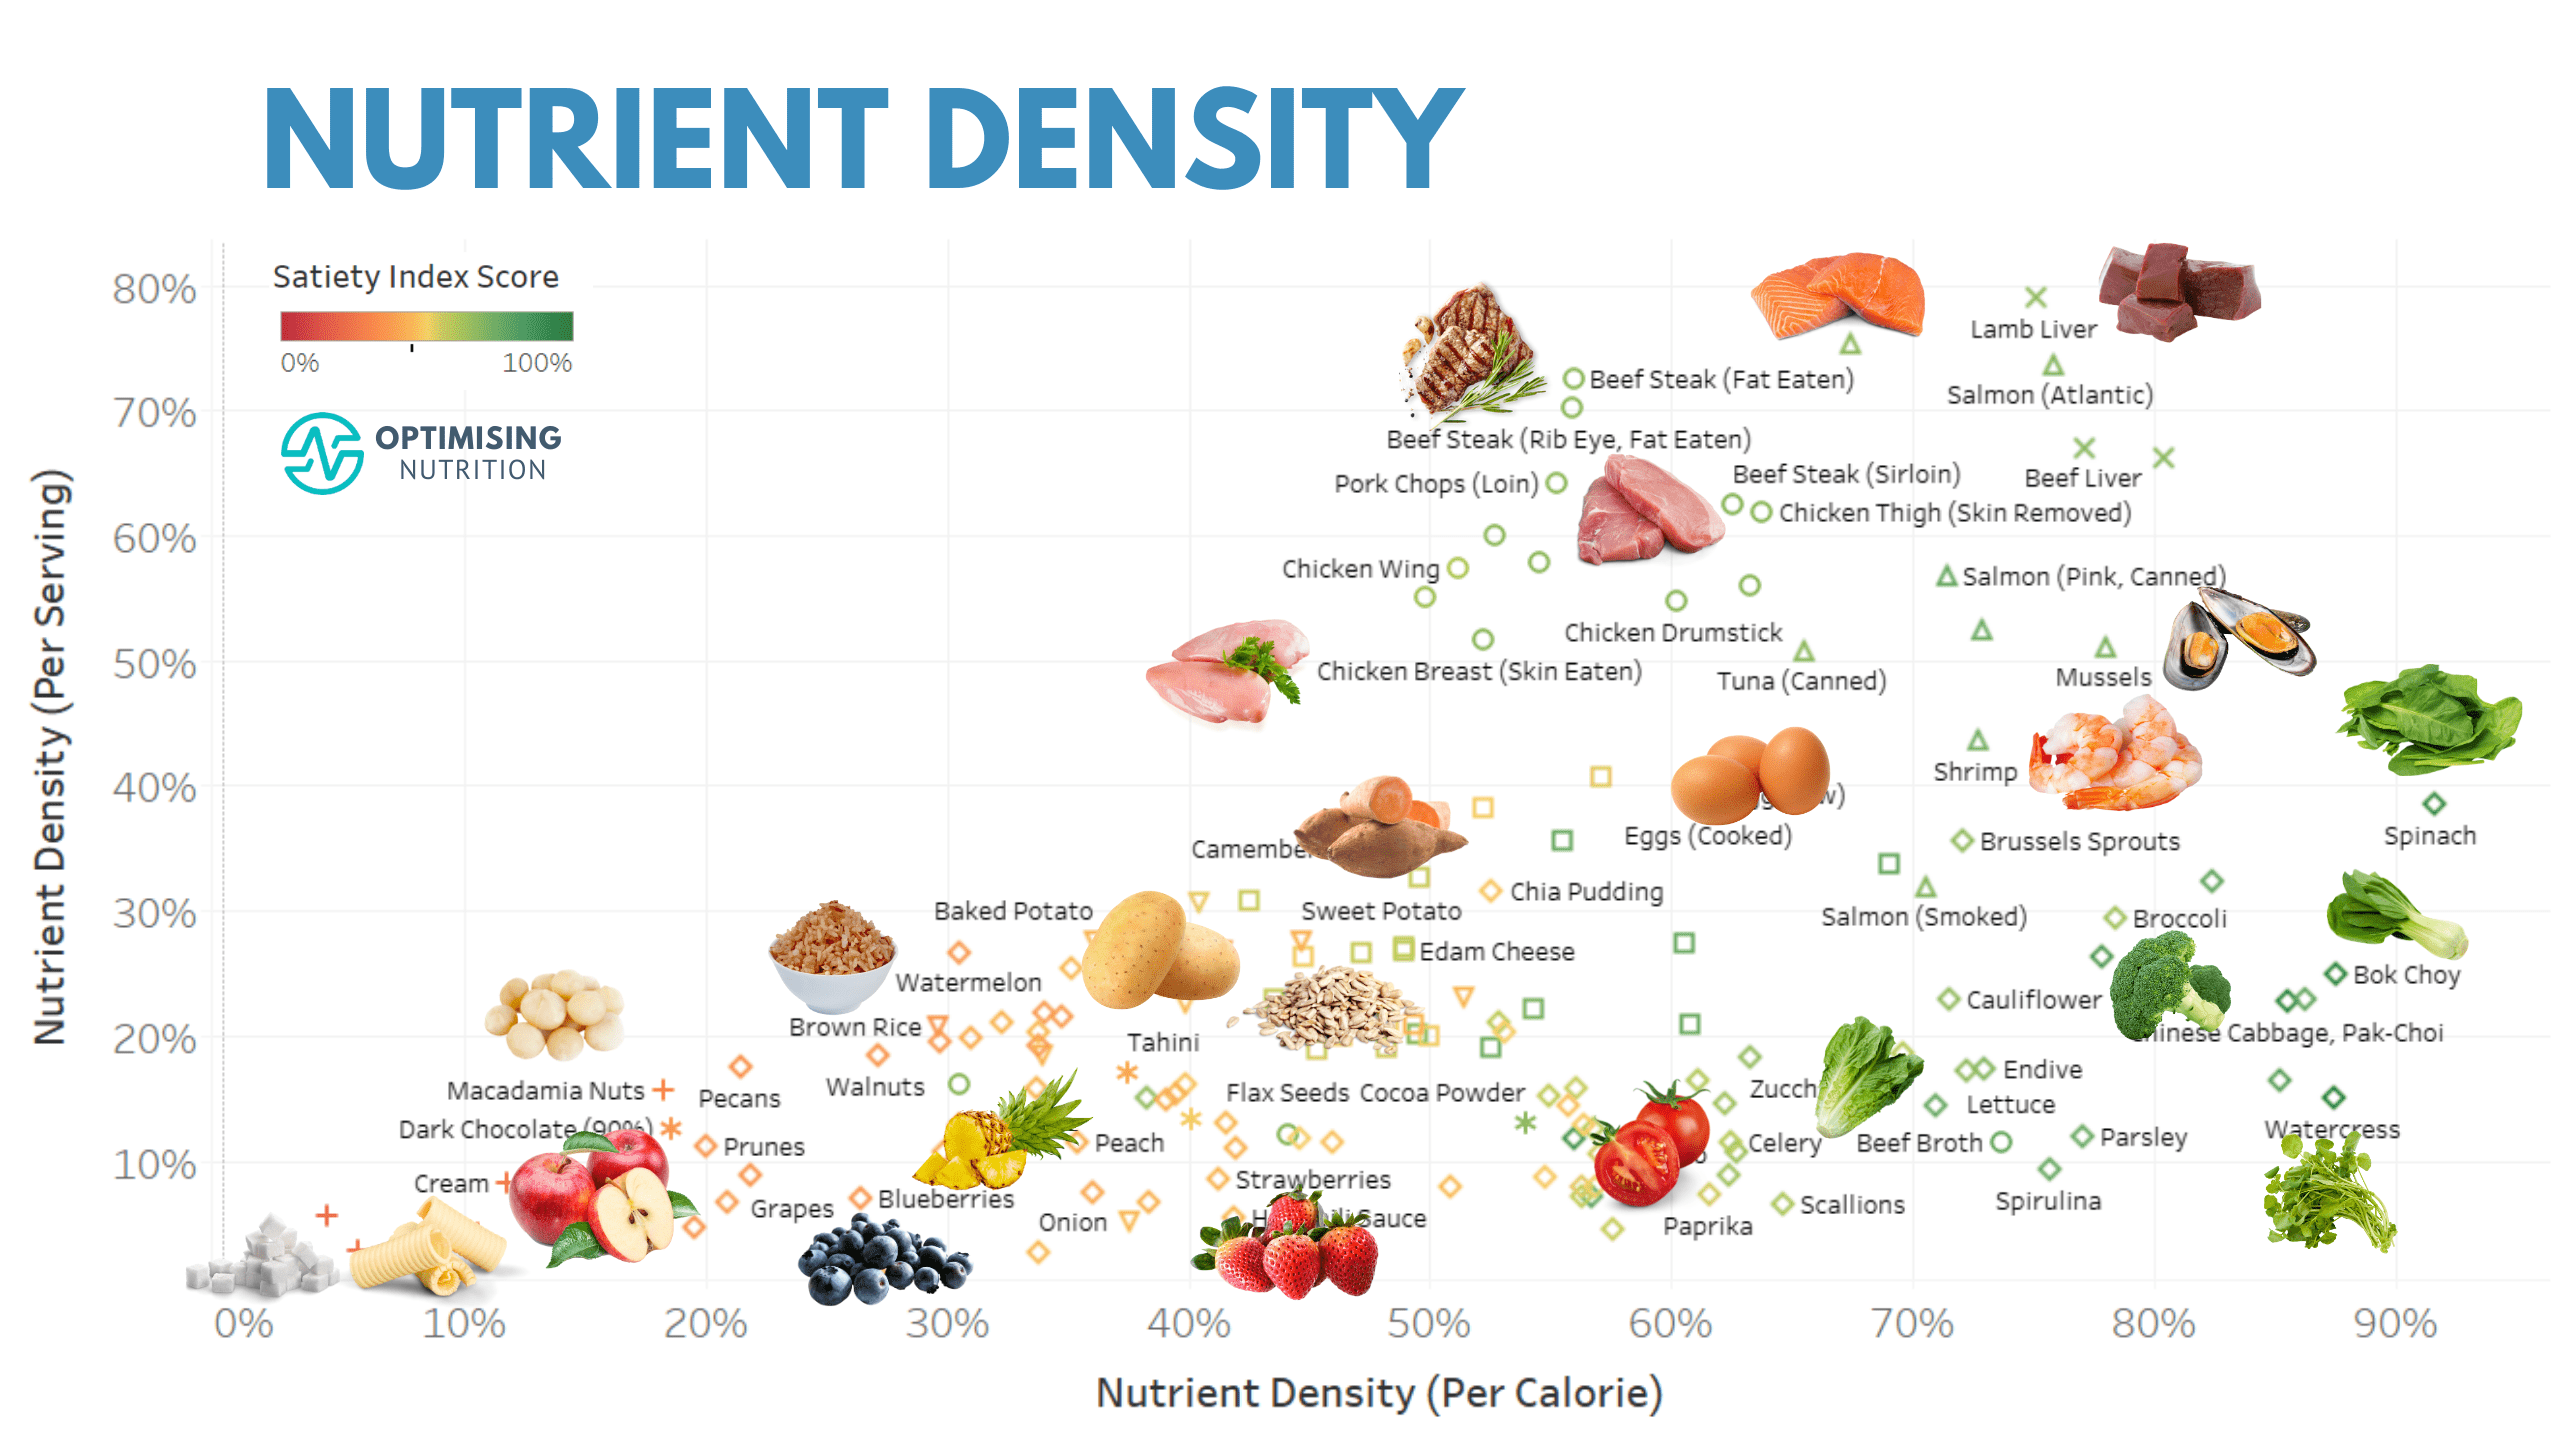
Nutrient Density (Per Calorie) vs. Nutrient Density (Per Serving)
To illustrate, the chart below shows nutrient density (per calorie) vs. nutrient density (per serving). The colouring is based on our Satiety Index Score.
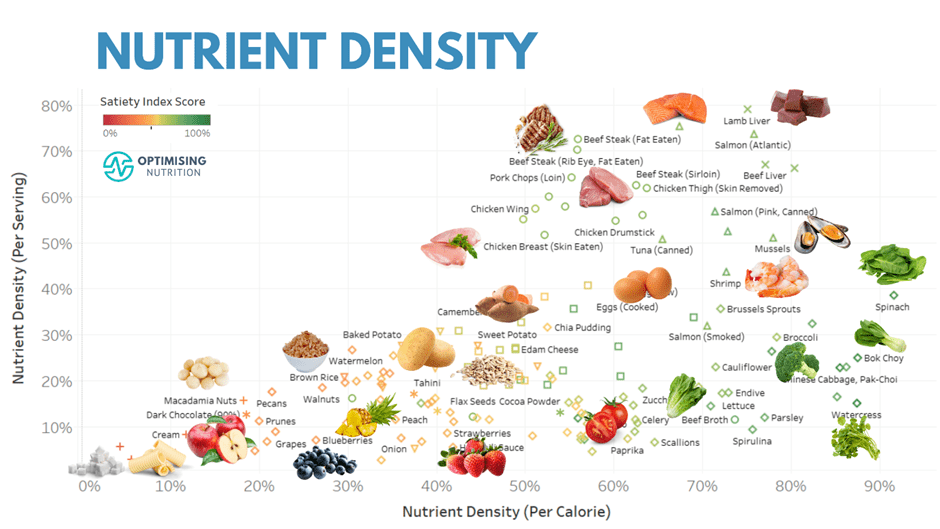
Foods towards the right of this chart provide a lot of nutrients per calorie. Meanwhile, foods towards the top of this chart provide more nutrients per serving. So, to dial up your nutrient density, add food towards the top of this chart. Later, you can add more foods toward the right to fill any remaining nutrient gaps.
If you’re eager, you can dive into the interactive Tableau version of this chart (on your computer).
The lists below show popular foods that provide more nutrients per serving and per calorie. You can also download longer lists and view the interactive charts for each nutrient in our Optimising Nutrition Community space.
The Most Nutrient-Dense Foods (Per Serving)
The foods listed below will provide more nutrients in the typical serving sizes that we eat them.
Animal
- liver
- pork chops
- steak
- chicken breast
- ground beef
- eggs
Seafood
- salmon
- mackerel
- mussels
- tuna
- shrimp
Plants
- spinach
- brussels sprouts
- chard
- broccoli
- sweet potato
- potato
- kale
- avocado
The Most Nutrient-Dense Foods (Per Calorie)
These foods will provide more nutrients per calorie.
Plants
- spinach
- bok choy
- watercress
- asparagus
- kimchi
- chard
- kale
- broccoli
- endive
- lettuce
- brussels sprouts
- cauliflower
- mushrooms
- green beans
Animal
- liver
- beef steak
- chicken thigh (skin removed)
- chicken drumstick (skin removed)
- egg (whole)
Seafood
- mussels
- salmon
- mackerel
- shrimp
- tuna
Which Nutrients Do You Need to Prioritise?
The primary goal of the Dietary Guidelines is to help people choose foods that meet the Dietary Reference Intakes (DRIs) and Adequate Intakes (AIs) for essential nutrients.
Prioritising nutrient density is like working from first principles without the commercial and ideological conflicts of interest that all too often plague nutrition. Rather than avoiding all the ‘bad things’ in food, you simply work to ensure you are giving your body everything it needs to thrive.
Sadly, very few people get the nutrients they need from their food. An NHANES survey of 16,444 people in the US found:
- 100% don’t meet the DRI for potassium,
- 94% don’t meet the DRI for vitamin D,
- 89% of people don’t meet the DRI for magnesium,
- 44% don’t meet the DRI for calcium,
- 43% don’t meet the DRI for vitamin A, and
- 39% don’t meet the DRI for vitamin C.
According to the World Health Organisation, iron is the most common nutrient deficiency worldwide, particularly in poorer countries, due to limited access to animal-based foods.
While you could do an expensive test to identify nutrient deficiencies, the easiest and cheapest way to identify which nutrients you need to prioritise is to track your food for a few days in Cronometer. Once you identify your priority nutrients, you can add more foods and meals that provide more of your priority nutrients.
The charts below show examples of foods that provide more nutrients that many struggle to get enough of (i.e. iron, potassium, magnesium, calcium, vitamin A and vitamin C).
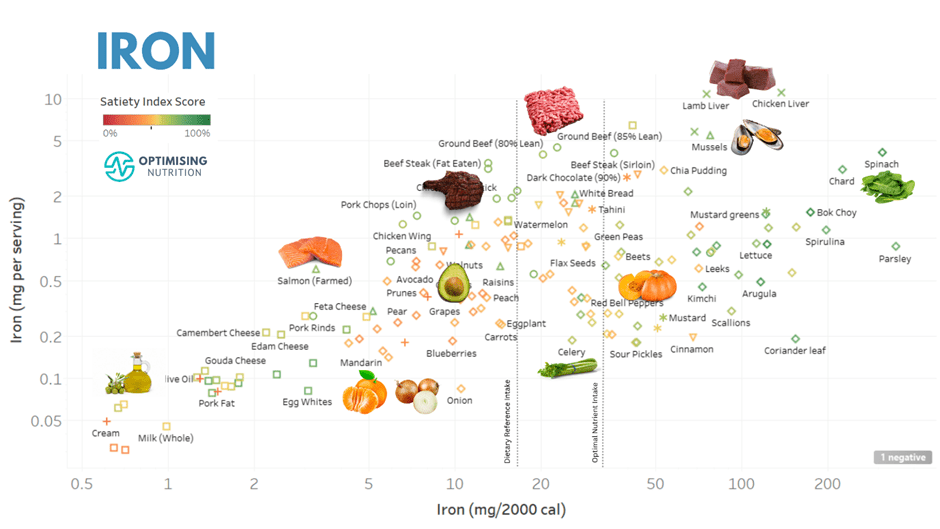
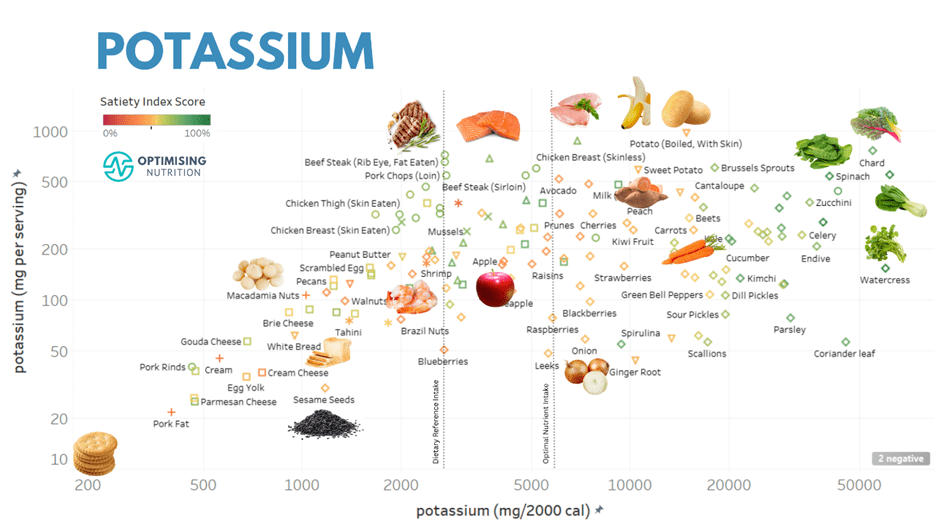

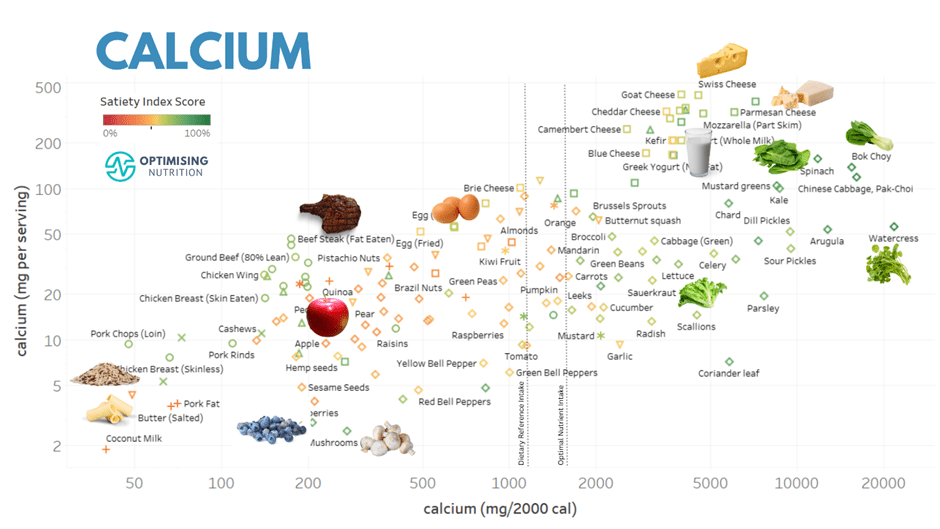
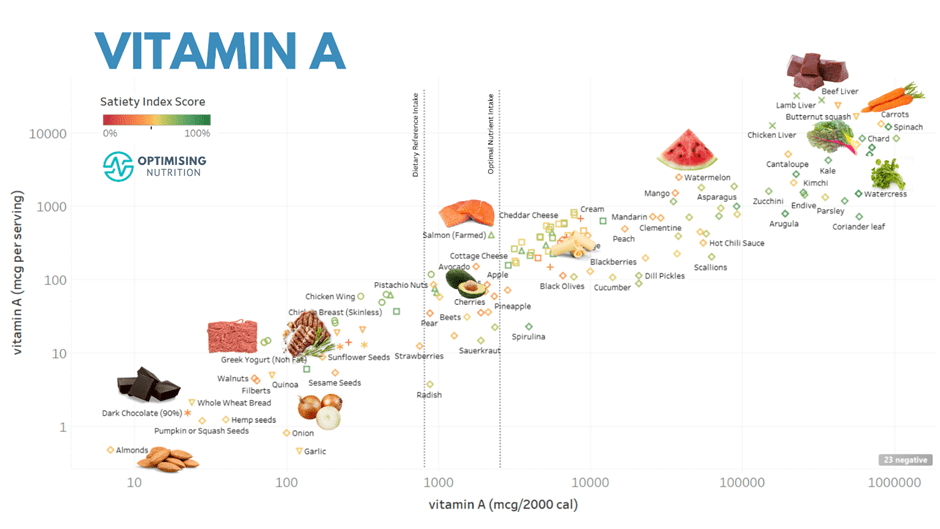
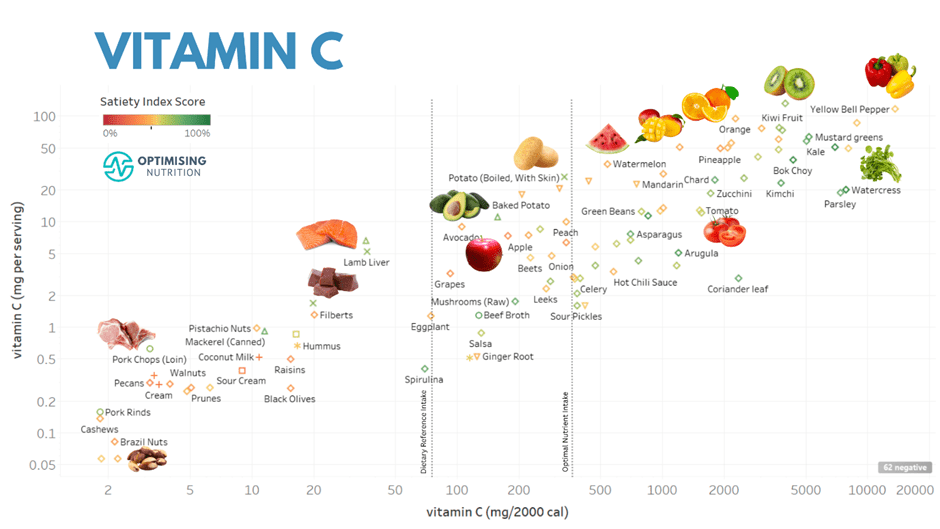
You can find detailed food lists and interactive charts for all the essential nutrients in our Optimising Nutrition Community.
Rather than a single nutrient, most people find they have a cluster of nutrients that they need to prioritise. Once you have a few days of food tracking, you can take our free Nutrient Clarity Challenge to identify a shortlist of foods and meals that contain more of your priority nutrients.
Can I Get Too Much of a Nutrient?
Along with the Dietary Reference Intakes (DRIs), Estimated Average Requirements (EAR) and Adequate Intake (AIs), a Tolerable Upper Intake Level (UL) has been set for some nutrients. The UL is the maximum amount you can safely take without risking overdose or side effects.
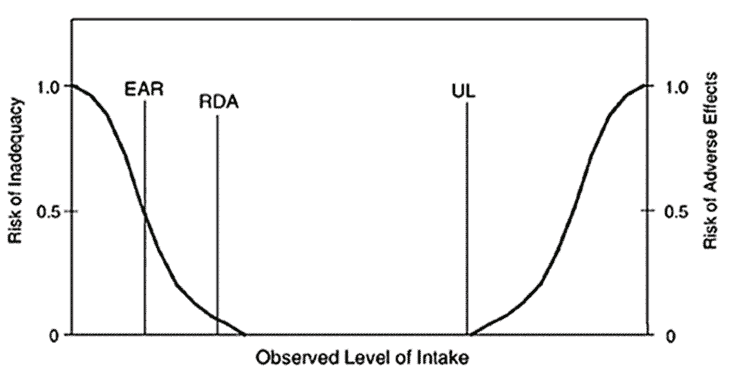
It’s hard to get excessive intakes of any of the nutrients from food, particularly if you focus on getting more of your priority nutrients. So, the Upper Limits are only a concern if you take supplements.
The Optimal Nutrient Intakes
If you look closely at the food charts above, you might have noticed a line showing the Dietary Reference Intake (lefthand side) and our Optimal Nutrient Intakes (ONIs) (toward the right).
We have set the ONIs as a stretch target for each nutrient. On average, the ONIs are three times the DRIs, but less than the Upper Limit.
You can think of the DRIs as the minimum you need to prevent diseases of deficiency. But if you’re reading an article about nutrient density, you’re probably more interested in striving for optimal rather than merely scraping by and avoiding malnutrition.
The ONIs are based on the 85th percentile intake of one hundred and fifty thousand days of food logging data by Optimisers or the point at which each nutrient stops providing a satiety benefit, whichever is the lesser. The ONIs are challenging but possible to achieve with whole food.
The tables below show the ONIs for each essential nutrient compared to the DRIs and AIs. To learn how to level up to the ONIs, check out The Nutrient Bucket-Filling Game.
Minerals
| nutrient | ONI | DRI or AI | units |
| calcium | 1650 | 1200 | mg |
| copper | 3.0 | 0.9 | mg |
| iron | 30 | 18 | mg |
| magnesium | 825 | 320 | mg |
| manganese | 5.5 | 1.8 | mg |
| phosphorus | 1250 | 700 | mg |
| potassium | 6000 | 2600 | mg |
| selenium | 300 | 55 | mcg |
| sodium | 4000 | 1500 | mg |
| zinc | 25 | 8.0 | mg |
Vitamins & Omega 3
| nutrient | ONI | DRI or AI | units |
| thiamine (B1) | 3.0 | 1.1 | mg |
| riboflavin (B2) | 6.0 | 1.1 | mg |
| niacin (B3) | 60 | 14 | mg |
| vitamin B5 | 12 | 5.0 | mg |
| vitamin (B6) | 5.0 | 1.3 | mg |
| vitamin (B12) | 12 | 2.4 | mcg |
| folate | 1000 | 400 | mcg |
| vitamin A | 3000 | 900 | mcg |
| vitamin C | 350 | 75 | mg |
| vitamin D | 1200 | 600 | IU |
| vitamin E | 25 | 15 | mg |
| vitamin K1 | 1100 | 90 | mcg |
| omega 3 | 6.0 | 1.1 | g |
Amino Acids
| nutrient | ONI | DRI or AI | units |
| cystine | 2.4 | 0.9 | g |
| histidine | 5.4 | 1.4 | g |
| isoleucine | 8.8 | – | g |
| leucine | 15.2 | – | g |
| lysine | 15.2 | – | g |
| methionine | 4.8 | – | g |
| phenylalanine | 7.9 | 1.6 | g |
| tryptophan | 2.2 | – | g |
| threonine | 8.1 | – | g |
| tyrosine | 6.6 | 1.6 | g |
| valine | 9.8 | 2.3 | g |
How Do We Calculate Nutrient Density?
The micronutrient fingerprint chart below shows how we calculate nutrient density in Nutrient Optimiser.
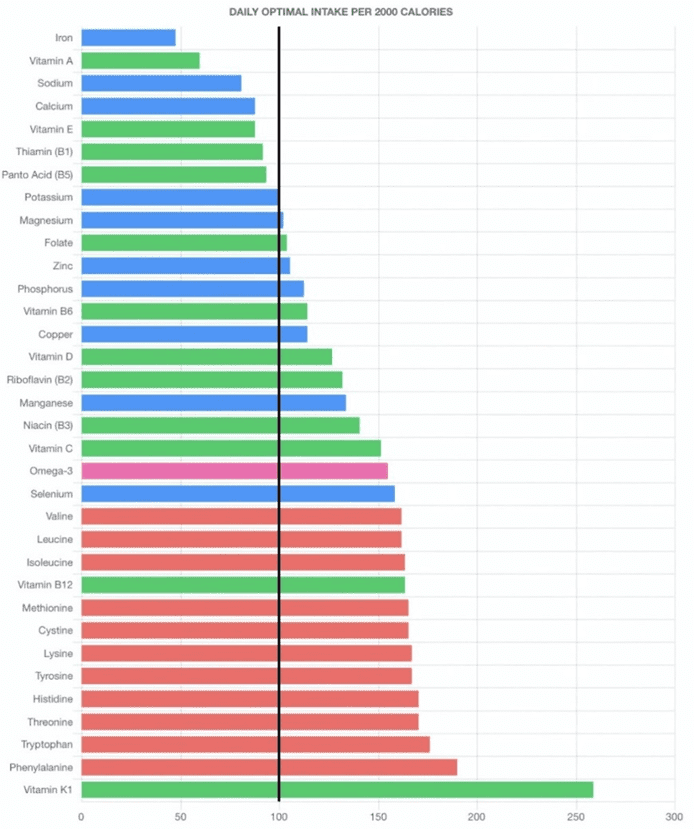
The x-axis is based on the Optimal Nutrient Intake for each nutrient per 2000 calories, with the black line set at 100%. So, if you can fill all the nutrients up to 100%, you get a perfect 100% Diet Quality Score.
But you don’t get extra points for getting more than 100% of the ONIs. The chart above shows that this person is getting plenty of vitamin K1, B12 and the amino acids shown towards the bottom of their micronutrient fingerprint chart. To increase their Diet Quality Score, they would need to add more foods that provide more iron, vitamin A, calcium and thiamine, shown towards the top of their chart.
In our Micros Masterclass, most people start their journey of Nutritional Optimisation with a score of around 50%. Then, by prioritising foods and meals that provide more of their priority nutrients, they progressively improve their Diet Quality Score.
The unique and exciting thing about our Diet Quality Score is that it measures diet quality, irrespective of quantity. So, rather than eating more to improve your score, you need to eat better.
Rather than restricting how much you eat, Nutritional Optimisation flips the nutrition paradigm to focus on nourishing your body with all the essential nutrients you need to thrive. Once you get the nutrients you need from food, your appetite settles down, and you naturally consume less energy.
To check your current Diet Quality Score and see your micronutrient fingerprint, you can take our Free 7-Day Nutrient Clarity Challenge.
Limitations of Other Approaches
There are a number of other approaches to quantifying nutrient density, but each has its limitations, which is why we created our own unique approach.
Unfortunately, most nutritional approaches revolve around avoiding something that someone believes to be ‘bad’ (e.g., carbs, fats, animal-based foods, plant-based foods, oxalates, anti-nutrients, cholesterol, saturated fat, sugar, omega-6 fats etc.).
We always find that if you prioritise getting enough essential nutrients, all the ‘bad things’ balance themselves out.
Dr Joel Fuhrman’s ANDI Score
Dr Joel Furhman’s Aggregate Nutrient Density Index (ANDI) was one of the earliest approaches to quantifying nutrient density. In addition to vitamins and minerals, it includes additional non-essential nutrients like phytosterols, glucosinolates, angiogenesis inhibitors, organosolfides, aromatase inhibitors, resistant starch and resveratrol.
Unfortunately, data on these non-essential nutrients are hard to come by for most foods, so the ANDI score is biased towards plant-based foods for which these additional parameters have been measured.
The ANDI score also doesn’t consider amino acids or omega-3, which are critical to balancing your diet at the micronutrient level.
Nutrivore Score
The Nutrivore Score sums each of the 33 nutrients relative to the DRI or AI per 100 g of food. However, without capping the contribution of any single nutrient, the Nutrivore Score tends to provide extremely high values for food that contains a lot of vitamin A, like liver.
Additionally, you probably consume less than 100 g of some of the most nutrient-dense foods and much more of many others. We found that standardising nutrients to typical serving sizes based on our analysis of half a million food entries from our Optimisers is more useful to ensure you get the nutrients you need.
Tufts Food Compass
Other approaches, like Tuft’s Food Compass, penalise ‘bad’ nutrients in food, like cholesterol and saturated fat and prioritise unsaturated fats. However, this is problematic as it dilutes the weighting of the beneficial nutrients.
For example, avoiding saturated fat tends to limit protein, which is the most critical nutrient, particularly for increased satiety and fat loss. Avoiding cholesterol, which is no longer a nutrient of concern, also leads to a much less satiating outcome and biases the system towards ultra-processed foods and away from more nutritious dairy and animal-based foods.

For more details, see Is Tufts University’s Food Compass Nutrient Profiling System ‘Broken’?
Healthy Eating Index
The USDA developed the Healthy Eating Index (HEI) to assess how well a set of foods aligns with the recommendations of the Dietary Guidelines for Americans.
The HEI is calculated based on a scoring system that evaluates the intake of specific food groups and nutrients relative to recommended levels. The index consists of 13 components, each assigned a score based on the individual’s intake, as shown in the table below.
| Component | points | maximum score | minimum score |
| Total Fruits | 5 | 0.8 cup per 1,000 kcal | No Fruits |
| Whole Fruits | 5 | 0.4 cup per 1,000 kcal | No Whole Fruits |
| Total Vegetables | 5 | 1.1 cup per 1,000 kcal | No Vegetables |
| Greens and Beans | 5 | 0.2 cup per 1,000 kcal | No Dark Green Vegetables or Legumes |
| Whole Grains | 10 | 1.5 oz per 1,000 kcal | No Whole Grains |
| Dairy | 10 | 1.3 cup per 1,000 kcal | No Dairy |
| Total Protein Foods | 5 | 2.5 oz per 1,000 kcal | No Protein Foods |
| Seafood and Plant Proteins | 5 | 0.8 oz per 1,000 kcal | No Seafood or Plant Proteins |
| Fatty Acids | 10 | (PUFA + MUFA)/SFA > 2.5 | (PUFA + MUFA)/SFA < 1.2 |
| Refined Grains | 10 | < 1.8 oz per 1,000 kcal | more than 4.3 oz per 1,000 kcal |
| Sodium | 10 | < 1.1 gram per 1,000 kcal | greater than 2.0 grams per 1,000 kcal |
| Added Sugars | 10 | < 6.5% of energy | > 26% of energy |
| Saturated Fats | 10 | < 8% of energy | > 16% of energy |
Unfortunately, trying to spread your daily food intake across specific food groups while limiting your intake of specific nutrients makes it harder to get enough of all the essential nutrients. For example, while fruits and whole grains are better than ultra-processed foods, they are not particularly nutritious.
In addition, the emphasis on unsaturated fat vs saturated fat tends to bias the results towards more processed foods that are the products of industrial agriculture (which makes sense given the US Dept of AGRICULTURE developed it). This makes it much harder to achieve a healthy omega 6:3 ratio and enough bioavailable protein. Although dairy is an encouraged food group, it has an average (PUFA + MUFA)/SFA ratio of 0.7, which would get the minimum score in the HEI, which is contradictory.
For reference, our top 100 NutriBooster recipes, when ranked by Diet Quality Score, contain 0.5% added sugars and 4.7% saturated fat, which would achieve a maximum score in the HEI.
Given the stated goal of the Dietary Guidelines is to ensure nutrient adequacy, why not work from first principles and ensure we get enough of all the essential nutrients within our daily energy budget?
Will Nutrient Density Help Me Lose Weight?
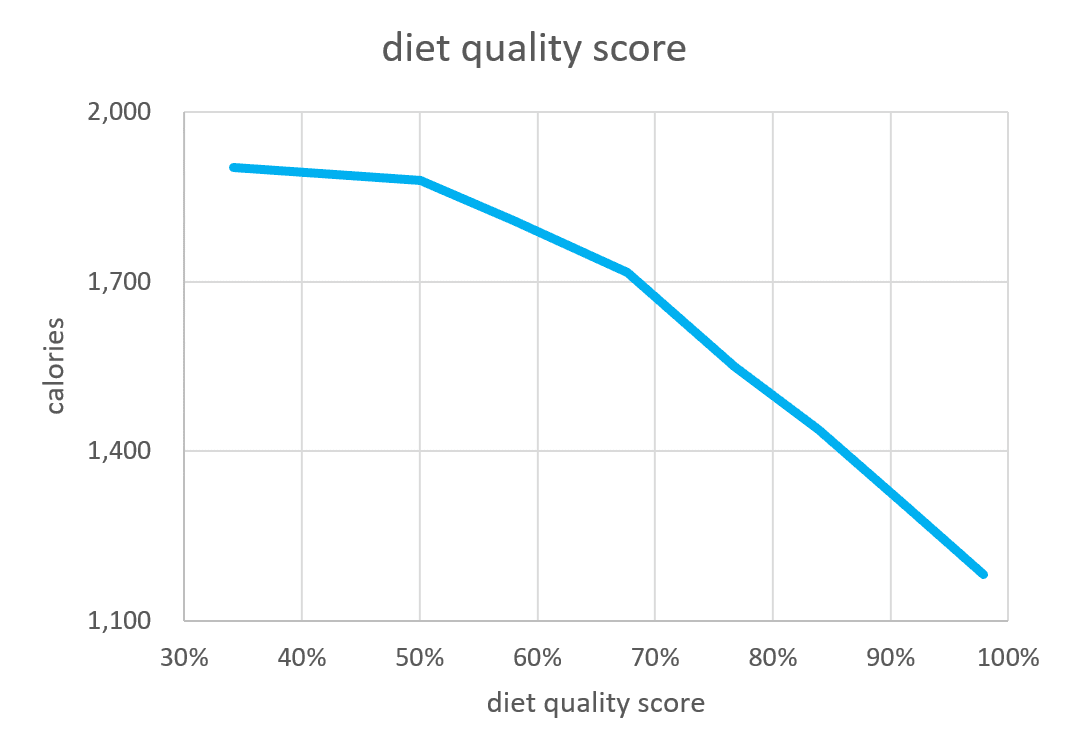
The good news is that packing more nutrients into your daily energy budget aligns with eating less. Nutrient-dense food and meals are more satiating than energy-dense, nutrient-poor, ultra-processed foods.
The chart below shows that Optimisers consume less energy as they increase their Diet Quality Score. Optimiers with the highest diet quality score in our Micros Masterclass consumed 29% fewer calories.
The table below shows the results of a multivariate analysis of one hundred and fifty thousand days of food logging data from our Optimisers, showing that packing more of the essential nutrients into your daily energy budget (particularly potassium, calcium and selenium) aligns with eating a lot less!
| Nutrient | low | high | calories | % |
| potassium (mg/2000 cal) | 1,979 | 5,986 | -125 | -8.1% |
| calcium (mg/2000 cal) | 487 | 1,923 | -104 | -6.8% |
| selenium (mg/2000 cal) | 79 | 307 | -86 | -5.6% |
| sodium (mg/2000 cal) | 1,534 | 5,142 | -62 | -4.0% |
| niacin (B3) (mg/2000 cal) | 14 | 67 | -32 | -2.1% |
| folate (mg/2000 cal) | 175 | 1,022 | -13 | -0.9% |
| Total | -422 | -27.5% |
Moving from a low to a high potassium intake aligns with an 8% reduction in overall calorie intake. In addition, dialling in calcium, selenium, sodium, niacin, and folate will all lead to further reductions. If you consumed foods and meals with more of these nutrients per calorie, you’d likely consume 27% fewer calories!
But remember, this is based on the average of all our Optimisers. The nutrients you need to prioritise for greater satiety will be unique to your diet.
For more details, see:
- Crush Your Hunger for Longer: The Biggest Satiety Hacks (and How to Stack Them), and
- The Food Satiety Index Score
Why Can’t I Just Take a Supplement?
Supplements may be helpful if you can’t get the minimum amount of nutrients you need from your everyday diet. But they’re unlikely to lead to greater satiety, reduced hunger and weight loss.
Our appetite for protein, fat and carbohydrates has been studied extensively, finding that we eat less when we dial up our protein % by reducing energy from carbohydrates and fat. It is also well-accepted that we crave sodium, calcium, and possibly other micronutrients if they are lacking in our diet (Simpson et al., 2022).
However, foods containing more nutrients, like potassium and calcium, tend to provide more protein and have a lower energy density. So, we can’t expect to take isolated synthetic nutrients and achieve the same satiety response from nutritious whole foods. If anything, relying on supplements as “nutritional insurance” may reduce cravings for nutritious foods.
In our Micros Masterclass, many people find they can save hundreds of dollars a month once they realise they can get the nutrients they need from the foods they eat.
For more detail, see Nutrients: Could You Be Getting Too Much of a Good Thing (from Supplements and Fortification)?
What About Bioavailability?
Bioavailability refers to the proportion of the nutrients in a food absorbed into your body. As shown in the figure below (Beal et al., 2023), omega-3, vitamin A, iron, calcium, and zinc are less bioavailable from plant-based foods than from animal-based foods.
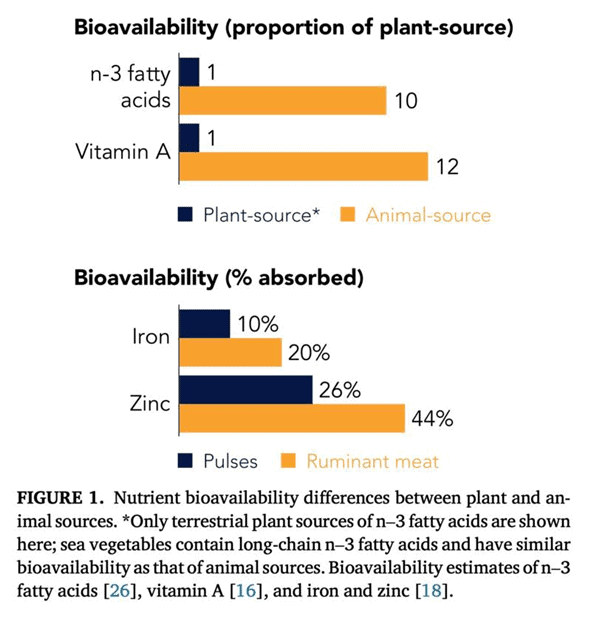
However, this doesn’t mean that plant-based foods are worthless in your diet. They also provide other nutrients like magnesium and potassium that are bioavailable from plant-based sources. Additionally, many people on an omnivorous diet get more vitamin A and iron than they need, so bioavailability isn’t a big concern.
However, if you are following an exclusively plant-based diet and find that omega-3, vitamin A, iron, calcium or zinc are at the top of your micronutrient fingerprint charts, it may be worth considering supplementation or adding foods that contain bioavailable forms of these nutrients.
Are Carbs or Fat More Nutrient Dense?
Many people prefer either a low-fat or a low-carb dietary approach. But, as shown in the chart below, nutrient-dense foods are lower in carbs and fat.
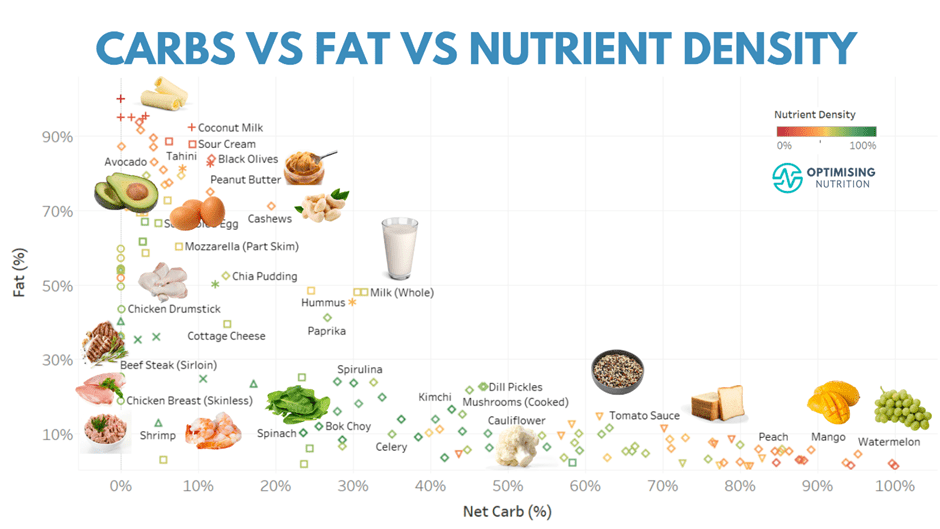
The most nutrient-poor ultra-processed foods tend to combine carbs and fat with minimal protein and fibre. Conversely, the most nutritious foods tend to contain plenty of protein and fibre with less energy from both carbohydrates and fat.
Nutrient Dense Recipes
To help Optimisers dial up their nutrient density quickly, we have created a suite of 1400+ NutriBooster recipes. The chart below shows these recipes in terms of Diet Quality Score vs protein %.
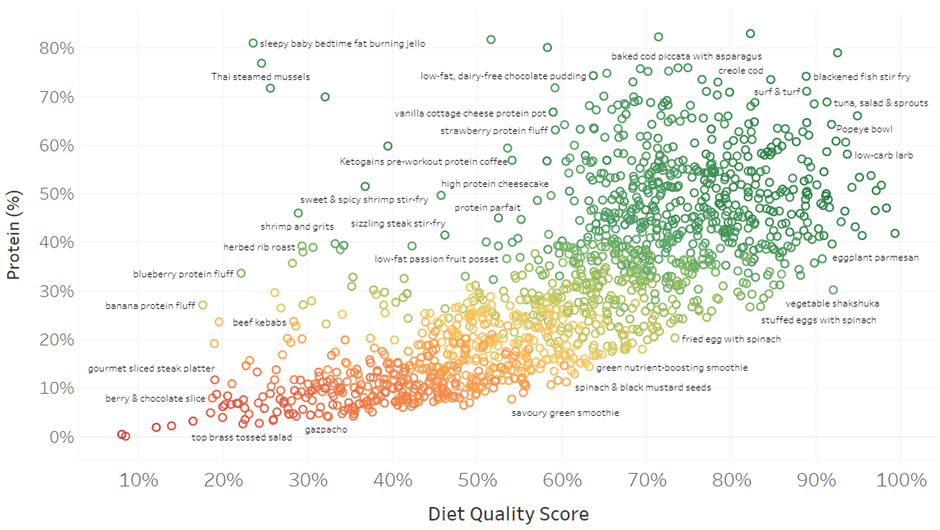
To see what these recipes look like, check out the interactive Tableau version of this chart (on your computer). When you mouse over each point, you’ll see a popup with more detail.

When you click on a recipe, you’ll see a hyperlink that will take you to a picture showing what each recipe looks like. To simplify things, all the recipes are pre-logged in Cronometer to save you time.

How to Increase Your Nutrient Density
In our Micros Masterclass, we guide Optimisers to track for a few days to identify which nutrients they need to prioritise. They can then start levelling up their nutrient density by incorporating foods and meals that provide more of their priority nutrients and fill the gaps in their micronutrient profile.
Levelling up your nutrient density does not need to be a radical overnight change. Instead, we find it works best when people see it as a nutritional adventure and a game of quantified nutrition to nourish your body with all the essential nutrients it needs.
Then, as you find new food and meals that you love to eat that provide more nutrients, you will automatically decrease your intake of less optimal options.
Nutrient Density Starter Pack
We’re eager to make the process of Nutritional Optimisation as simple as possible.
We’d love you to start your journey today!
If you join our free Optimising Nutrition Community, you’ll get a starter pack that includes:
- Food Lists – optimised for each essential nutrient, goals, preferences and conditions.
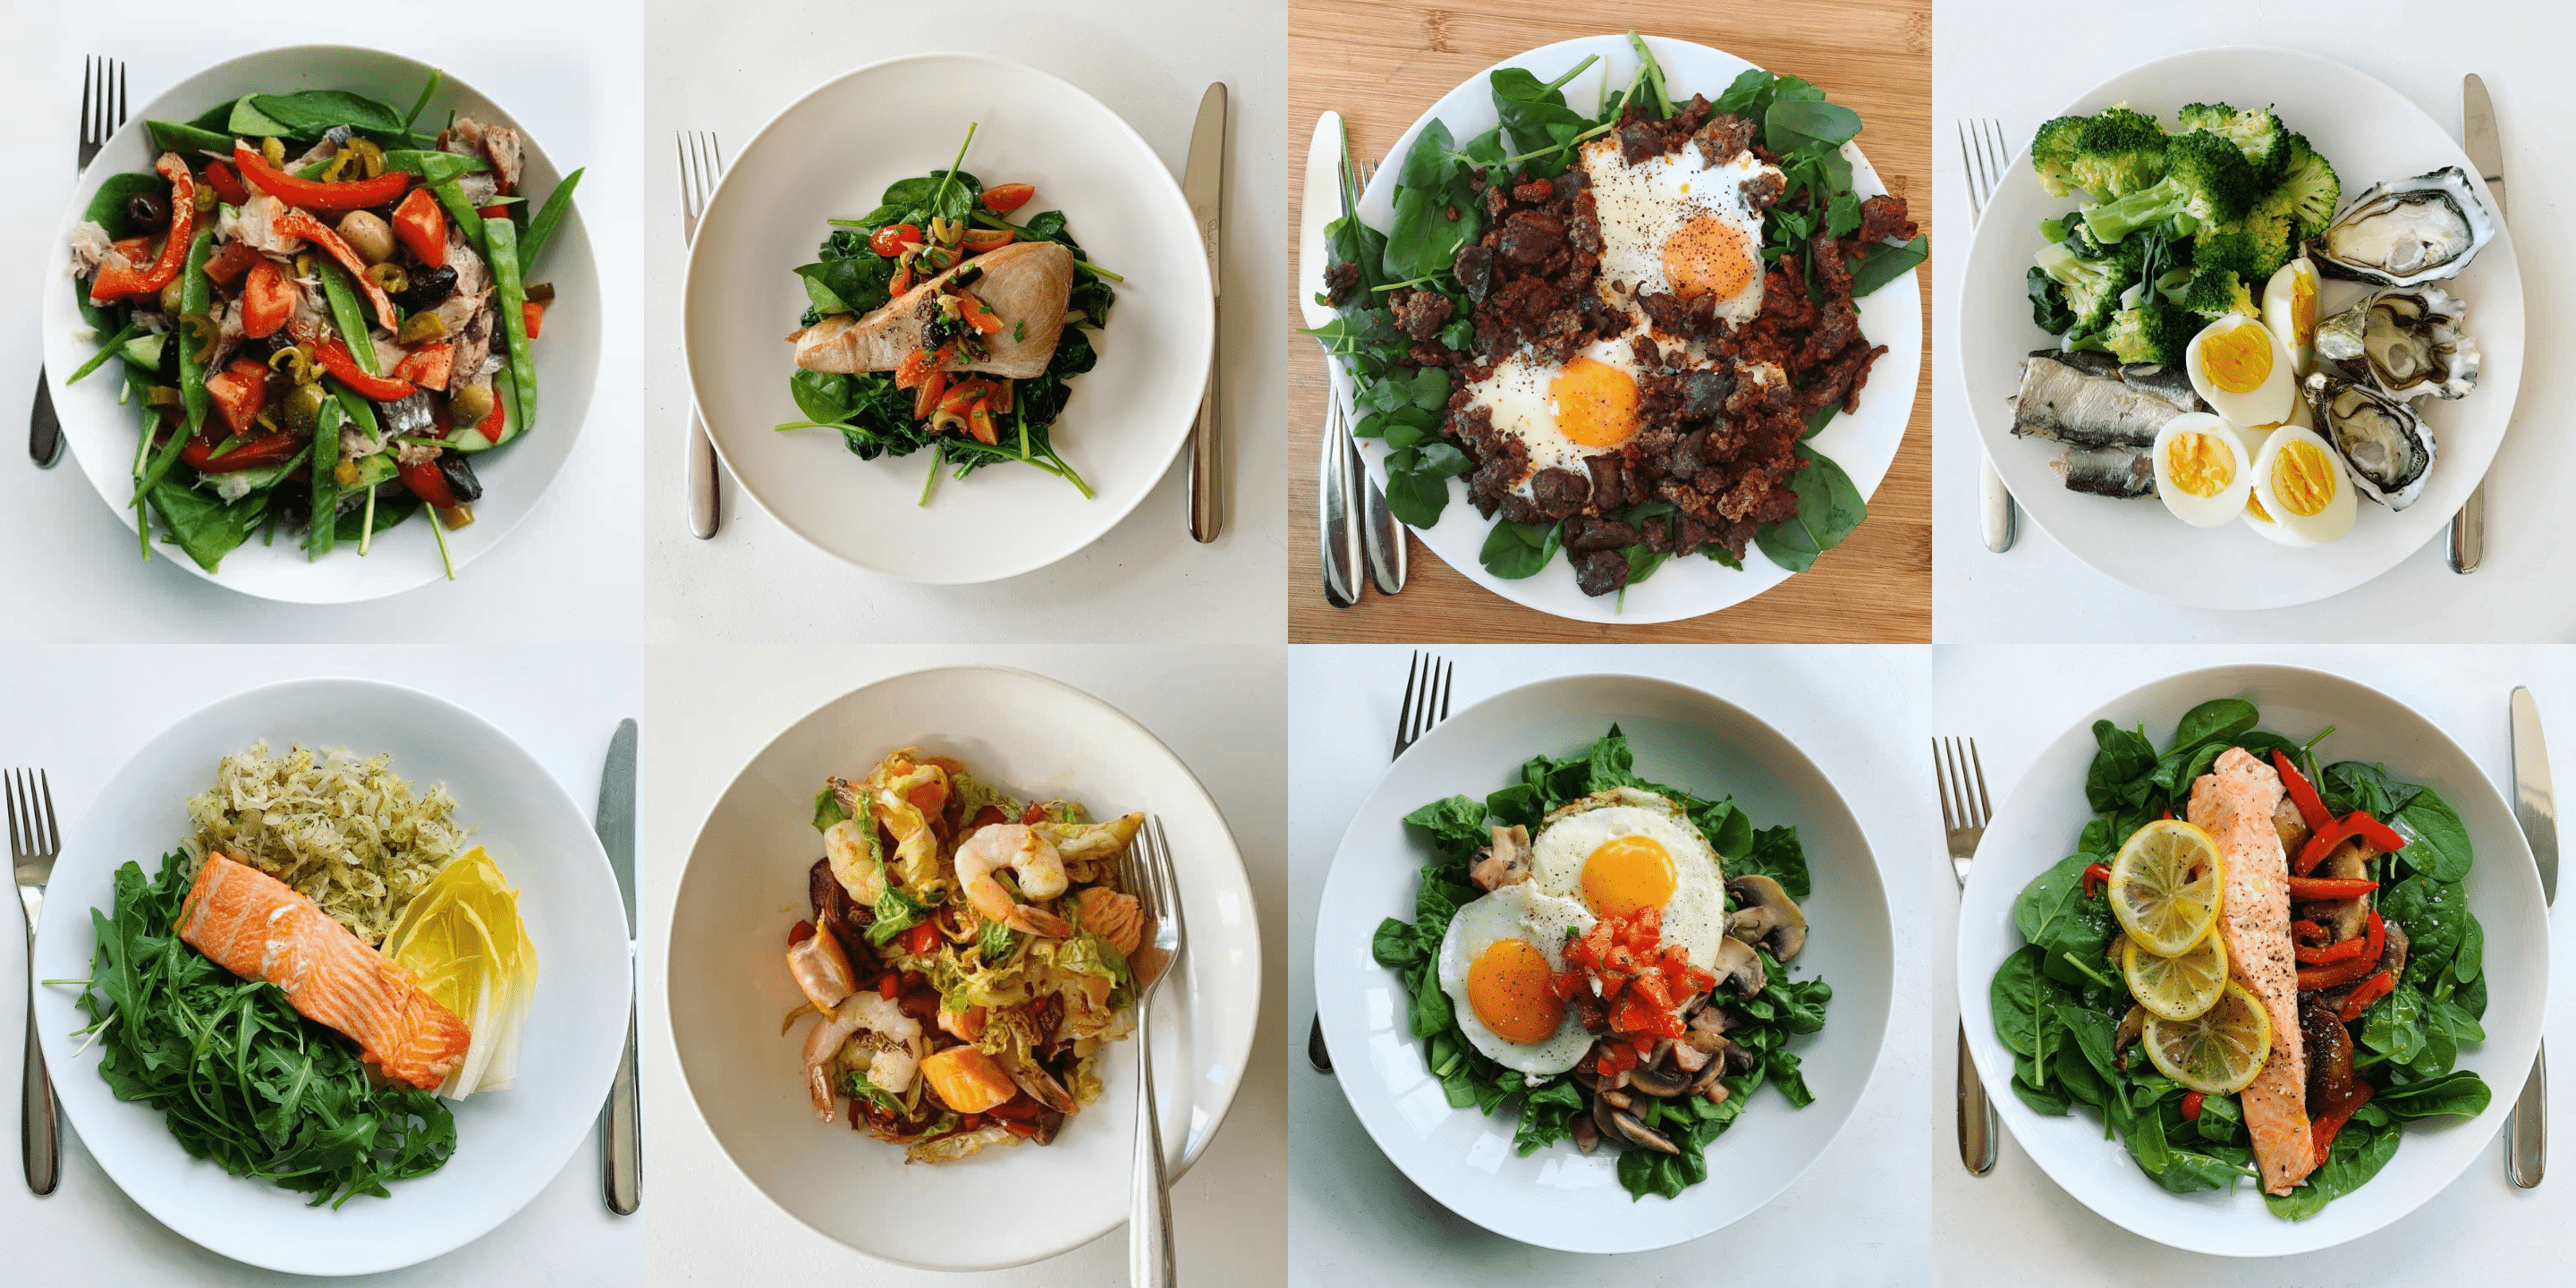
- The Healthiest Meal Plan in the World – see what a week of nutrient-dense eating looks like.
- Recipes – check out samples of each of our NutriBosoter recipe books.
- 7-Day Nutrient Clarity Challenge – identify your priority nutrients and the foods and meals that contain them.

More
- Unlocking the Power of Nutrient-Dense Foods: Your Guide to Optimal Nutrition
- One Nutrient Density and Satiety Chart to Rule Them All
- Nutrient-Dense Meals and Recipes
- The Diet Quality Score: Your Ultimate Measure of a Balanced Diet
- NutriBooster Recipes
- Micros Masterclass
Nutrient Series
Minerals
- Calcium
- Iron
- Magnesium
- Phosphorus
- Potassium
- Sodium
- Zinc
- Selenium
- Copper
- Manganese
- Chromium
- Molybdenum
- Biotin (B7)
- Iodine
Vitamins
- Vitamin A
- Vitamin E
- Thiamine (B1)
- Riboflavin (B2)
- Niacin (B3)
- Pantothenic acid (B5)
- Vitamin B6
- Folate (B9)
- Vitamin B12
- Vitamin C
- Vitamin D
- Choline
- Vitamin K1
- Vitamin K2
“Faultless” engineering. BOOM! (sooooo excited for everyone) Cheers!
Ive been experimenting with nutrients for 26 years. This is the best article I’ve read on nutrition ever. I’ve done my fair share of reading, researching and practicing. Thank you for this article
Astounding work being done by you guys! Marty Kendall and Alex Zotov! I will return to this article later today. Thanks for all you are doing for all of us!
Fantastic article, brings clarity to the discussion!
This is amazing but I noticed spinach in the list of top calcium foods. The calcium in spinach is so bound up in oxalate that you’re getting a lot less than the amount indicated. I’m surprised bok choy isn’t on the list instead – it has a 40% absorption rate and that’s better than milk (which is ~30%).
As noted in the article, there the bioavailability data is limited to refine these rankings for all foods systematically.
Can we somehow get every human adult to read this article? I enjoyed every word!
Awesome! Thank you!