
Embarking on a journey to control your hunger and shed those extra pounds?
Discover the most impactful satiety levers and how to blend them into your daily diet harmoniously.
This insightful analysis, rooted in a comprehensive study of 150,000 days of data from dedicated Optimisers, unveils the key elements of a fulfilling diet that can curb your cravings effectively. Uncover how the right balance of protein, energy density, and nutrient density not only silences your hunger but also nudges you towards a healthier, more vibrant life.
Dive into a world of intelligent food choices that promise a satisfying dietary experience every day. Your pathway to mastering hunger and enjoying a gratifying diet begins here!
Satiety vs. Popular Diets
Watching the arguments about satiety on Twitter lately reminds me of that old parable about the blind men holding onto different parts of the elephant.

Everyone believes their way of eating is the best because it works for them. So, satiety makes sense, but it’s “not quite right” because it doesn’t quite align with their preferred way of eating.
Many popular dietary approaches can ‘work’, but satiety is why any of them help us feel fuller for longer.
With satiety as the primary outcome, we can leverage the beneficial parameters of all dietary approaches.
Why Diets Work (and Why They Fail)
Named diets have their benefits and limits. We can push any simple approach to an extreme until it breaks. But, focusing on satiety as the primary outcome enables us to achieve the benefits of each approach while avoiding the pitfalls.
| Approach | Benefit | Limitation | Satiety |
| Low carb/keto | Great for satiety and stable blood glucose. Lower carb often increases protein and avoids processed carb+foods | Most people are looking for weight loss, not elevated ketones, for therapeutic purposes. Overemphasising dietary fat can hinder fat loss from the body. | High-satiety foods are lower in carbs with adequate protein. Fat is an excellent source of slow-burning energy; a solid amount of fat comes packaged with protein. Higher satiety foods moderate dietary fat to enable fat loss from the body. |
| Protein:Energy or PSMF | Focuses on protein, the biggest driver of satiety. | Protein isn’t the only factor that influences satiety. Not everyone enjoys extremely high-protein foods, and it’s harder if you’re plant-based or vegetarian. | Considers other factors that play a role in increasing satiety. |
| CICO | Acknowledges energy/mass balance. | No consideration of macros, which are critical to increase satiety and ensure you get the protein you require without excess energy. Hunger usually wins in the long run when we try to use our willpower to fight hunger without changing what we eat. | Manages the inputs that allow us to eat less without unbearable hunger. |
| Plant-based | Lower energy density, low fat, high-fibre diets are hard to overconsume. | “Plant-based” foods can range from non-starchy vegetables (which are nutritious and satiating) to the worst ultra-processed foods that combine starch, sugar and vegetable oils. | Considers energy density and fibre, which are beneficial components of a plant-based approach but avoids hyperpalatable “plant-based” ultra-processed foods by avoiding the combination of starch and fat. |
| Carnivore | Plenty of bioavailable protein provides a solid array of nutrients and satiety. | If you’re not eating carbs, you’ll need to get energy from fat. But finding the balance between fat and protein can be hard. | Helps balance fat and protein to align with context and goals. |
| Volumetrics | Low-energy-density foods are satiating in the short term. | Simply adding water to our food is unlikely to keep us satiated for the long term due to the lack of protein and minerals. | Considers energy density as one of many important factors. |
The Primary Factors
Before we look at how we can integrate the most significant factors, let’s look at each separately.
Protein
Protein is generally accepted as the dominant factor in the satiety equation.
The table below shows that, based on the analysis of 157,079 days of data from 3,627 Optimiser, moving from a low to a high protein % aligns with a 28% calorie reduction.
| low | high | calories | % | |
| protein (%) | 19.6% | 44.1% | -494 | -28.1% |
In our Macros Masterclass, we guide Optimisers to get adequate protein without excess energy from carbs and fat. The chart below shows protein % vs calorie intake, showing that optimisers who dialled up their protein the most consumed less food overall.
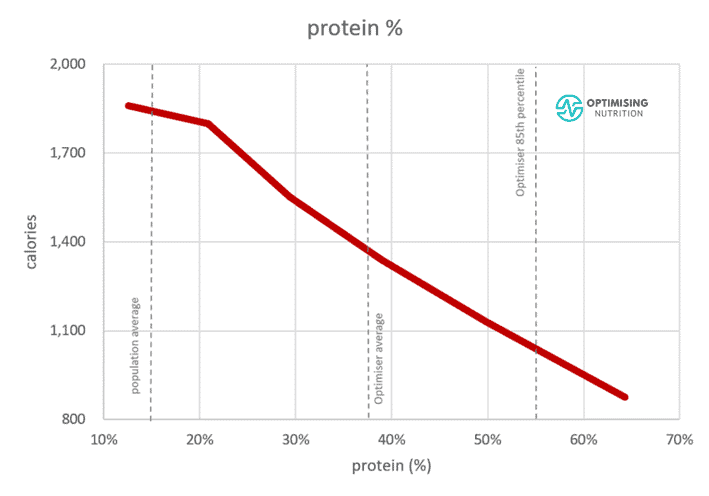
Because we all need enough protein, it makes sense that we would crave it to some degree. So, in line with the protein leverage hypothesis, we continue to eat until we get enough protein.
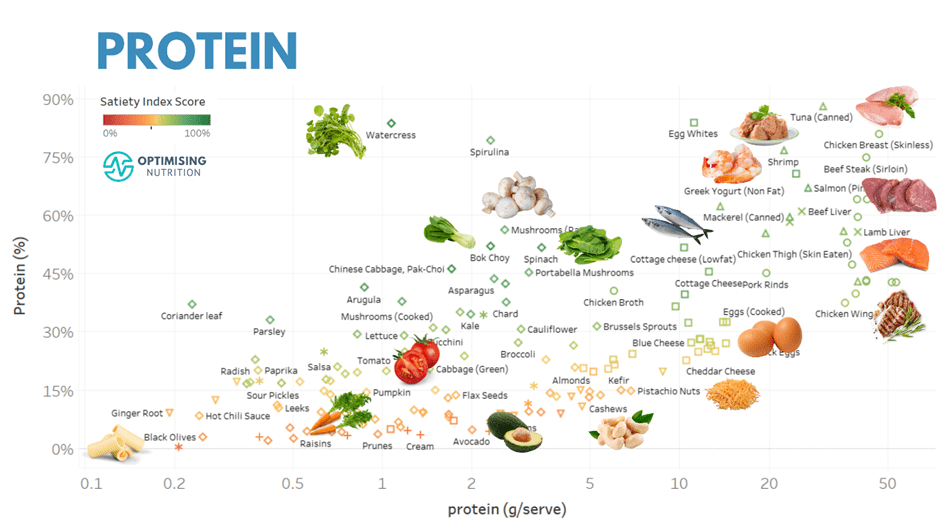
The chart below shows examples of higher vs lower protein foods (per serve vs protein %). You’ll find a detailed food list of higher protein foods and an interactive chart in our Optimising Nutrition Community space here.
For more details, see:
- The Protein Leverage Hypothesis
- The Carb-Insulin Hypothesis vs Protein Leverage Hypothesis of Obesity
- Eat Like the Animals: The Origins of the Protein Leverage Hypothesis
But as we will see, protein loses some of its satiating power once we consider the other important factors.
Fibre
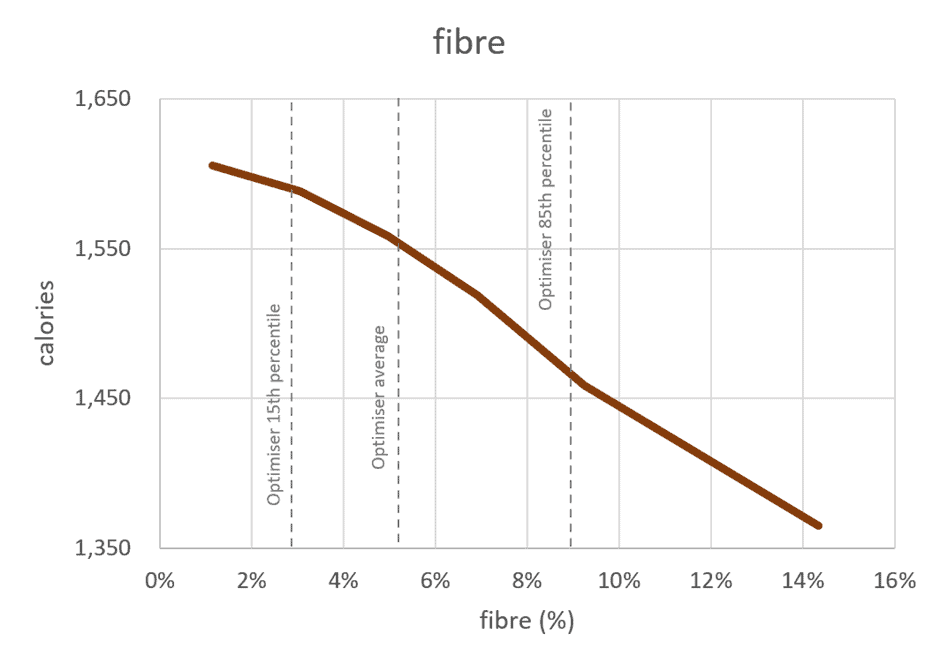
Foods that are more fibrous are harder to overeat. Higher-fibre foods are a sign of minimally processed carbs. Unlike protein, fibre is not an essential nutrient. But if you’re consuming carbohydrates, then minimally processed carbs that contain more fibre tend to make us feel fuller sooner.
As shown in the table below, moving from low to high fibre aligns with an 8% reduction in energy intake.
| low | high | calories | % | |
| fibre (%) | 2.0% | 9.0% | -129 | -8.4% |
Similar to protein, Optimisers who consume more fibre per calorie tend to consume fewer calories.
For more detail on fibre, see Dietary Fiber: How Much Do You Need?
Energy Density
Energy density is another fairly well-accepted parameter that increases satiety. It’s hard to overeat foods with a lower energy density, at least in the short term.
As shown in the table below, moving from foods with a high to low energy density aligns with a 17% calorie reduction.
| high | low | calories | % | |
| energy density (g/2000 cal) | 435 | 3530 | -302 | -17% |
But energy density also has its limitations. For example, simply adding water to your food won’t necessarily keep you full in the long term. But when we get into the nitty gritty of ranking foods, energy density can be helpful to differentiate processed foods from whole foods that are harder to overconsume (e.g., protein powders vs whole food protein sources and whole fruit vs dehydrated).
For more on the pros and cons of energy density, see:
- Energy Density vs Protein % for Satiety and Weight Loss
- Low Energy Density Foods and Recipes: Will They Help You Feel Full with Fewer Calories?
Nutrient Density
One of my favourite parameters to consider in food is nutrient density.
As shown in the multivariate analysis results below, if we only consider the vitamins and minerals, several nutrients are statistically significantly associated with eating less (i.e., potassium, calcium, selenium, sodium, niacin and folate).
| low | high | calories | % | |
| potassium (mg/2000 cal) | 1901 | 6077 | -146 | -9.8% |
| calcium (mg/2000 cal) | 464 | 1952 | -108 | -7.2% |
| selenium (mg/2000 cal) | 72 | 312 | -77 | -5.1% |
| sodium (mg/2000 cal) | 1479 | 5230 | -54 | -3.6% |
| folate (mg/2000 cal) | 164 | 1050 | -42 | -2.8% |
| vitamin C (mg/2000 cal) | 28 | 494 | -7 | -0.4% |
| total | -434 | -29.1% |
When we sum up the satiety impact of the nutrients, we see that it is more than fibre and energy density and similar to protein! In our Micros Masterclass, we guide Optimisers to get more of the essential nutrients they require from their food, which leads to a lower energy density and plenty of protein and fibre.
It’s well established that we crave sodium (which is why it’s added to ultra-processed food to make us eat more). Many believe we have a specific appetite for calcium, and we may have an appetite for other micronutrients when they are lacking in our diet (Simpson et al., 2022).
Potassium and calcium are both nutrients that many people don’t get enough of. A 2010 NHANES survey of 16,444 people in the US showed that 100% of people don’t meet the DRI for potassium, and 44% don’t meet the DRI for calcium. So, it makes sense that we may crave foods that contain more of them.
Interestingly, we see vitamin C having a small satiety response. While most people are probably getting adequate vitamin C from supplements today, it’s conceivable that some people may crave foods that contain it. Remember that vitamin C was the first vitamin discovered after thousands of sailors died of scurvy.
Because they were so deficient after months at sea, they would eat the moss on the beach and any fruit they could get their hands on as soon as they reached an island. Lind conducted the randomised clinical trial and concluded that the sailors lacked vitamin C in citrus fruits. From that point, the British fleets carried limes, which enabled them to travel further and colonise the world.
But because it’s hard to separate the various parameters in our complex food matrix, it’s unclear if we crave all the micronutrients the way we crave protein. Protein and nutrients tend to come clustered together in real food.
Potassium has the most dominant satiety response if we only consider micronutrients. However, potassium also aligns closely with intact cells and whole foods with a lower energy density.
As shown in the chart below, foods that contain more potassium are harder to overeat.
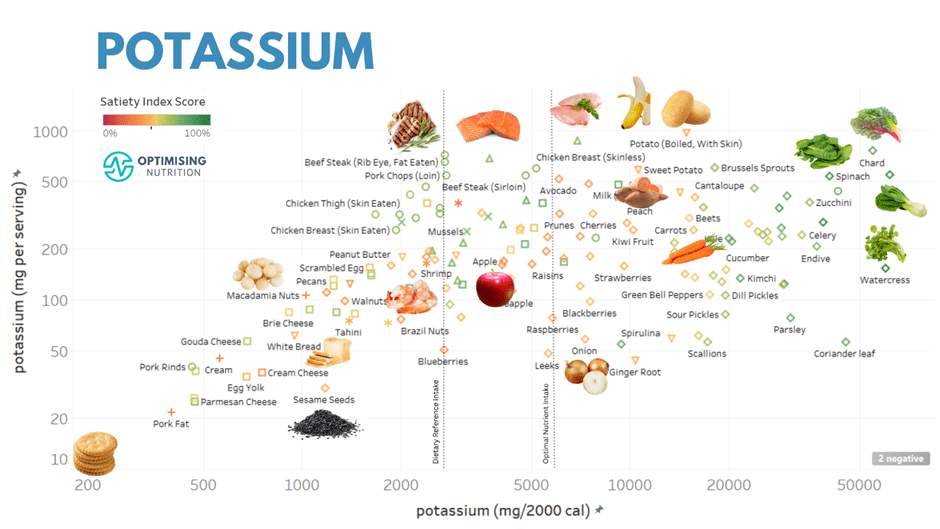
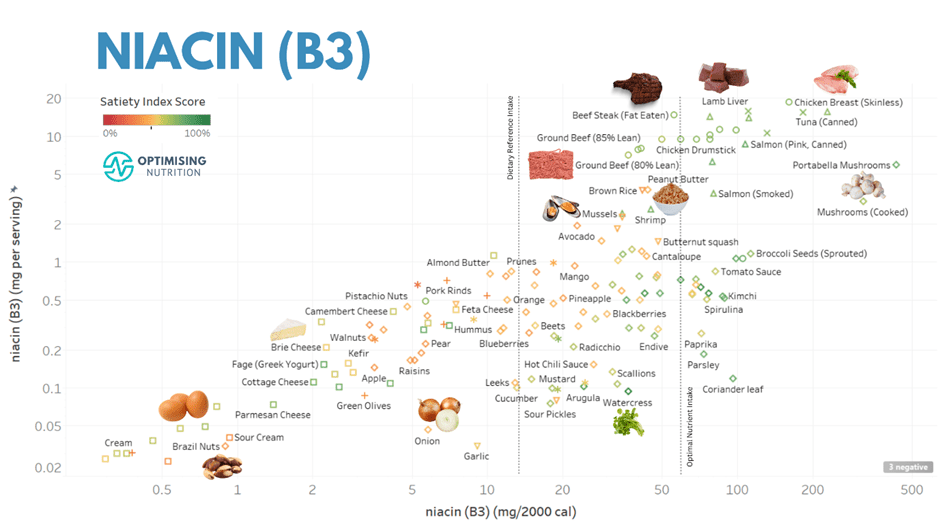
Similarly, niacin (vitamin B3) is found in higher-protein % foods, so untangling the interplay of micronutrients and protein is difficult.
The cool thing about thinking in terms of micronutrients is that it’s hard for food manufacturers to hack. While they can add a smattering of synthetic vitamins, minerals like potassium and calcium are large and expensive and rarely added to ultra-processed foods.
For more details, see:
- Nutrient Leverage Theory – Cluster Analysis
- The Key Ingredients to Feel Full and Fueled: The Principal Components of Satiety and Nutrition
Ultra-Processed Foods
In addition to parameters that align with eating less, we can also consider the factors that align with eating more. At the highest level, fat and carbohydrates provide energy. Thus, increasing fat and carbohydrate leads to a lower protein % and consuming more energy.
The results of the multivariate analysis of the energy-containing nutrients show that saturated fat, starch, monounsaturated fat, and sugar align with eating more.
| low | high | calories | % | |
| saturated fat (%) | 9% | 28% | 224 | 12.7% |
| starch (%) | 0% | 8% | 179 | 10.2% |
| monosaturated (%) | 7% | 23% | 151 | 8.6% |
| sugar (%) | 2% | 13% | 113 | 6.4% |
| Total | 667 | 37.9% |
Separately, each energy-containing nutrient is the dominant energy source in whole natural foods (e.g., sugar in fruit, monounsaturated fat in nuts, starch in below-ground vegetables and saturated fat in animal-based foods). However, to minimise cost and increase shelf life, ultra-processed foods combine these energy sources in their refined forms with minimal protein, fibre and micronutrients.
The Oreo cookie is a great example of a food that combines starch, fat and sugar. But sadly, most of the packaged foods in the centre isles of your supermarket follow the same formula. A recent study in Nature used machine learning found that 73% of the US food supply is ultra-processed.

For more details, see:
- Ultra-Processed Foods: What’s the Problem and How to Avoid Them
- Ultra-Processed Food: Modelling The ‘Hedonic Factor’
- Carbs OR Fat vs Carbs AND Fat
Cholesterol
One of the surprises of our satiety analysis is that foods containing more cholesterol have a statistically significant association with eating less, even when all the other nutrients are considered.
For more on cholesterol, see:
- Dietary Cholesterol and Blood Cholesterol: Are They Related?
- Cholesterol: When to Worry and What to Do About It
Putting it All Together
After testing numerous permutations, we’ve arrived at a preferred shortlist of parameters for our updated Satiety Index Score using a multi-pass multivariate analysis. The table below shows the combined results.
| low | high | calories | % | |
| protein (%) | 20% | 44% | -365 | -24.5% |
| energy density (g/2000 cal) | 441 | 3623 | -167 | -11.2% |
| cholesterol (%) | 0.11% | 0.52% | -151 | -10.1% |
| potassium (mg/2000 cal) | 1901 | 6077 | -146 | -9.8% |
| calcium (mg/2000 cal) | 464 | 1952 | -108 | -7.2% |
| selenium (mg/2000 cal) | 72 | 312 | -77 | -5.1% |
| fibre (%) | 2.3% | 8.9% | -55 | -3.7% |
| sodium (mg/2000 cal) | 1479 | 5230 | -54 | -3.6% |
| folate (mg/2000 cal) | 164 | 1050 | -42 | -2.8% |
| vitamin C (mg/2000 cal) | 28 | 494 | -7 | -0.4% |
| monosaturated (%) | 6.5% | 23.5% | 70 | 4.7% |
| starch (%) | 0.0% | 8.2% | 83 | 5.5% |
The cool thing about multivariate analysis is that it eliminates the factors that are not statistically significant when all the other parameters are considered.
The regression coefficients also allow us to estimate the amount we eat of any food or meal based on its nutritional properties. So, we are not simply “throwing spaghetti at the wall” and allocating arbitrary weightings to our favourite parameters. Instead, the Satiety Index Score is based on data from thousands of people living and eating in the real world!
Including as many parameters as possible makes the system robust for various dietary approaches, from carnivore to plant-based. It also makes it harder for food manufacturers to game the system to create ultra-processed, ultra-profitable foods that score highly.
While protein is still the dominant factor, when considered with all the other factors, it has a smaller impact than when considered alone. This makes this satiety score more flexible and applicable to a broader range of dietary approaches.
The inclusion of monounsaturated fat and starch ensures we avoid ultra-processed foods.
Energy density is still a significant factor that allows us to differentiate between processed and whole foods.
Lowest Satiety Foods
The foods with the lowest satiety index score are listed below based on their nutritional profile. You’ll want to reduce these foods if you want to lose weight with less hunger.
| food | satiety score |
| olive oil | 0% |
| coconut oil | 4% |
| churros | 5% |
| butter oil | 6% |
| MCT oil | 6% |
| Kit Kat | 7% |
| sugar | 7% |
| butter | 8% |
| pork fat | 9% |
| Brownie | 10% |
| cookies | 10% |
| mars bar | 10% |
| popcorn | 10% |
| plantain chips | 11% |
| corn chips | 11% |
| macadamia nuts | 12% |
| hot cross bun | 13% |
| pili nuts | 13% |
| cream | 13% |
| oatmeal cookies | 13% |
| pecans | 13% |
| taco shell | 14% |
| Hershey’s kisses | 14% |
| cashew butter | 14% |
| cheesecake | 14% |
| creme fraiche | 15% |
| white rice | 15% |
| Doritos | 15% |
| maple syrup | 15% |
| Ritz Crackers | 15% |
| biscuit | 15% |
| lamb fat | 15% |
| Snickers | 16% |
| croissant | 16% |
| fruitcake | 17% |
| potato chips | 17% |
Highest Satiety Foods
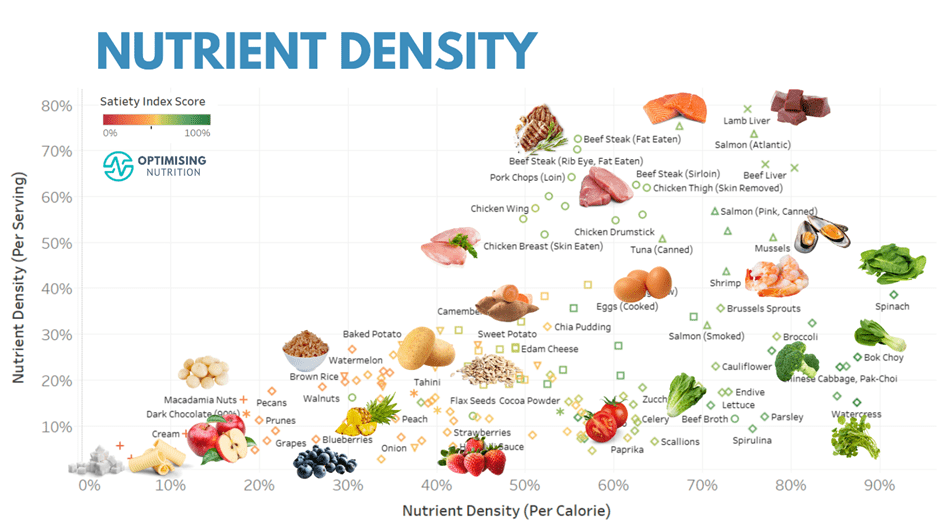
To show you what this looks like in practice, the chart below shows nutrient density (per calorie) vs. nutrient density (per serving). The colouring is based on the satiety index score. Overall, nutrient density and satiety tend to align nicely.
Listed below are some popular high-satiety foods from different food groups. To increase your satiety, add more of these foods into your regular rotation to replace the lowest satiety foods.
Plant-based
| food | satiety score |
| spinach | 94% |
| asparagus | 94% |
| bok choy | 93% |
| watercress | 93% |
| broccoli raab | 89% |
| amaranth leaves | 88% |
| beet greens | 88% |
| brown mushrooms | 87% |
| arugula | 87% |
| mustard greens | 86% |
| hearts of palm | 85% |
| portabella mushrooms | 83% |
| chard | 82% |
| kimchi | 82% |
| coriander leaf | 82% |
| kale | 79% |
| collards | 79% |
| chicory greens | 78% |
| endive | 77% |
| spirulina | 76% |
| parsley | 76% |
| broccoli | 75% |
| zucchini | 75% |
| okra | 75% |
| mung bean sprouts | 75% |
| lettuce | 75% |
| cauliflower | 74% |
| brussels sprouts | 72% |
| radicchio | 72% |
| dandelion greens | 71% |
Animal Based
| food | satiety score |
| egg whites | 82% |
| yogurt (non-fat) | 82% |
| cottage cheese (low-fat) | 79% |
| Canadian bacon | 79% |
| turkey breast | 78% |
| chicken breast (skinless) | 77% |
| pork loin | 76% |
| quark | 76% |
| chicken liver | 75% |
| roast beef | 75% |
| milk (low fat) | 75% |
| beef steak (fat not eaten) | 75% |
| ham (extra lean) | 74% |
| ground beef (97% lean) | 74% |
| beef steak (sirloin) | 74% |
| pork chops (sirloin) | 74% |
| Greek yogurt (low fat) | 74% |
| cottage cheese | 73% |
| hamburger (95% lean) | 73% |
| beef heart | 72% |
| chicken thigh (skin removed) | 72% |
| beef liver | 72% |
| chicken drumstick (skin removed) | 71% |
| ground chicken | 71% |
| pork liver | 70% |
| ribeye filet | 70% |
| chicken leg (with skin) | 70% |
| sausage (pork) | 69% |
| lamb liver | 69% |
| prosciutto | 69% |
| chicken drumstick | 68% |
| sirloin steak | 67% |
| lamb roast | 67% |
| chicken heart | 67% |
| ground turkey (93% lean) | 66% |
| ground beef (93% lean) | 66% |
| flank steak | 66% |
| beef steak (rib eye) | 65% |
| filet mignon | 64% |
| ground beef (90% lean) | 64% |
| rump steak | 63% |
| chicken breast (skin eaten) | 63% |
Seafood
| food | satiety score |
| crab | 100% |
| pollock | 92% |
| salmon | 89% |
| octopus | 85% |
| prawns | 83% |
| shrimp | 83% |
| anchovy | 82% |
| mackerel | 80% |
| cod | 80% |
| tilapia | 78% |
| oyster | 78% |
| snapper | 78% |
| squid | 77% |
| scallops | 77% |
| tuna | 72% |
| mussels | 71% |
You can also access more food lists and interactive charts in our Optimising Nutrition Community.
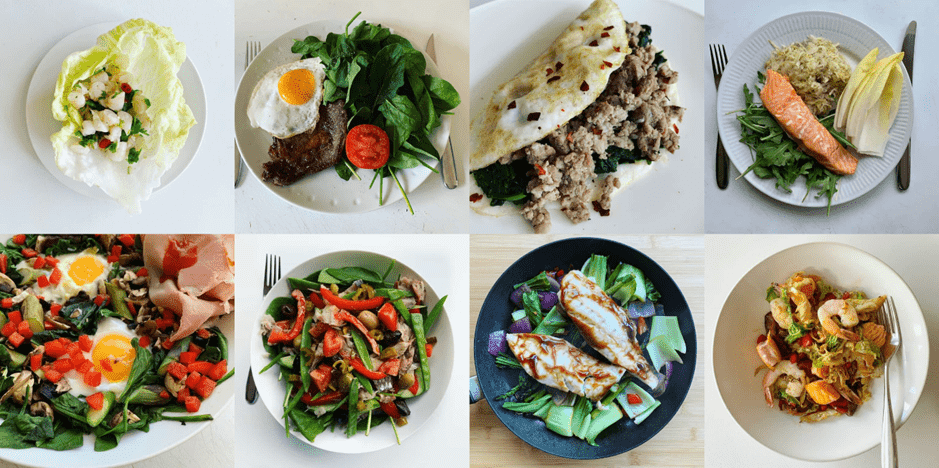
Highest Satiety Recipes
But we don’t usually eat single foods. Instead, we combine them into meals. Some examples of the highest satiety NutriBooster recipes are shown below.
Did you mean going from HIGH to LOW energy density decreased calorie intake or did you really mean going from low to high energy density decrease calorie intake?
Good pickup! It’s a bit messy because energy density is measured in g/2000 calories. I’ve tried to clean up the wording. Thanks.
Very informative. I love the charts. Easy to understand. I found your website 1 year ago and I am obsessed with all the knowledge that you have presented. There is no other one like yours. Keep up the good work. Have you done an article on how to break a plateau or loose the last 10 pounds?
Thanks so much. Glad you’re loving the info. Our DDF Challenges using glucose tend to help people get the ball rolling, but the Macros Masterclass is great for really dialling things in. https://optimisingnutrition.com/macros-masterclass/
Fantastic data — but I do wonder how you know, based on single days of data, whether someone feels true satiety. That is: on a day when someone consumes fewer calories, is it because they are full because they are a high protein percentage,whole foods diet rich in micronutrients? Or is it because they were white-knuckling through, feeling super hungry?
And on the days someone eats more calories, is it because they chose to eat cream or cheese or olive oil that day? Or is it because they just spent 3 days or more eating severely restricted energy way under their basal metabolic rate and now they’re ravenous and eating everything in sight to make up for it?
I do think nutrient-dense eating increases satiety — at least, it does for me — but only if I don’t go too far overboard on the calorie restriction. My own lowest-calorie days are unsustainably miserable (tired, cold, hungry) no matter how nutrient-dense: sometimes I just need to eat more. And my highest-calorie days seem to be the ones immediately following low-calorie days that coincide with lots of exercise. Well, I have a brain between my ears and I can figure out “hey, too low is bad, maybe don’t do that, and maybe also eat more if you’re active all day even if you’re trying to reduce stored energy”. But I’m curious about how you account for that variation between days in your data if you’re treating each single day as a sample. Do your results change if you use entire weeks of eating, or entire months, instead? What happens to your satiety index scoring if you exclude extremely low calorie days, or the very high calorie days that follow them? What happens if you exclude data from people who are trying to lose weight? (That might make your dataset too small, I guess.)
Good questions. Agree that we can restrict ourselves for a few days, but the appetite comes back, and we compensate. The good news is that we have 150k days from 3.2k people, so we have 46 days per person on average. So the analysis really identifies the quantitative signature of the food that enable people to eat less. I also excluded the very high and very low-calorie intakes to exclude junk outliers. I’ve done analysis in the past looking at different goals (weight loss, blood sugar control, high carb, low carb therapeutic keto etc.), and the global trends are the same. However, the specific micros that are statistically significant can change depending on the individual and what they are consuming and hence getting less of.