
When it comes to nutrition, most people are primarily interested in weight loss.
But there is a confusing array of metrics to focus on, like low-fat, low-carb, high-fat, high-protein, plant-based, carnivore, etc.
In this article, we dive into the data to understand which metric aligns with greater satiety and eating less.
As you will see, our satiety score comes out on top, but interestingly, our diet quality score comes in second, followed by protein %. Meanwhile, low-carb and low-fat, despite their popularity, are less effective.
The data supports our understanding that our appetite craves enough of all the essential nutrients, not just protein, demonstrating nutrient leverage. But you’ll eat much less if you can pack more of all the essential nutrients you need into your daily energy budget.
Chasing a higher satiety score is the best place to start if your goal is weight loss or weight management. However, transitioning to pursue a higher diet quality score is the next step to nourishing your body to thrive long-term.
Interested in learning more?
Read on.
Background: How Much Does Diet Quality Matter?
In 2018, Dr Christopher Gardner released the results of the DIETFITS trial, which showed that people lost a similar amount of weight on either a low-carb or low-fat diet.

This study, released at the peak of the keto craze, was a big deal, partly because the study had been initiated and partially funded by the Nutrition Science Initiative (NUSI), led by Gary Taubes and Peter Attia, who had hoped to validate the carb-insulin hypothesis. Instead, the study shows that reducing EITHER carbs or fat helped people successfully lose weight.
Beyond comparing carbs vs fat, Stanford’s DIETFITS study was intriguing because it encouraged people to focus on diet quality. At the time, Gardner noted that the participants who focused on food quality rather than just minimising carbs or fat achieved the largest weight loss. This underscores the importance of diet quality not just for weight loss but for sustainable weight management as well.
Gardner and his team recently released a follow-up data analysis of the DIETFITS data, highlighting the importance of food quality. Whether they followed a low-carb or low-fat diet, weight loss was significantly greater for those who created a high-quality diet.
Unfortunately, they used the USDA’s Healthy Eating Index to quantify food quality (which I’m not a big fan of). So, I thought it would be interesting to dive back into our data to see how our diet quality score aligns with how much we eat and, hence, weight loss.
I’ve written about DIETFITS previously. If you’re interested in learning more, see:
- Personalised Satiety: Tailoring Low-Carb or Low-Fat Diets for Effective Weight Loss,
- Low Carb vs Low Fat Diets: The Verdict for Weight Loss and Nutrient Density and
- Low Fat Keto: Debunking the ‘Eat Fat to Burn Fat’ Myth.
What is The Most Important Metric to Manage for Weight Loss?
The Stanford DIETFITS trial is significant because it included data from 609 people over 12 months. However, our dataset of 835,733 days of data from free-living people also gives us powerful insights to understand how several factors align with greater satiety, eating less, and thus weight loss, including:
- protein %,
- carbohydrate %,
- fat %,
- our diet quality score and
- our satiety score.
Let’s examine the data to see what we can learn about how each parameter relates to the amount we eat. Our satiety score aligns best with eating less, but the diet quality score comes in second, illuminating how nutrient leverage works in practice.
Protein %
Our first chart highlights the relationship between protein % and energy intake, showing:
- We eat the most when our diet contains around 12.5% protein (i.e. the protein bliss point and
- Moving from 12.5% protein to 40% protein aligns with a 34% reduction in energy intake.

The chart below shows the distribution of protein intake in our 835,733 days of data. We have a strong appetite for protein to ensure we get enough, but not too much.

Because it is so satiating, protein is hard to overeat. Most people naturally gravitate to the protein intake that aligns with eating the most.
- When our food contains less than 12.5% protein, we eat more to get the protein we need.
- However, once we exceed this absolute minimum protein intake, we eat less when we get more protein per calorie (i.e., a higher protein %).
This phenomenon, first observed by Professors Raubenheimer and Simpson, is often known as protein leverage.
If you need more protein, check out our high-protein infographics and food lists here.
If you’re already getting enough total protein but want more protein per calorie, check out our protein-rich foods here.
Carbohydrates
When we look at the satiety response to carbohydrates, we see that, like protein, it’s not an all-or-nothing, good-vs-bad affair. Instead, we see a bliss point at 47% carbohydrates, where we eat the most.

In line with the DIETFITS findings and numerous other studies, we eat less when we reduce carbs. However, at the other extreme, we see that people with a very high carb intake eat less than those on a low-carb diet.
Again, most people gravitate to the carbohydrate bliss point that aligns with eating the most. Towards the right of the distribution chart below, you can see that many people maintain the very high carbohydrate intake that aligns with eating less.

Fat
The final macro is fat. The data response chart below shows that we eat much less when we slash fat. Like protein and carbs, there appears to be a bliss point at around 37% fat that aligns with eating the most.

Towards the right, we see a ‘safe zone’ of 50-60% fat, which aligns with a lower-carb diet. But the data shows we eat more if we push fat beyond 70%.
Calorie for calorie, fat is NOT the most satiating macronutrient, as many have believed.
Again, when we look at the distribution of fat intake below, we see that most people gravitate toward the bliss point that aligns with the maximum energy intake.

Macros Combined
When we look at the macronutrients together, we see that it’s not simply a matter of high vs low, good vs. bad. Instead, certain carb, protein, and fat combinations hit all our bliss points and align with overeating.

Our survival instincts drive us to hit these bliss points when these foods are available to maximise palatability and intake. When we move away from this Goldilocks zone — in any direction — we eat less.
Diet Quality & Nutrient Leverage
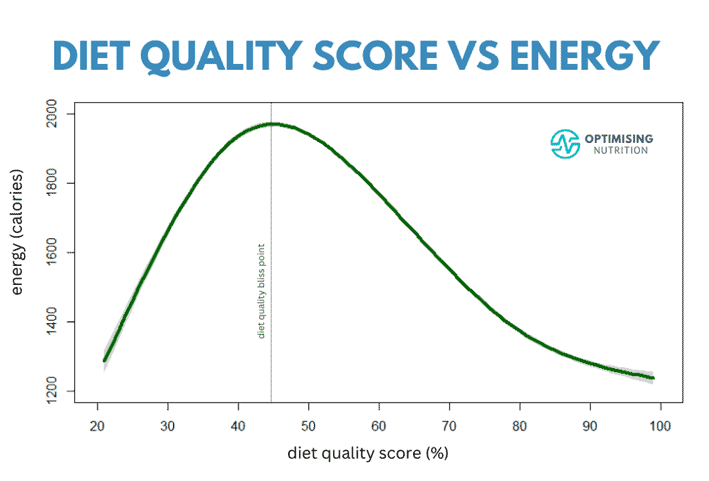
Let’s look at the satiety response to our diet quality score, which moves beyond protein and amino acids to target all the essential nutrients. This approach inherently incorporates nutrient density, focusing on foods that provide the most nutrients per calorie.
Optimisers can achieve a 100% diet quality score when they hit the Optimal Nutrient Intakes for all the essential nutrients.
We see a bliss point at a diet quality score of approximately 45%, where we eat the most. But, towards the right, we see that as we pack more of all the essential nutrients into our diet, nutrient leverage kicks in, and we eat a lot less.

We’ve seen this pattern with all the micronutrients individually, so it should be no surprise that we see the same thing when we combine them. For more details, see:
- Unlocking the Secrets of Minerals: The Hidden Power Behind Our Hunger and Cravings
- The Role of Vitamins in Satiety and Weight Management
- Optimal Amino Acid Intakes for Satiety and Weight Loss
Towards the left, we see that very low nutrient-density foods taste bland, so we eat less.
You’re probably not going to binge on plain flour, potatoes, rice, fruit, sugar or oil alone.
Instead, when we combine these ingredients, they become much more palatable, and we eat more.
While we might eat less on a fruitarian or therapeutic ketogenic diet, we also risk being malnourished, so our appetite sends us out in search of more food to get the nutrients we need.
However, towards the right, we see that when we pack more essential nutrients into our daily energy budget, we are satisfied with less food, eat less and lose weight. Nutrient-rich foods tend to have a much stronger taste, signalling to our bodies that we don’t need as much of that food to get the nutrients we require (Forde, 2016). Understanding these parameters is vital not only for initial weight loss but for long-term weight management, too.
Increasing our diet quality score from the bliss point aligns with eating 37% less, exceeding the reduction achieved by increasing protein % alone. Thus, nutrient leverage appears more effective than protein leverage alone.
Protein is the nutrient we crave the most, but we are even more satiated when we satisfy our cravings for protein, along with minerals and vitamins.
The distribution chart below shows that we struggle to maintain a very nutrient-poor or very nutrient-dense diet for long. Again, we tend to gravitate toward the bliss point that aligns with eating more.

In our Micros Masterclass, we guide our Optimisers to dial up their diet quality score, which tends to align with greater satiety.
Satiety Score
Finally, using the satiety score, we can predict how much you will eat based on what foods you eat. Unlike the other metrics shown above, there is no peak — our satiety index score has designed this out. Moving from a low to a high satiety score corresponds with a massive 65% reduction in energy intake!

The distribution chart again shows that we gravitate to a satiety score that allows us to maintain or slowly gain weight. In our Macros Masterclass, we use our data-driven satiety algorithm to show Optimisers how to increase their satiety score to reduce hunger and lose weight.

Which is Metric Best for You?
The chart below is busy, but when we combine all the curves on one chart, we see the satiety score has the biggest impact, followed by diet quality, then protein %.

The chart below shows the Satiety and Diet Quality Scores for easier comparison.

The satiety score uses the subset of the essential nutrients that align with eating less (i.e. protein %, calcium, potassium, iron, fibre, sodium and energy density). So, by increasing your satiety score, you are automatically improving your diet quality as well as engaging the power of nutrient leverage.
However, once you’ve achieved most of your desired weight loss, you can focus on nourishing your body with all the other nutrients you need to thrive and live a long and vibrant life. This shift emphasizes the importance of ‘nutrient density’ in achieving a balanced and healthful diet. This holistic approach is essential for maintaining weight loss and ensuring long-term health and well-being.
More
- Elevate Your Wellness with the Diet Quality Score: A Guide to Balanced Nutrition
- Cracking the Hunger Code: Our Data-Driven Satiety Algorithm
- Unlock Nutrient Density for a Healthier You: A Comprehensive Guide
- The Most Satiating Foods to Crush Your Hunger More Efficiently
- Macros Masterclass
- Micros Masterclass