

Our Micros Masterclass is designed to guide Optimisers through dialling in their nutrition at the micronutrient level.
It doesn’t matter where your journey starts. Your mission—if you accept it—is to progress towards optimal nutrition.
In our recent article, What Do Top Optimisers Eat Across the Globe? we showcased some foods regularly eaten by our veteran moderators who have been optimising their diets for a while.
People who reach the top of the Diet Quality Leaderboard often have a history of serious health issues. Thus, they are super motivated to go to all extremes to improve their health.
We don’t expect who joins the Micros Masterclass to reach optimal in just four weeks. Instead, we want you to learn how it’s done and progressively build new habits that will continue to grow in the months and years to come. But after four weeks, you will understand what optimised nutrition looks like and what you need to do to get there (and stay there!).
It’s normal to compare ourselves to others. We want to know how far we can go! So, I thought it might be helpful to show the range of Diet Quality Scores from Optimisers starting the Masterclass and after to show how they tend to improve.
What Is a Typical ONI Score?
The chart below shows the distribution of Diet Quality Scores of one hundred and fifty thousand days of macronutrient and micronutrient data from more than three thousand Nutrient Optimiser users who have utilised the program to fine-tune their nutrition over the past four years.
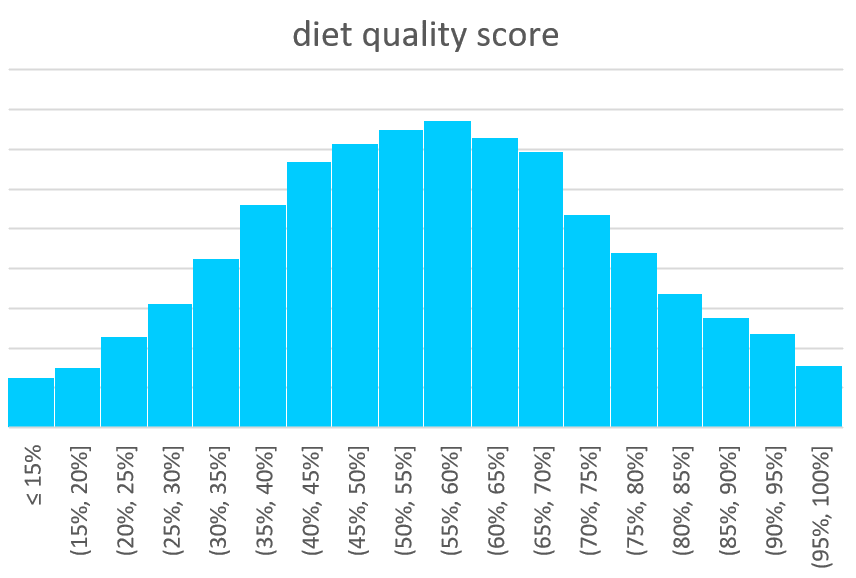
The average diet quality score is 56%. Towards the far right, only 4% of the Diet Quality Scores exceed 90%.
So don’t be too discouraged if you don’t initially get a Diet Quality Score of 100%.
No matter how perfect you think your diet already is, everyone has room for improvement, and it can take some time to dial in the nutrients you lack without overdoing calories.
Where Do Optimisers Start?
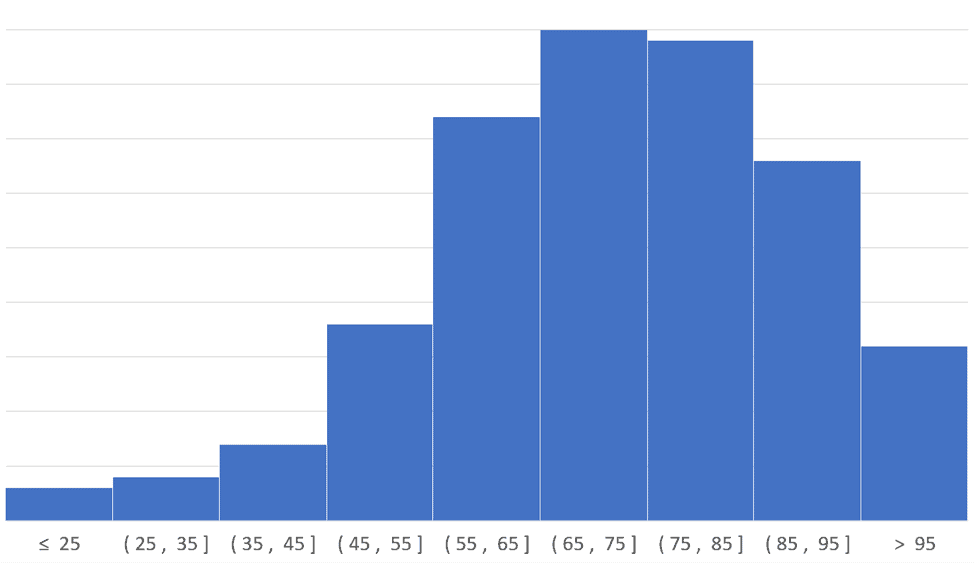
The chart below shows the nutrient score distribution during the first week of our last two Masterclasses.

The average ONI score is 62% during this first week. However, there is a wide range.
The people who start with a score above 90% are usually our moderators who have completed multiple rounds of the Masterclass.
Many people return for another try to see if they can continue fine-tuning their diet with the help of our supportive Optimising Nutrition community.
Many people have compared the Micros Masterclass to a post-graduate degree in nutrition. When asked why she completed several masterclasses Masterclass, one Optimiser aptly responded, “It takes a lot of courses to earn a degree!”
Interestingly, it’s not necessarily nutrition professionals who triumph in the game of Nutritional Optimisation. Instead, it’s the people willing to follow the data, throw out any preconceived biases they have towards nutrition, and tinker with their diet using a little self-reflection.
Once you treat nutritional optimisation like a game of getting every nutrient you require without exceeding your energy budget, it comes quickly.
Where Do Optimisers Finish?
The following chart shows the average ONI during the final week. The score distribution has shifted to the right, with the average Diet Quality Score increasing from 62 to 74%. That’s a mean increase of 13% in just four short weeks!
We Love to Celebrate the Most Improved!
As with anything in nature, there are always outliers. We love to celebrate the people who go above and beyond to improve their nutrition, no matter where they started!
The table below shows our leaderboard of the most improved from the last challenge, with many people making massive changes!
| Name | First | Final | Change |
| Jill Alexander | 36 | 69 | 32 |
| Katie Gaul | 66 | 95 | 29 |
| Melissa Saunders | 42 | 70 | 28 |
| Mary Ellen Miller | 68 | 94 | 27 |
| Amelia Passmore | 57 | 83 | 26 |
| Annette Moyers | 71 | 97 | 26 |
| Mark Stopps | 39 | 65 | 26 |
| Amy Hiebert | 40 | 65 | 25 |
| Alicia Fitts | 30 | 54 | 24 |
| Louise Duncan | 54 | 76 | 22 |
What Are the Benefits of Chasing a Higher Diet Quality Score?
A higher Diet Quality Score simply means you’re getting more of the nutrients you need without excess energy. In other words, you’re getting a higher micronutrient value per calorie or a higher nutrient density.
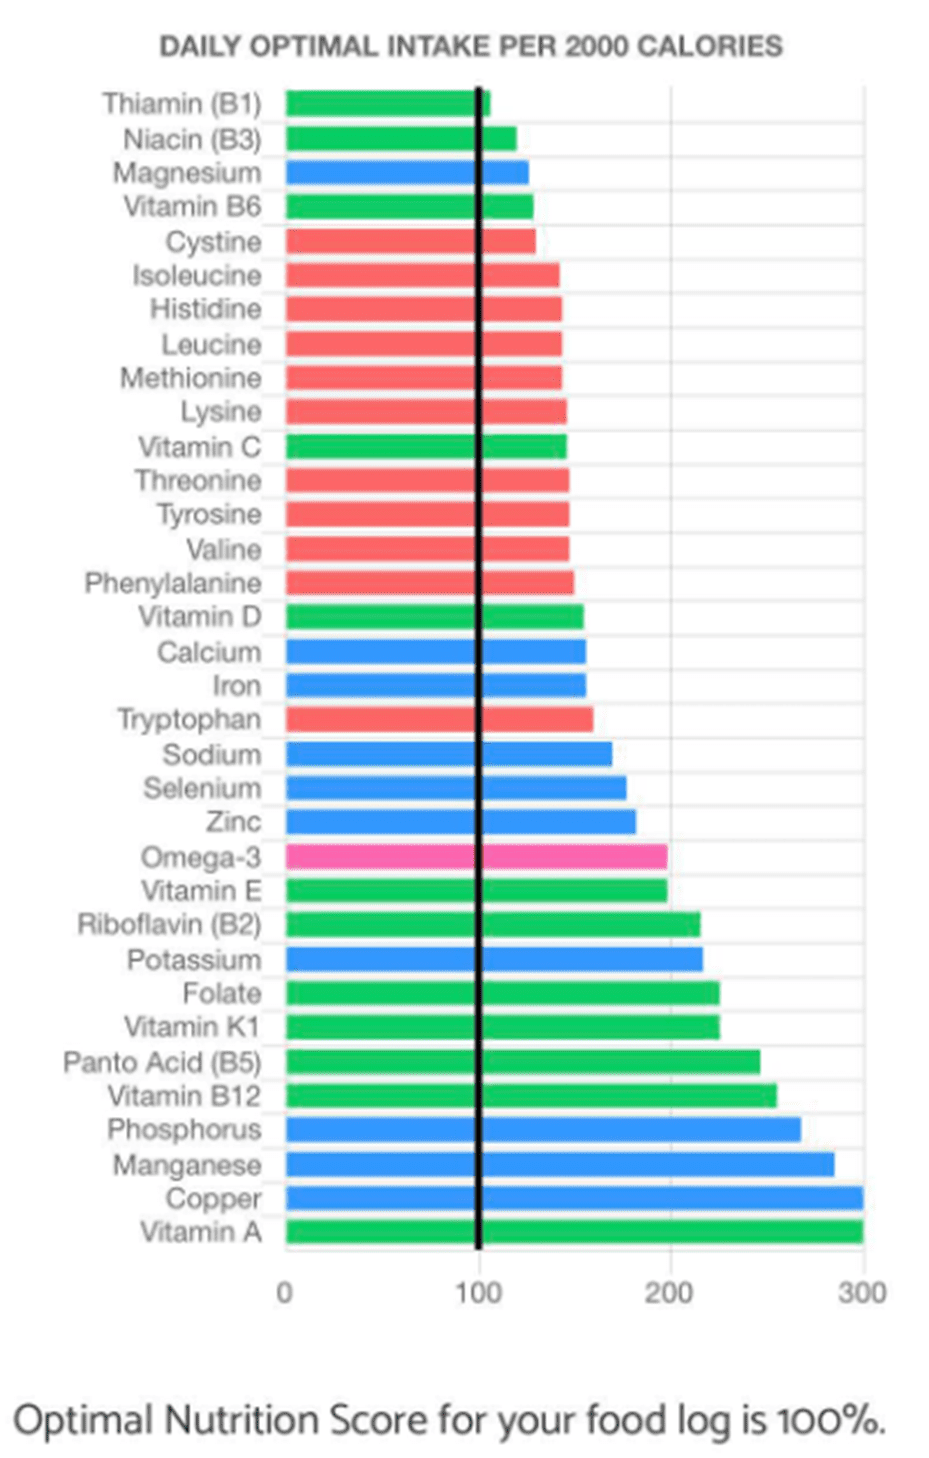
As the chart below shows, a 100% Diet Quality Score means you’ve hit every Optimal Nutrient Intake for all 34 essential nutrients. You’ve maximised your nutrient density and are getting all the necessary vitamins, minerals, essential fatty acids, and amino acids your body requires without overconsuming energy.
However, your end game is not the score. Instead, it’s what a higher Diet Quality Score also correlates with improved satiety.
Nutrient-dense foods are not only hard to overeat, but they also quell your appetite and cravings because you have successfully given your body everything it requires from the food you eat and what it’s looking for when it sends you in search of hunger. Thus, you now have enough nutrients to thrive and utilise the energy from your food and can take it easy!

While maximising macronutrients like protein (amino acids) without excess energy (calories) is a great starting point on your journey to optimised nutrition, many Optimisers find dialling in their other dietary micronutrients is the icing on the cake. In terms of energy levels and weight loss, they see results they’ve never experienced from simply focusing on protein.
Our dream is to empower people to feel their best by learning to optimise their nutrition. Once your body’s nutrient needs are met from real food, it thrives and contentedly goes about utilising extra stored energy as glucose and free fatty acids from your bloodstream, bum, and belly.
You Can’t Live at ‘Optimal’, All the Time
We’ve worked hard to gamify nutrition and make it fun for everyone!
In the final week of the Masterclass, we love to see old-timers compete for a top leaderboard spot by maximising their nutrient intake at the expense of minimal calories. However, it’s important to note that living at ‘optimal’ is not sustainable all the time. You would continue to lose weight!
Eventually, you must bring back some energy from fat and carbs to avoid becoming too lean.
Most people who go all out during the final week relax a bit after the Masterclass wraps. They bring back a little bit of energy from carbs and fat while still getting plenty of nutrients from the food they’re eating.
Once you’ve experienced quantified nutrient density, you can’t unsee it.
Once you see nutrition through the lens of nutrient density, the way you eat will change forever!
Free 7-Day Tracking Challenge
If you want to see how your current diet stacks up, you can take our 7-Day Nutrient Clarity Challenge to check your Diet Quality Score and see which nutrients you need to prioritise.
At the end of the week, Nutrient Optimiser will give you your micronutrient fingerprint chart and recommend some foods and meals to incorporate and improve your score.
Join the Masterclass
If you want to take your nutrition to the next level, we’d love you to join our Micros Masterclass! In just four weeks, you’ll work hard to identify any micronutrient gaps in your current diet and use Nutrient Optimiser to determine which foods and meals you could increase to move towards optimal!

Marty–just found this if anyone’s thinking about trying the new “potato milk”:
https://lifehacker.com/how-does-potato-milk-stack-up-nutritionally-1848545109
In case you didn’t know, reader, it has the word “potato” in it, so this stuff may as well be nuclear as far as protein goes! Honestly, besides rabid vegans, WHO’S DRINKING THIS STUFF?
Marty–just found this: https://consumer.healthday.com/fruits-and-vegetables-prevent-heart-disease-2656753483.html
Take THAT Joel Furhman, Mark Fuhrman, David Katz, Chang/Harvard Nutrition School, PETA, and every other rabid vegan walking the planet!