
Have you ever wondered why certain foods make us feel hungry or satisfied?
Have you ever wished there was an easier way to eat less without hunger?
Our novel algorithm fuses the most important factors in satiety to revolutionise how we quantify fullness and satiation.
After five years of dedicated analysis of 838,686 days of data from free-living people, we have unearthed the symphony of satiety factors that drive your hunger, appetite, and fullness.
Beyond protein leverage and energy density, we’ve also identified precisely how the essential nutrients drive your cravings and make you satisfied.
Prepare to transform your relationship with food and health and embark on a journey to nutrient-dense, data-driven satisfaction!

Previous Approaches to Satiety
To date, there have been a range of approaches to understanding satiety.
Energy Density
The energy density approach to increasing satiety requires eating more bulky, watery foods with lots of fibre to fill and stretch your stomach.

Professor Barbara Rolls has undertaken research measuring fullness over two hours after eating.
Protein Leverage
Protein leverage is based on the idea that we eat until we get the protein we require. So, to satisfy your cravings for protein with less energy, you need to increase your protein %.

Professors Raubenheimer and Simpson have documented protein leverage in various organisms, including humans.
The Satiety Index of Food
In 1995, Susanna Holt and colleagues published their Satiety Index of Common Foods. While promising, their study only considered the satiety response to thirty-eight foods over two hours.

A Better Way?
Sadly, since then, not much has been done to quantify the factors that help us feel full and eat less. There seems to be much more interest in creating highly profitable drugs that mimic the response we get from satiating foods.
While incomplete and seemingly conflicting, each of these perspectives has added to our understanding. Building on this previous work, we’ve taken a big data approach to understand how the numerous factors interact. Data analysis takes the guesswork out of piecing together the various factors contributing to satiety.
Our multivariate analysis shows that it’s not just protein leverage or energy density. Instead, it’s both and more!
Our New and Improved Satiety Algorithm
We now have access to 838,686 days of macronutrient data and 316,836 days of micronutrient data from our Optimisers and the NHANES nutrition surveys. This data helps us to understand the factors that align with eating more or less across the whole day (not just over two hours) with greater precision than ever!
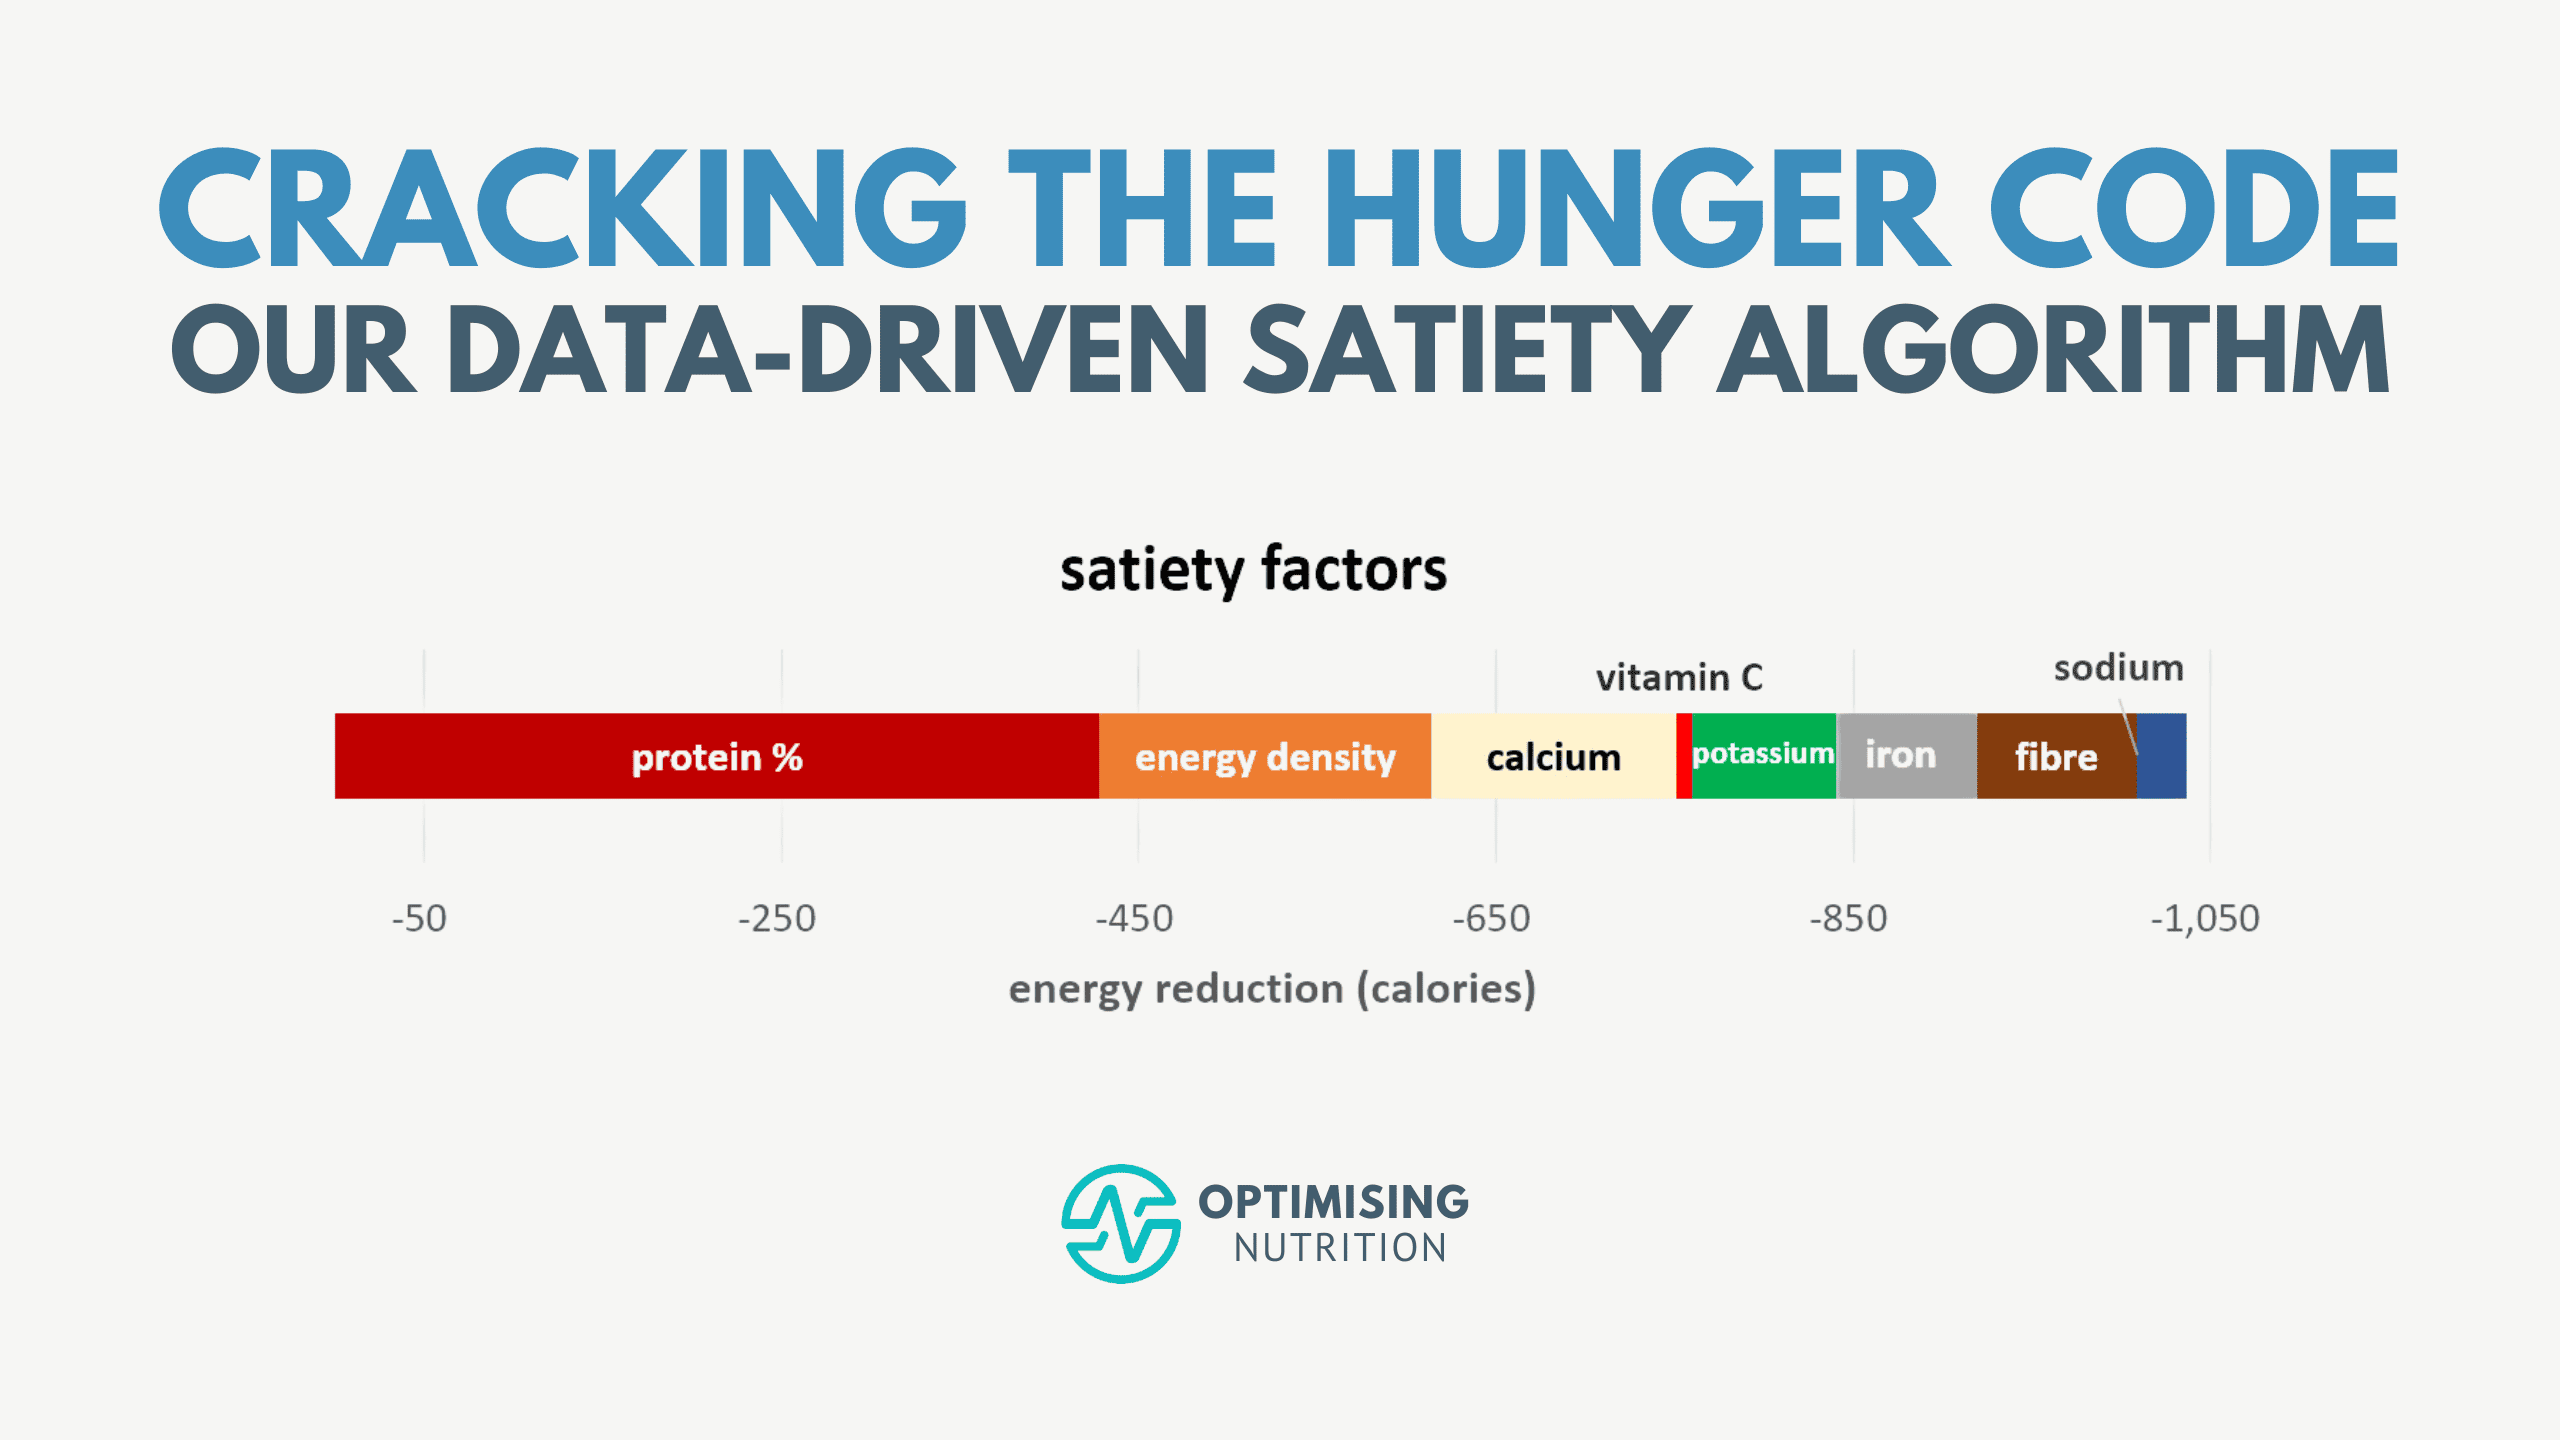
As shown in the chart below, we found that the following nutritional factors play a statistically significant role in the satiety equation:
- protein,
- energy density,
- calcium,
- potassium,
- iron,
- sodium,
- fibre and
- vitamin C.

Rather than merely protein leverage, there appears to be a nutrient leverage effect for other nutrients. The nutrients that we appear to crave have decreased so much in our food system that they are now nutrients of public concern. No wonder we crave them and are more satiated when we get more of them in our food!
For more details on the satiety response to each of these nutrients, see:
- Unlocking the Secrets of Minerals: The Hidden Power Behind Our Hunger and Cravings
- The Role of Vitamins in Satiety and Weight Management
- Optimal Amino Acid Intakes for Satiety and Weight Loss
Different Diets, Different Satiety Factors
Satiety is not a one-size-fits-all formula. People with different dietary preferences intuitively know that different foods help them feel satisfied with their preferred dietary approach.
We examined the data and found that different subsets of the population have unique cravings depending on the nutrients they lack.
So, we divided the data into three subsets:
- low protein (i.e. less than 12.5% protein)
- low fat (with the majority of energy from carbs), and
- low carb (with the majority of the energy from fat).
Our multivariate analysis enables us to calculate the precise weighting of each satiety factor for each population subset. Overall, we are satisfied with foods that provide more nutrients that we tend to lack on that diet. Filling in the nutrient gaps provides greater satiety.
Low fat
Per Professor Roll’s research, energy density is the dominant satiety factor if you’re on a low-fat diet. But potassium, calcium protein %, iron and sodium empower us to more accurately predict how much you will eat if you’re on a low-fat diet.

Low Carb
Meanwhile, protein leverage dominates for those on a lower-carb diet, in line with Raubenheimer and Simpson’s protein leverage approach. But calcium, potassium, and sodium, which can be harder to find on a lower carb with less plant-based foods, further augment our prediction of how much you’ll eat when most of your energy comes from fat rather than carbs.

Low protein
Then, we have the low protein data. Surprisingly, the analysis shows that protein isn’t more satiating if you’re on a low-protein diet. But it makes sense that people with a very low-protein diet crave more protein. Instead, if higher protein foods are available, they’ll eat more.

The analysis shows that people who consume minimal protein also crave more iron, which tends to be lower in a diet with minimal meat, seafood or dairy.
Analysing the unique satiety response to very low-protein foods helps us to account for the higher satiety response we tend to see from very low energy density, low protein plant-based foods (e.g. potatoes, fruit, etc) which have low protein but are still hard to overconsume.
Applications of the Satiety Algorithm
While it’s taken a lot of work to fine-tune the satiety algorithm, we’ve already used it in several exciting applications.
The Satiety Index Score
If we combine these three algorithms, we can accurately predict how much people will eat based on the nutritional properties of their food. We can assign their current diet a satiety index score.
The chart below shows the relationship between the satiety score and the data used to calibrate it. The shading behind the blue line is the 99th variance. The fact that these are so tight demonstrates that this relationship is robust and not due to chance.

Range of Satiety Index Score
The chart below shows the distribution of Satiety Scores from the 316,836 days of data, with an average satiety index score of 42%.
A satiety score of 100% is hard to achieve. While possible, you don’t need to, especially if you want to make sustainable progress towards your weight loss goal.

Instead, we guide our Optimisers to progressively tweak their diet to increase their satiety score until you see the progress they desire (e.g. weekly weight loss of 0.5 to 1.0%).
Conversely, if you wanted to gain weight or eat more to support a lot of activity, you would want to adjust your diet to reduce your satiety index score.
High Satiety Index Foods
The obvious place to start is to create a list of high-satiety foods that people can add to their diet to increase their satiety. To learn more about which foods are satiating, you can download the infographics and full food lists in our Optimising Nutrition Community here.

Satiety Index Foods Chart
If you enjoy the data, you can dive into the interactive Tableau version of our food lists here. The colouring is based on the satiety index score in this chart, created for Optimisers in our Macros Masterclass.

The x-axis is protein in grams per serving, while the vertical axis is protein %. Notice how, while high-protein foods are satiating, low energy density, low-protein plant-based foods also get a high satiety score.
High Satiety NutriBooster Recipes
We’ve also used the satiety score to help Optimisers find recipes that suit their goals. The chart below shows the NutriBooster Recipe database that Optimisers use in our Micros Masterclass. Again, the colouring is based on the satiety index score. Similar to the foods chart, it’s interesting to see how some recipes with a lower nutrient density and protein % can be more satiating due to their lower energy density.

Create Your Perfect Day
But the most exciting application of the satiety index score is Your Perfect Day algorithm that we use in the Macros Masterclass.
Rather than trying to follow someone else’s meal plan or adding new and weird foods that you may not (yet) enjoy, the best place to start is with the foods you already eat. In the Macros Masterclass, after a few days of tracking their current diet, we run a report showing Optimisers which foods they should eat more to increase satiety and which ones they could eat less of.

The report also shows how they could tweak their current macros to level their satiety game. Because we want quick, overnight results, most of us are prone to swing to extremes that we all too quickly bounce back from.
The Your Perfect Day Report shows you how to adjust your diet with the foods you love to increase satiety and make the long-term progress you dream of.
Conclusion
Unlocking the satiety code through data-driven insights has the potential to revolutionise how we approach nutrition.
By understanding the symphony of factors that govern our hunger and fullness, we can make more informed decisions, foster healthier and nutritious eating habits, and pave the way for a healthier future.
More
- Satiety Index: Secret to Long-lasting Fullness with Fewer Calories
- The Blood Glucose-Fullness Connection: Improve Your Satiety Metabolic Health
- The Role of Minerals in Cravings, Hunger, Satiety and Health
- How to Maximise Satiety Per Calorie: A Guide to Eating Less and Feeling Fuller Longer
- The Most Satiating Foods to Crush Your Hunger More Efficiently
- Diet Quality and Weight Loss: A Deep Dive
- Level Up Your Health with Gamified Personalised Nutrition
- Macros Masterclass