

Are you curious about the dietary secrets that propel individuals to the pinnacle of our Diet Quality Leaderboard?
Unlike a one-size-fits-all approach, the journey to nutritional optimisation is as diverse as the global community embarking upon it.
This captivating exploration unveils the array of dietary strategies employed by our top optimisers from various corners of the globe, each with unique preferences and constraints.
From the heart of Pennsylvania to the bustling city of Toronto, discover how these individuals have tailored their diets to achieve exemplary nutrient density and how their stories can inspire your own journey towards nutritional mastery.
Get ready to delve into a world where food is not just about sustenance but a pathway to achieving optimal health and vitality.
Meet Our Optimisers, and Their Favourite Foods
During the final week of our Micros Masterclass, there is some hot competition to make it to the top of the Diet Quality Leaderboard. While the focus of the Micros Masterclass is to show newbies how to start their journey towards optional, veterans motivated to maximise their health and optimise their nutrient density tend to dominate the leaderboard.

This article will give you a peek at the foods our top Optimisers eat to maximise their nutrient density.
Lisa
First up, we have Lisa, who lives in Pennsylvania, USA.
After failing with Weight Watchers and being rejected from the expensive Spark People program for being ‘too broken’, Lisa has excelled at dialling in her diet over several successive Micros Masterclasses to optimise her health.
Once she learned to solve the puzzle of her nutrition by giving her body the nutrients it needed to thrive, everything fell into place, and Lisa lost an outstanding 16 lbs (7.3 kg), or 13% of her body weight!
For more of Lisa’s story, check our chat about her journey here.

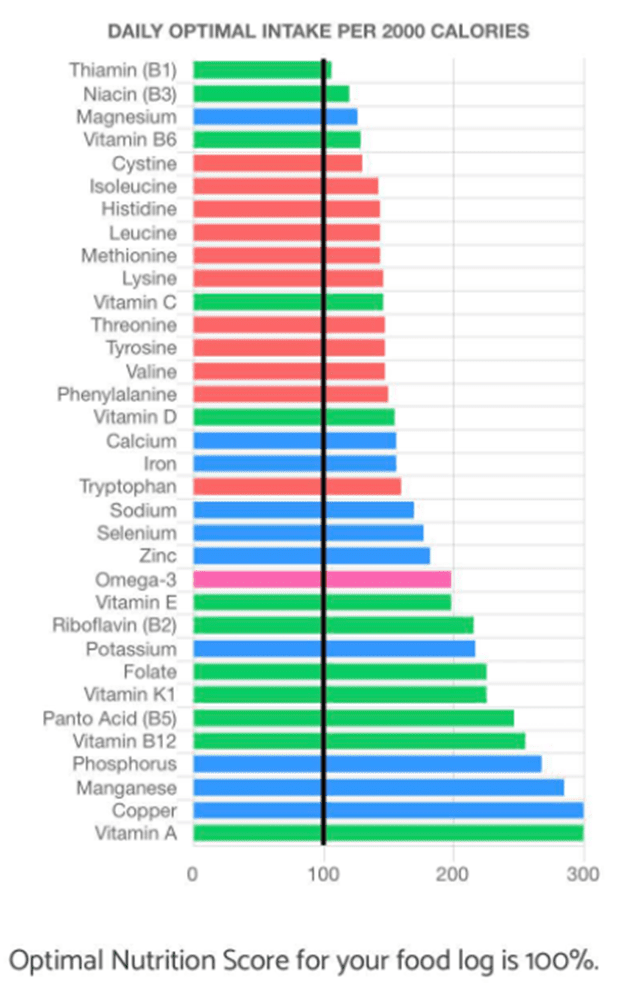
To explain a little about how nutrient density works, the chart below shows Lisa’s micronutrient intake during the final week of our last Masterclass, showing how she reached every stretch target for 100% of the Optimal Nutrient Intake targets!
- Towards the bottom of her nutrient fingerprint chart, we can see that Lisa is getting plenty of dietary vitamin A, copper, manganese and phosphorus.
- Towards the top, we can see she could focus on getting more nutrients like thiamine, niacin, magnesium and vitamin B6.
It takes some trial and error to balance your diet at the micronutrient level to achieve a 100% Diet Quality Score. In the Micros Masterclass, we start with your current diet and identify which of your everyday foods you need to increase vs decrease to balance your diet at a micronutrient level. From there, you can use Nutrient Optimiser to identify some new foods and meals that will help you get more of the cluster of micronutrients towards the top of your unique fingerprint chart that will help you plug your nutritional gaps.
In terms of macros, her diet in the final week of the Masterclass was:
- Energy = 1344 calories
- Protein = 137 g (41%)
- Fat = 61 g (41%)
- Net carbs = 46 g (14%)
- Fibre = 4%.
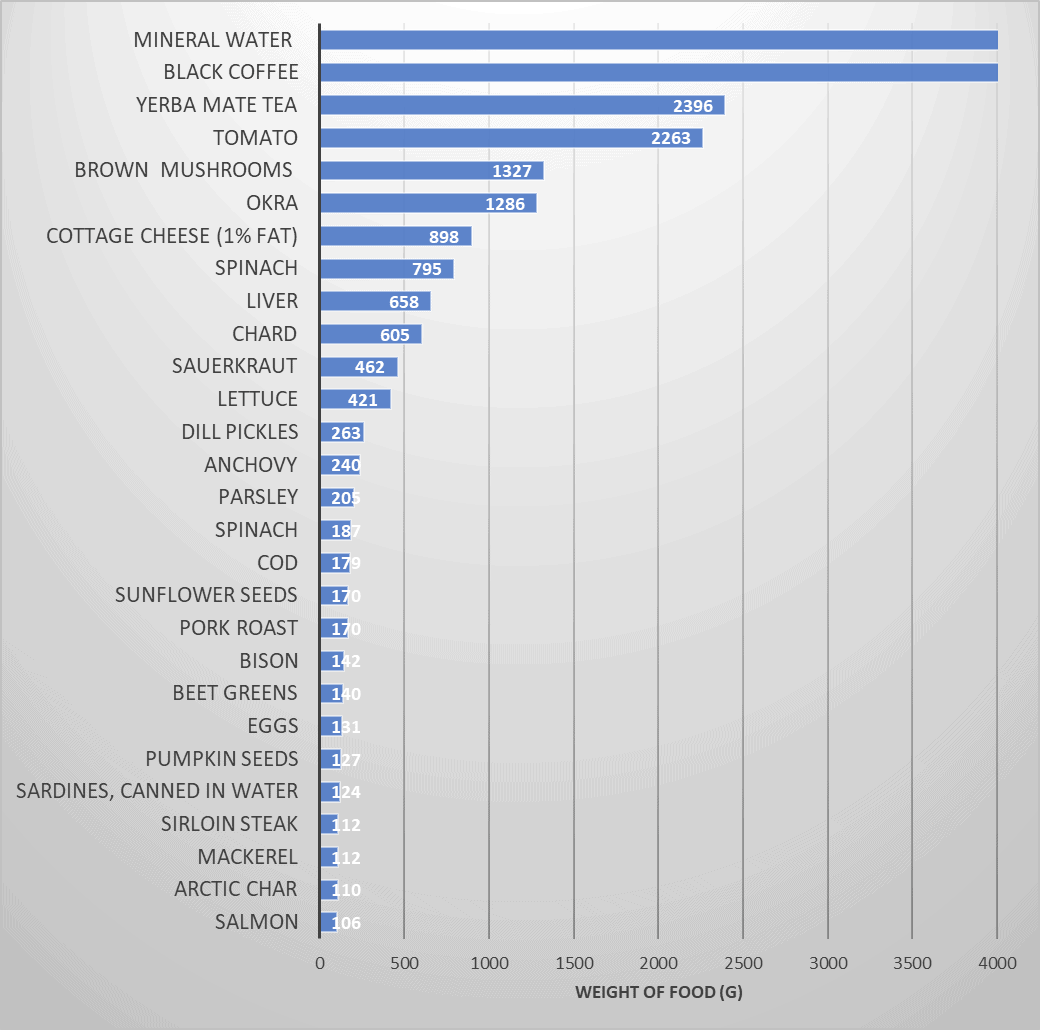
The chart below shows Lisa’s top 30 foods ranked by weight.
- You can see that she drank plenty of mineral water, coffee, and tea.
- Her top foods by weight were tomato, mushrooms, okra, cottage cheese, and spinach.
If you looked at the food on Lisa’s plate in terms of the volume it takes up, you might consider it a ‘plant-heavy’ diet. However, we get a different picture when we look at Lisa’s top 30 foods in terms of calories. From an energy perspective, her top foods are:
- liver (beef and chicken),
- sunflower seeds,
- pumpkin seeds, and
- cottage cheese.

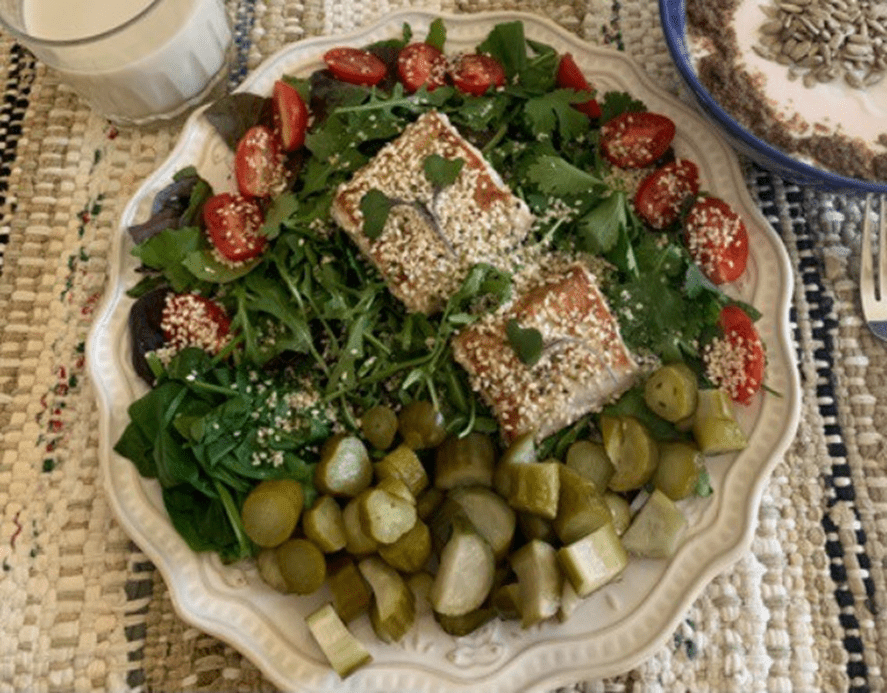
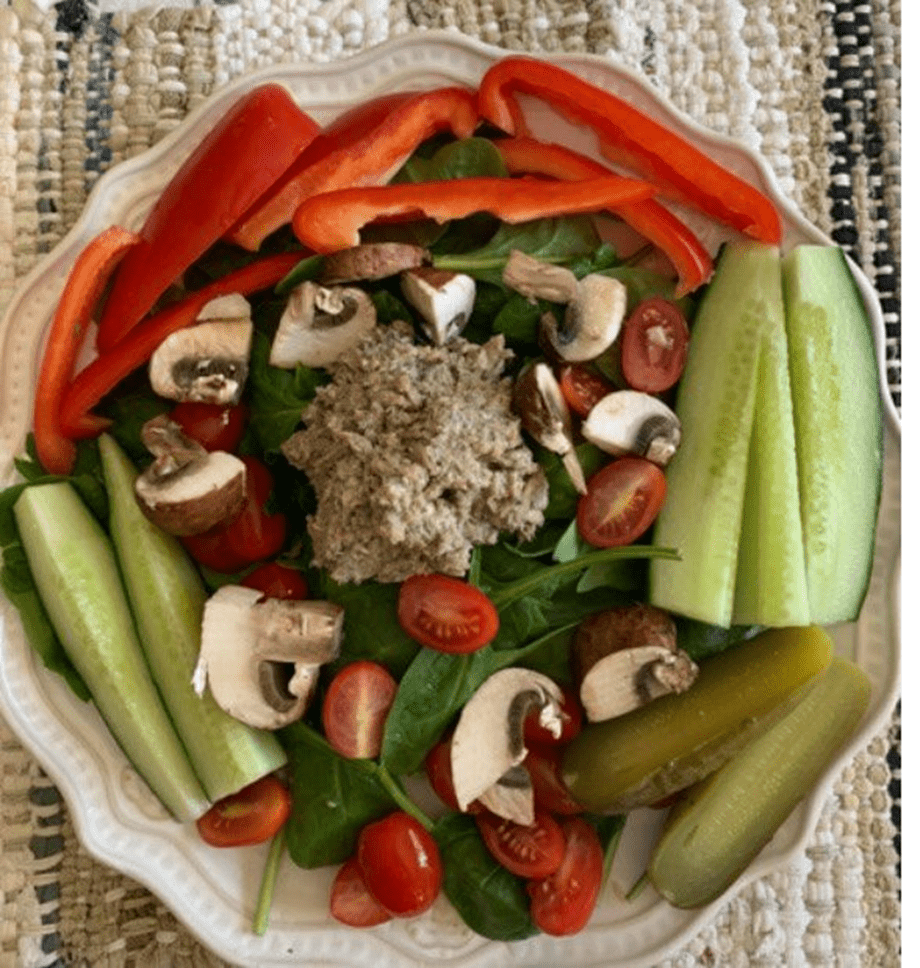
Beyond the numbers, the photos of Lisa’s meals below will give you a feel for what this looks like visually.

Lisa said,
“It’s truly gold! The word just has to get out. I’m so happy to be a part of it. It’s such an important message and opens the door to self care and healing in a way that no government or medical system will do.”
Karen
Next, we have Karen from Toronto, Canada.
Unlike Lisa, Karen doesn’t eat a lot of liver. That’s because Karen is a vegetarian.
Despite this, she still managed to get a 100% Diet Quality Score in the final week of the Masterclass three times in a row!
Like Lisa, Karen struggled a lot with her health over the years. Thus, she has been highly motivated to dial in her nutrient density to improve her health while staying true to her vegetarian convictions.
You can learn more about Karen’s nutrition and health adventure in this article and interview.

You can see from Karen’s micronutrient fingerprint that she needs to prioritise foods that are often hard to find in a vegetarian diet that contains more vitamin B6, B12, zinc, and omega-3.
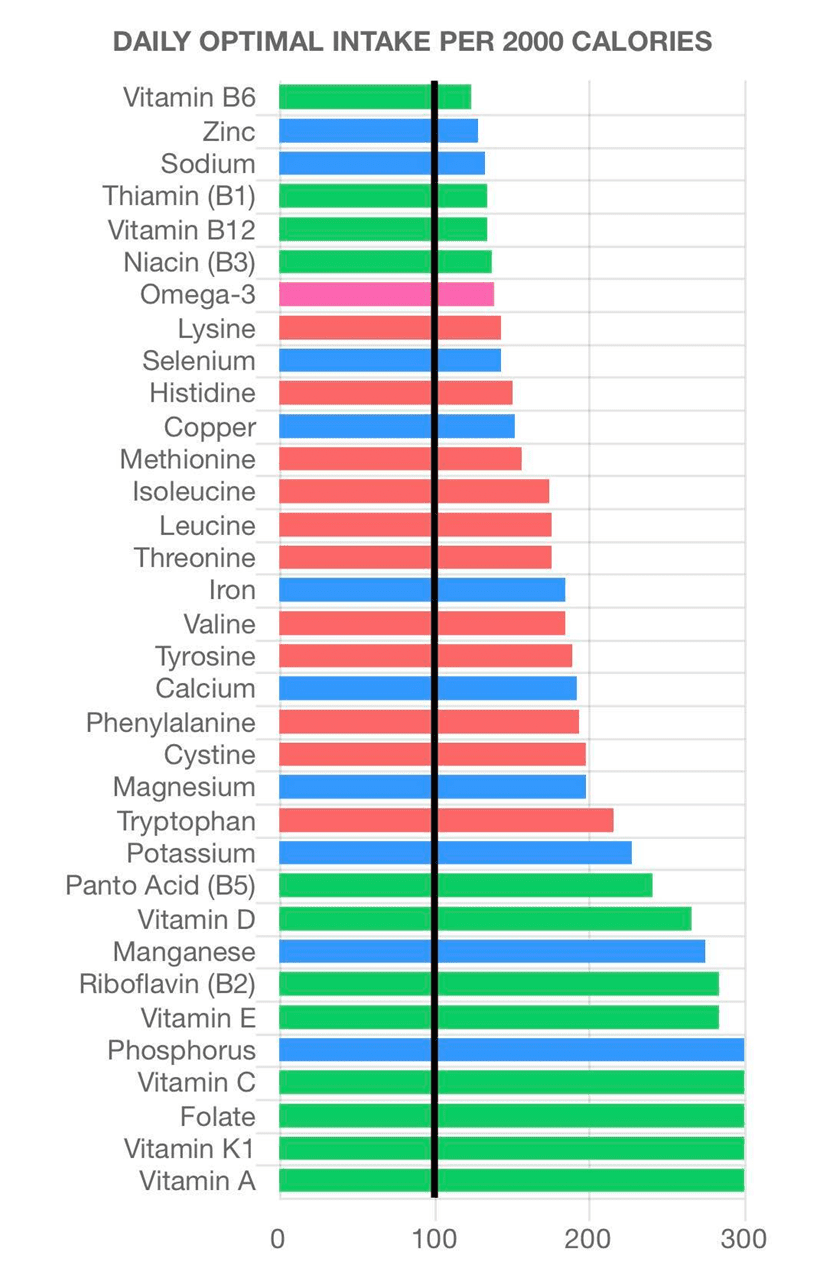
However, this ‘handicap’ has only motivated her to strive harder and dial in all her micronutrient goals while staying within her dietary constraints. And her determination has paid dividends in terms of weight loss, body fat and improved blood sugars! Just like Lisa, when Karen prioritised giving her body all the micronutrients it needs from food, everything else fell into place!

In terms of macros, Karen’s final week was:
- Energy = 927 calories
- Protein = 104 g (45%)
- Fat = 28 g (27%)
- Net carbs = 47 (20%)
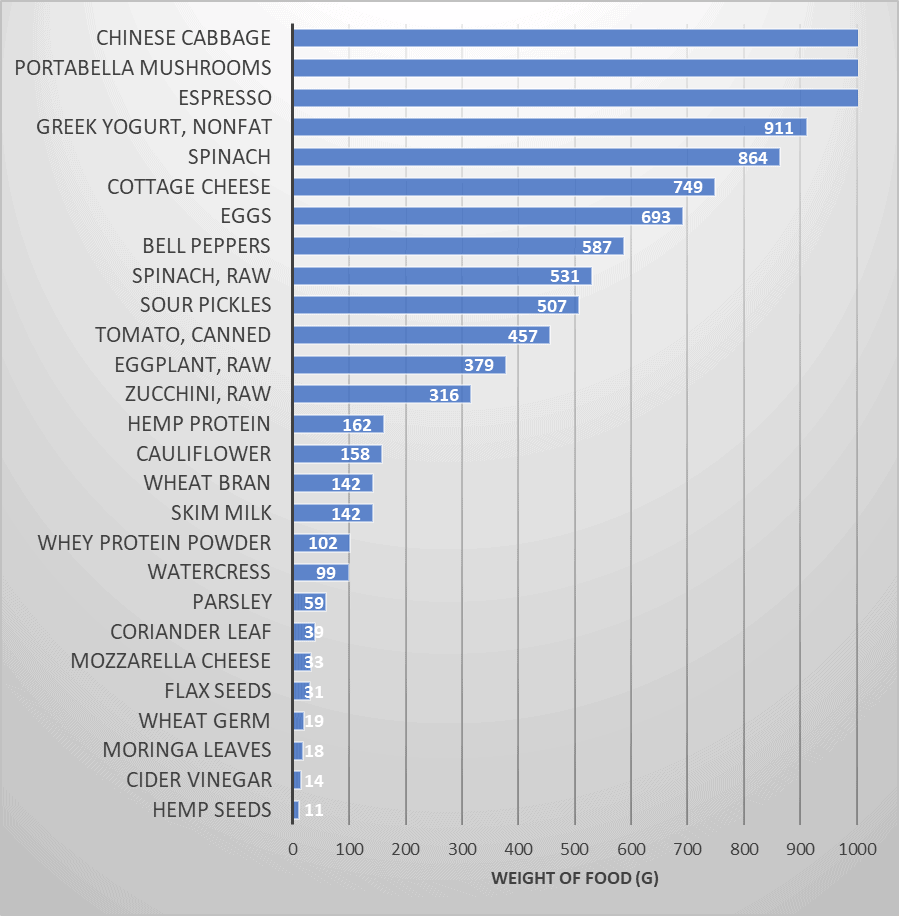
The chart below shows the breakdown of Karen’s food by weight. Chinese cabbage, mushrooms, Greek yogurt, cottage cheese, eggs, and spinach ranked at the top.
The following chart shows most of Karen’s energy comes from eggs and dairy products like cottage cheese, protein, Greek yoghurt and protein powder. While the Chinese cabbage, mushrooms, and spinach may take up a lot of volume on her plate, it doesn’t provide the bulk of her protein or calories.

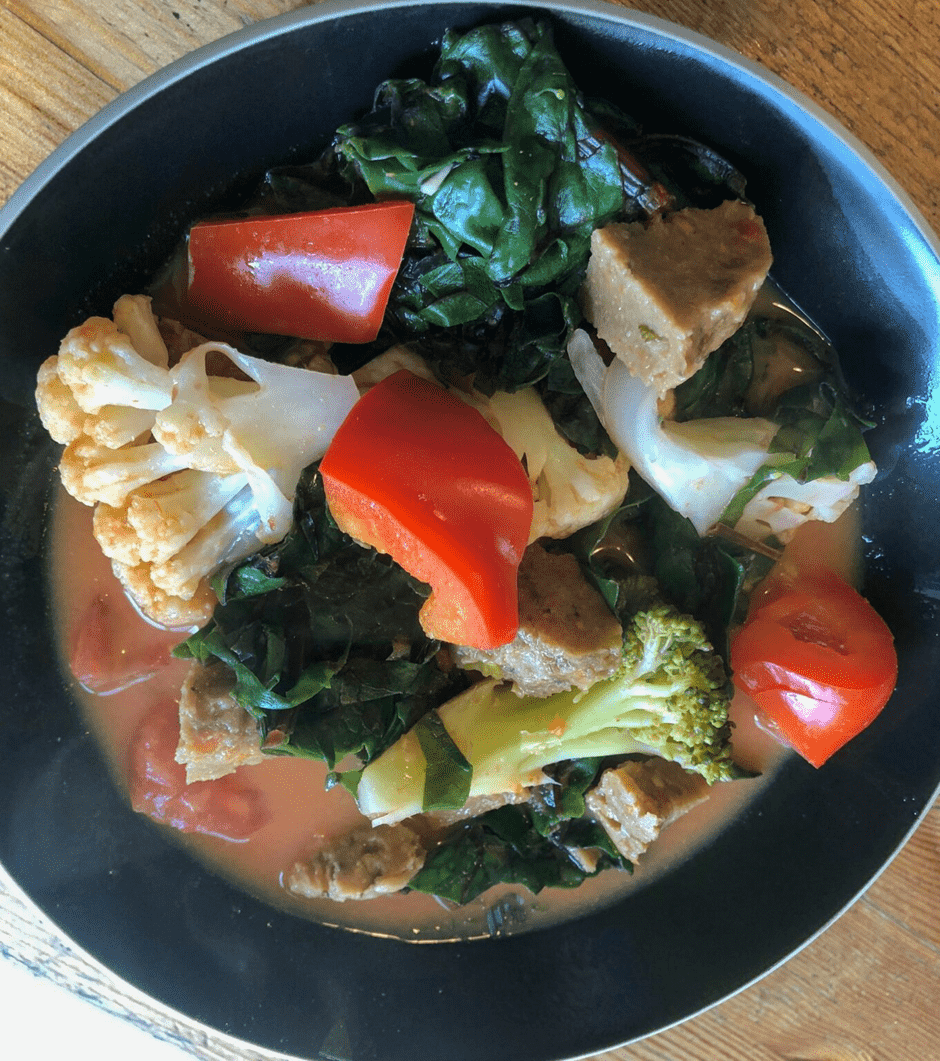
The photos below offer a glimpse into some of Karen’s bright, colourful, nutritious and tasty meals.


Karen said,
“I love how you can do this so many ways, and ultimately your way, or rather each in their own way.”
Oddný
Next up, we have Oddný who is a midwife from Neskaupstadhur, Iceland.
While her fingerprint chart shown below is unique to her diet and the native foods available in Iceland, she scored a perfect 100% Diet Quality Score!
In terms of macronutrient breakdown, Oddný’s final week of the Masterclass consisted of:
- Energy = 1282 calories
- Protein = 133 g (41%)
- Fat = 44 g (31%)
- Net carbs = 59 g (18%)
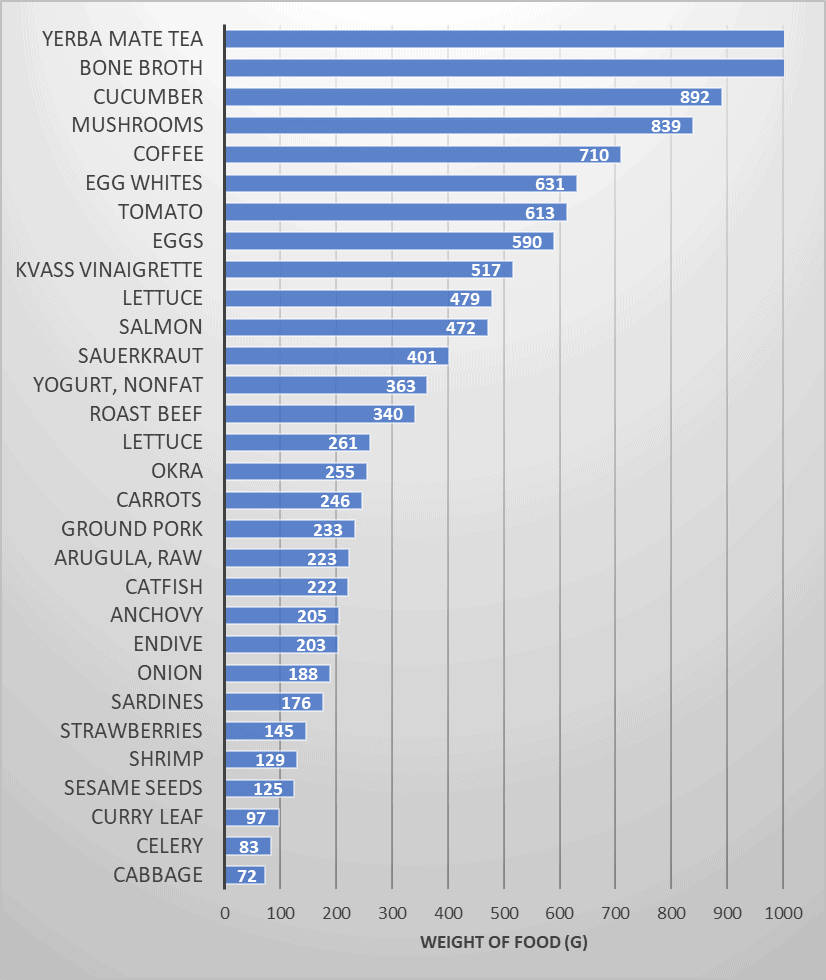
The chart below ranks Oddný’s main foods by weight. While coffee seems to be prevalent everywhere, the rest of her traditional Icelandic diet is mostly seafood-based.
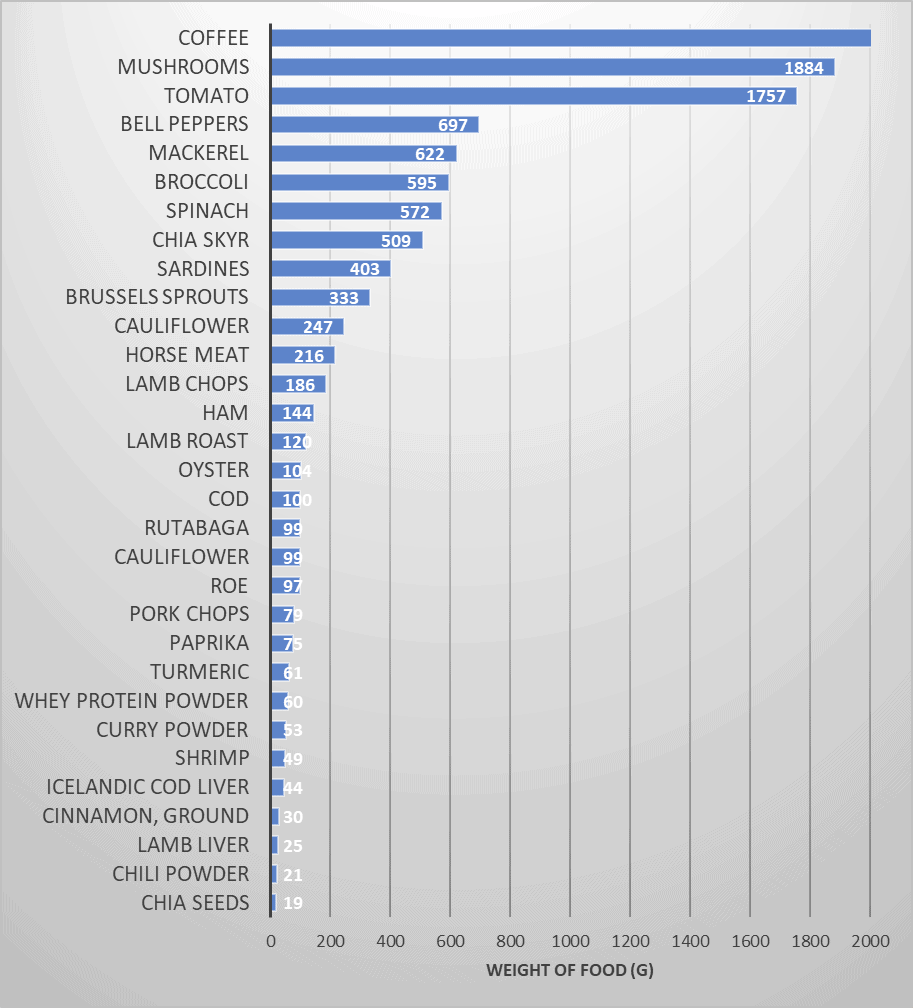
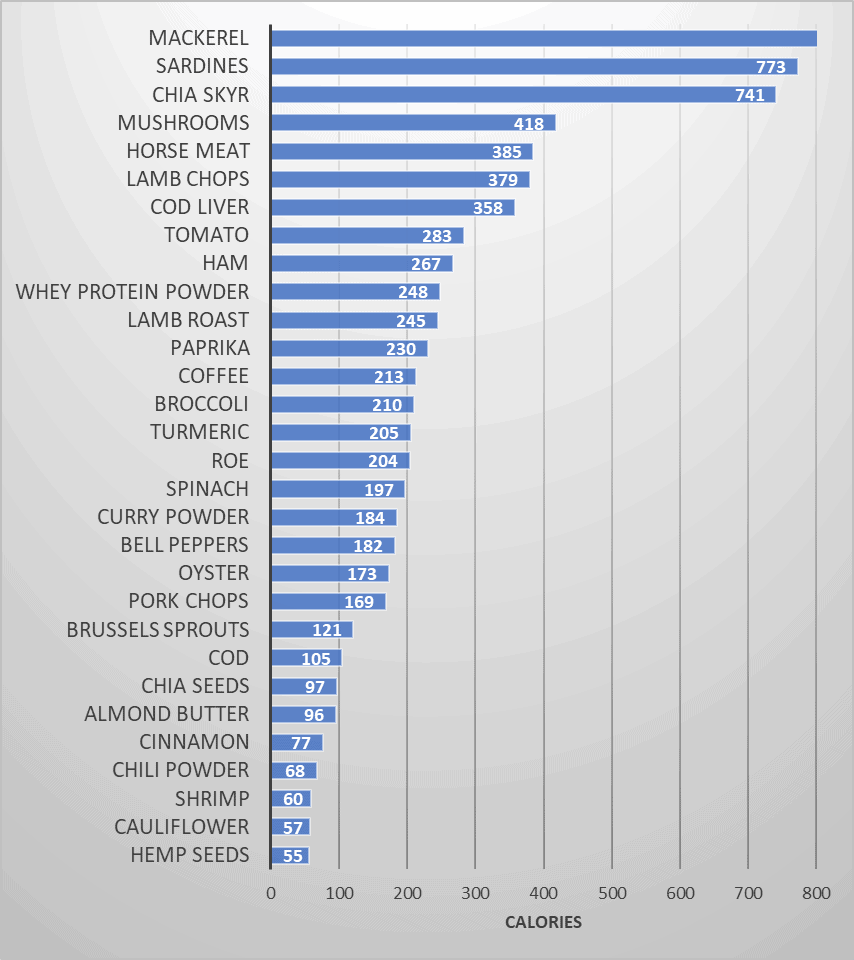
The chart below shows the foods Oddný ate during her final week ranked by calories, with mackerel, sardines and even horse meat ranking up top.
Oddný said,
“With Data-Driven Fasting and especially the Masterclass, I finally got the last 8 kg (18 lbs) off and reached my goal weight, losing 34 kg (or 75 lbs) since 2018”.
Michael
Next, we have Michael, an accountant from Brisbane, Australia.
When Michael first joined us, his head was full of questions and concerns about cholesterol, saturated fat, and “too much protein” from the plant-based longevity scene.
But before too long, he got his head around the idea of simply giving his body the nutrients it required without overconsuming energy. Pretty soon, everything else sorted itself out!
When he started his journey of Nutritional Optimisation, he was 116.5 kg (or 256 lbs). However, he has since lost a massive 39 kg (86 lbs) and reached his goal weight of 77.6 kg (171 lbs)! Michael is now working to build some strength and muscle.
We don’t care where you get your essential nutrients from, as you get them! Once you get essential nutrients from the food you eat, all the other minutia that most of the diet world seems to focus on quickly becomes irrelevant.
If you’re trying to get all your nutrients without excess calories, you needn’t worry about excess saturated fat, cholesterol, or *insert nutrient here* that the diet world is demonising or glorifying this week.
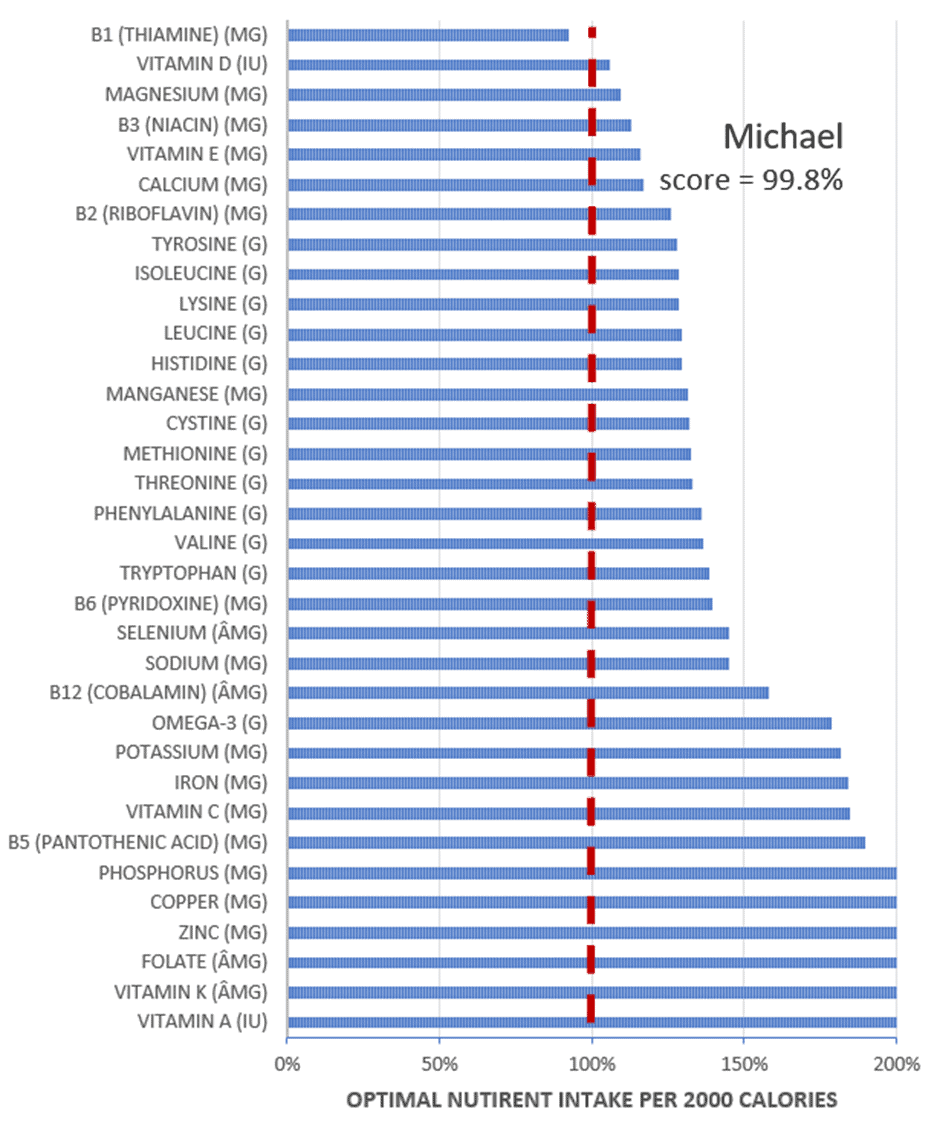
The chart below outlines Michael’s nutrient intake during his final week of the Masterclass. As you can see, Michael scored an almost perfect score! With just a little bit more vitamin B1, he would have hit 100%.
During the final week, Michael’s macronutrient split was:
- Energy = 1743 calories
- Protein = 196 g (45%)
- Fat = 79 g (31%)
- Net carbs = 38 g (9%)
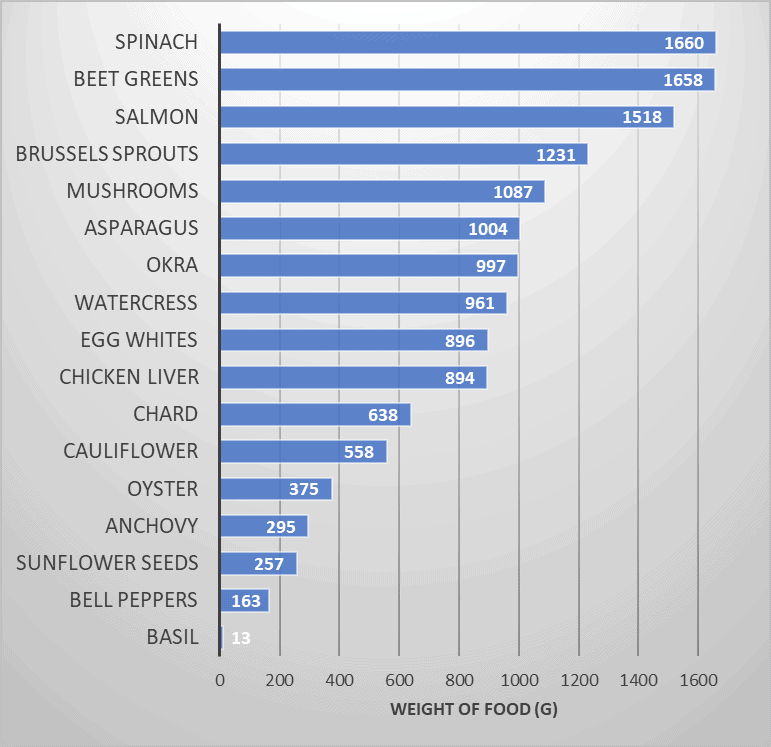
As the chart below shows, Michael developed a super simple shortlist of foods to maximise his nutrient density. By weight, he’s eating heaps of spinach, beet greens, Brussel sprouts, mushrooms, asparagus, and okra.
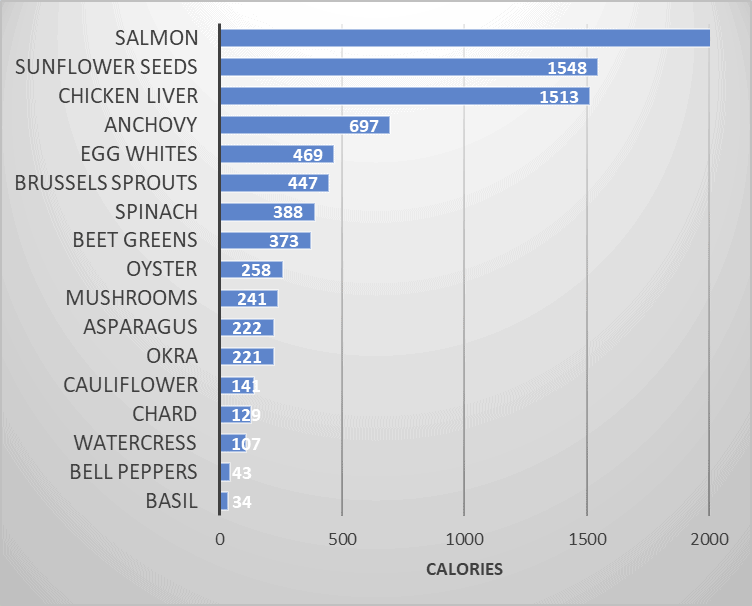
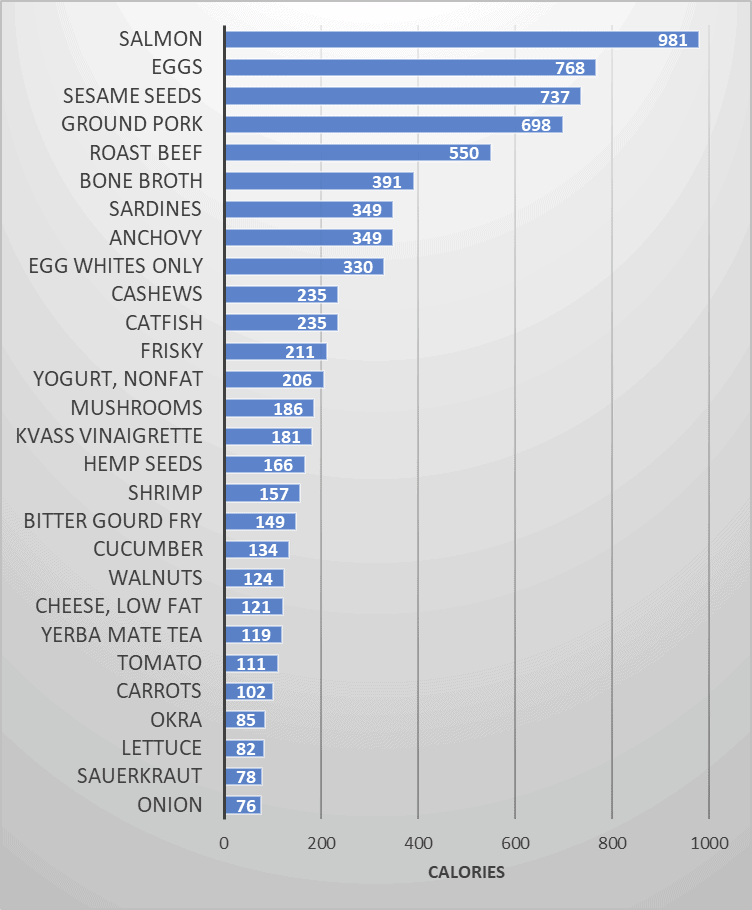
But when you look at Michael’s super-efficient food selection by calories, most of his energy comes from his protein sources, like salmon, liver, anchovies, and egg whites.
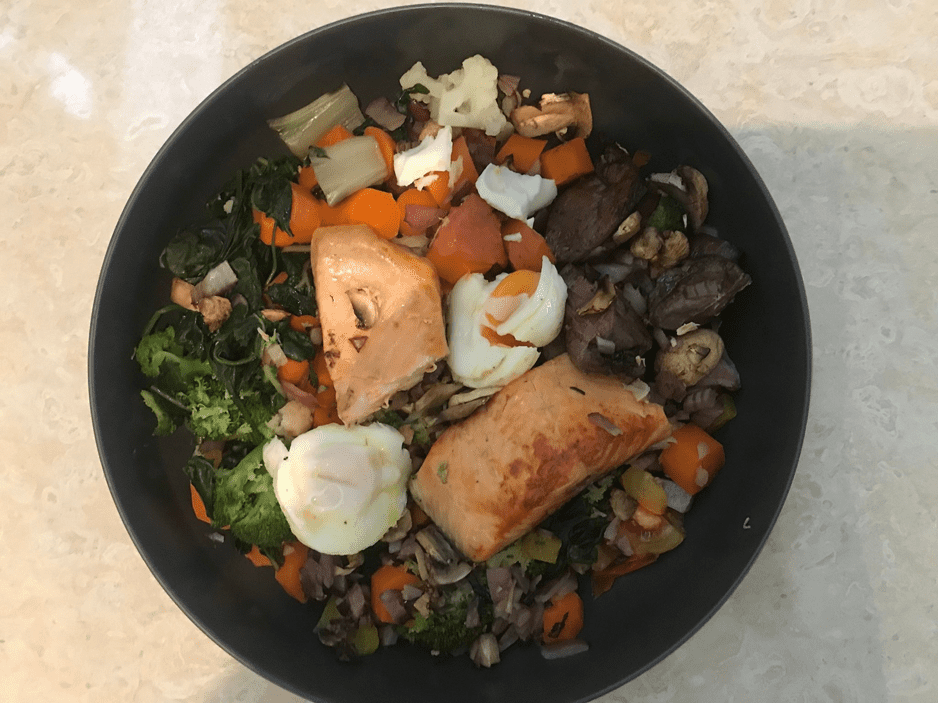
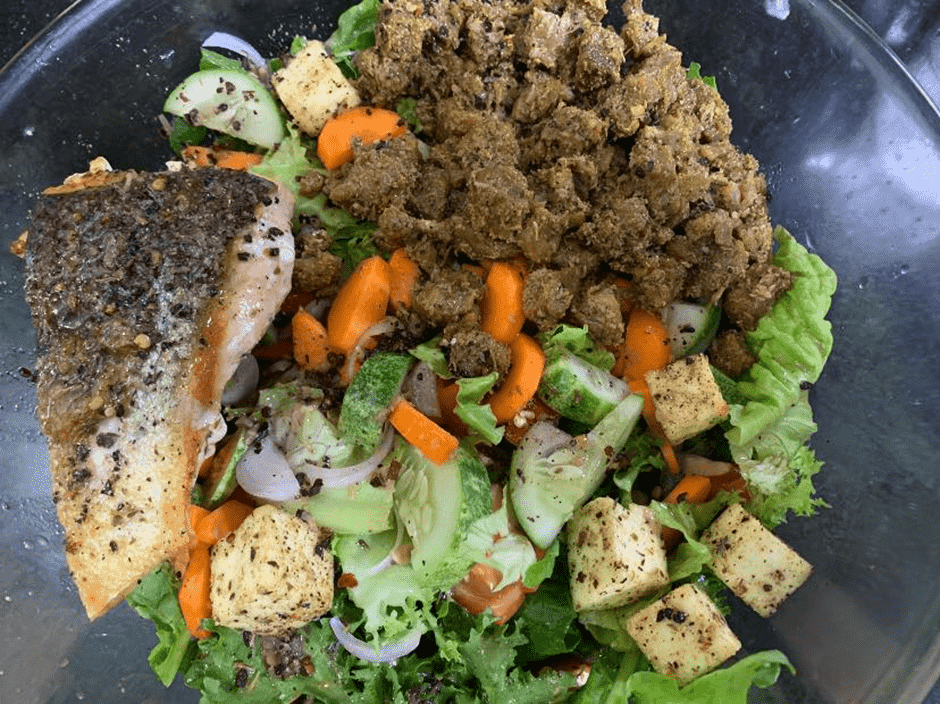
Kudos to Michael for his incredible efficiency to find the shortlist of foods that worked for him to solve his puzzle of optimal nutrition! Here’s what a typical meal looks like for Micahel in Australia. No magic or magical named diet required – just nutrient-dense food with plenty of colour and flavour because it contains the nutrients he needs!
Dorrie
Lastly, we have Dorrie, who lives in India. Most of the Indian population is vegetarian for religious reasons, making it more challenging to find bioavailable protein sources. Nevertheless, Dorrie has seen spectacular results since starting with our Data-Driven Fasting before moving on to the Masterclasses!


For more on Dorries’s story, check out this interview.
In terms of macros, Dorries final week of the Masterclass included:
- Energy = 1459 calories
- Protein = 152 g (42%)
- Fat = 61 g (37%)
- Net carbs = 62 (17%)
The chart below shows Dorries’s food selection, ranked by weight.
The following chart shows her foods ranked by calories.
Again, most of her calories come from her protein sources.
Summary Analysis
Before we finish, I thought it would be fun to summarise our five optimisers’ favourite foods and quantify some of their averages.
Macronutrients
In terms of macros, their average intakes per day are:
- Energy = 1351 calories
- Protein = 144 g (43%)
- Fat = 55 g (36%)
- Net carbs = 50 g (15%)
Whether we begin with dialling in our macronutrients to maximise satiety as we do in our Macros Masterclass, dialling in our micronutrients as we do in the Micros Masterclass, or dialling in our blood sugars for weight loss as we do in Data-Driven Fasting, we end up at similar macro splits.
Our analysis of 125,761 days worth of macronutrient and micronutrient data from 34,519 people shows that diet quality is maximised when:
- around 10 – 20% of calories come from non-fibre carbs,
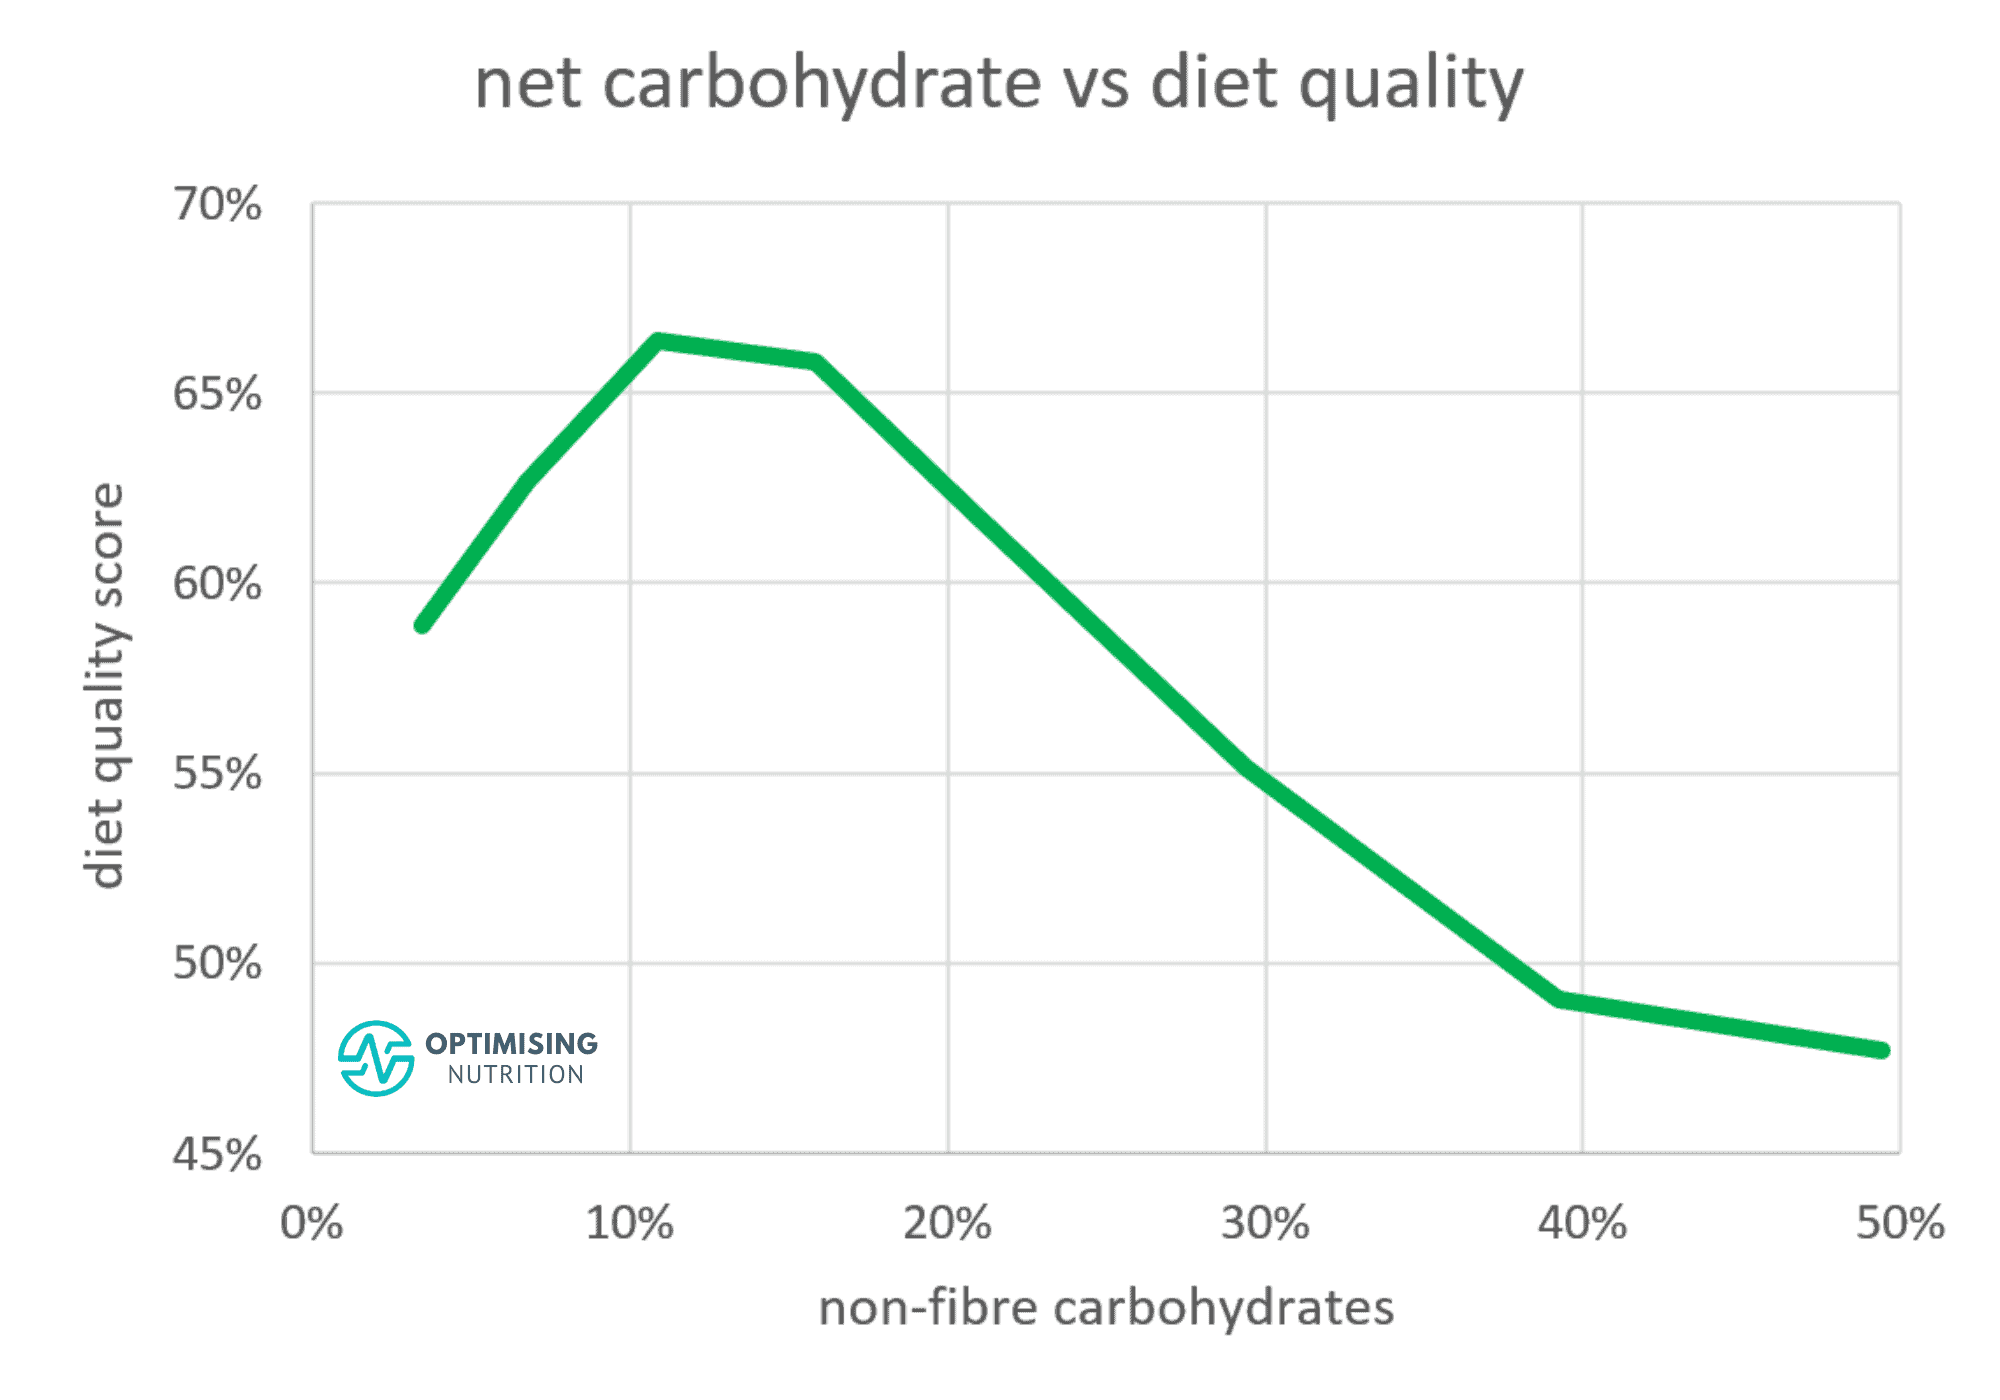
- fat is lower, rather than higher, and
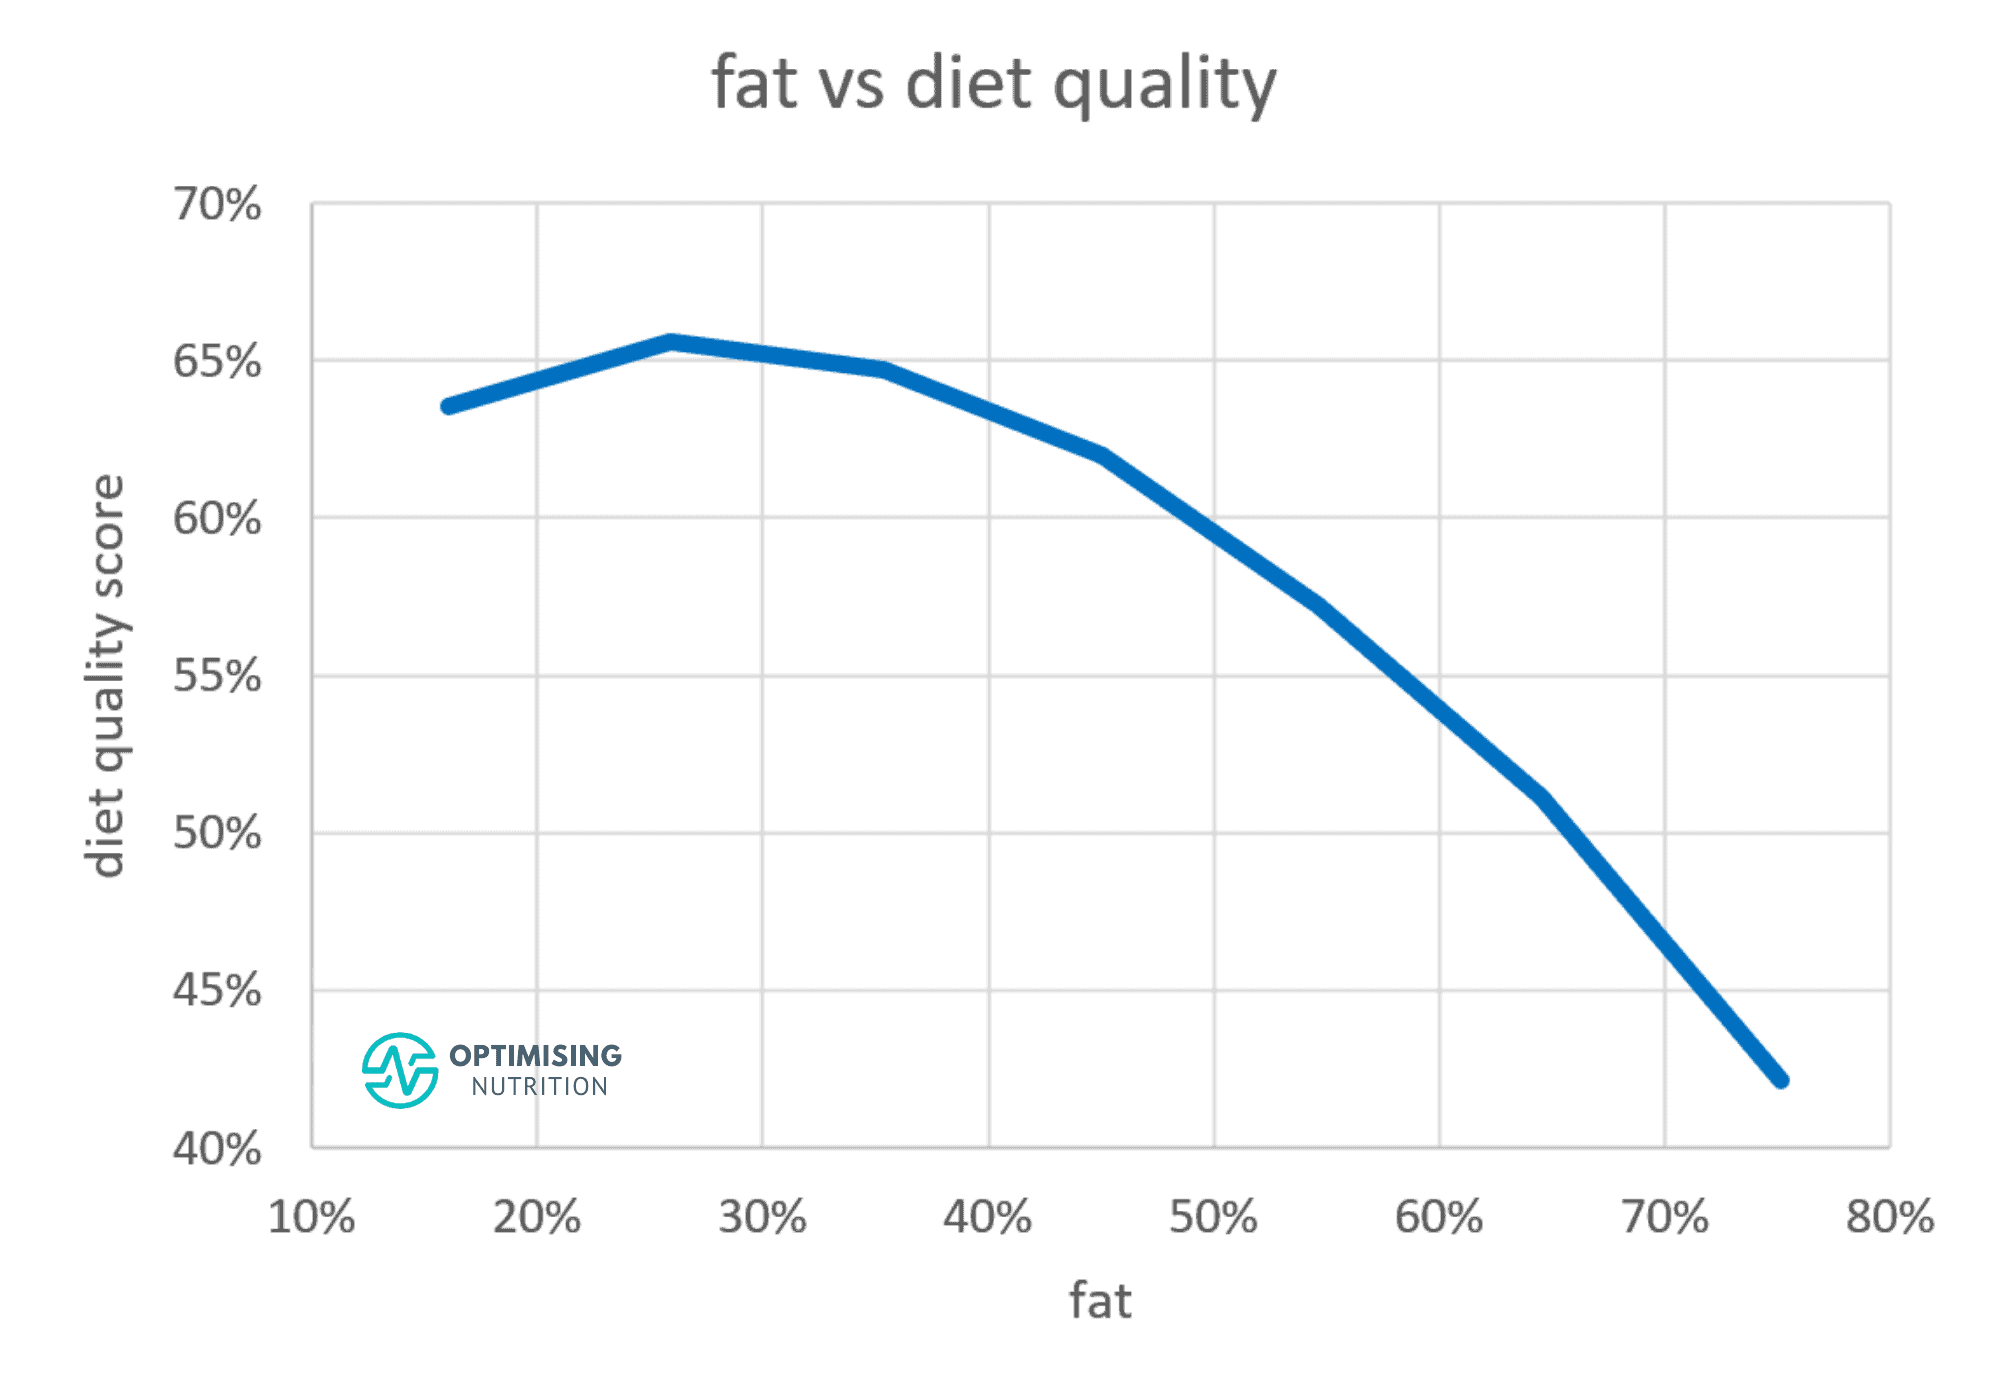
- protein is higher, rather than lower.
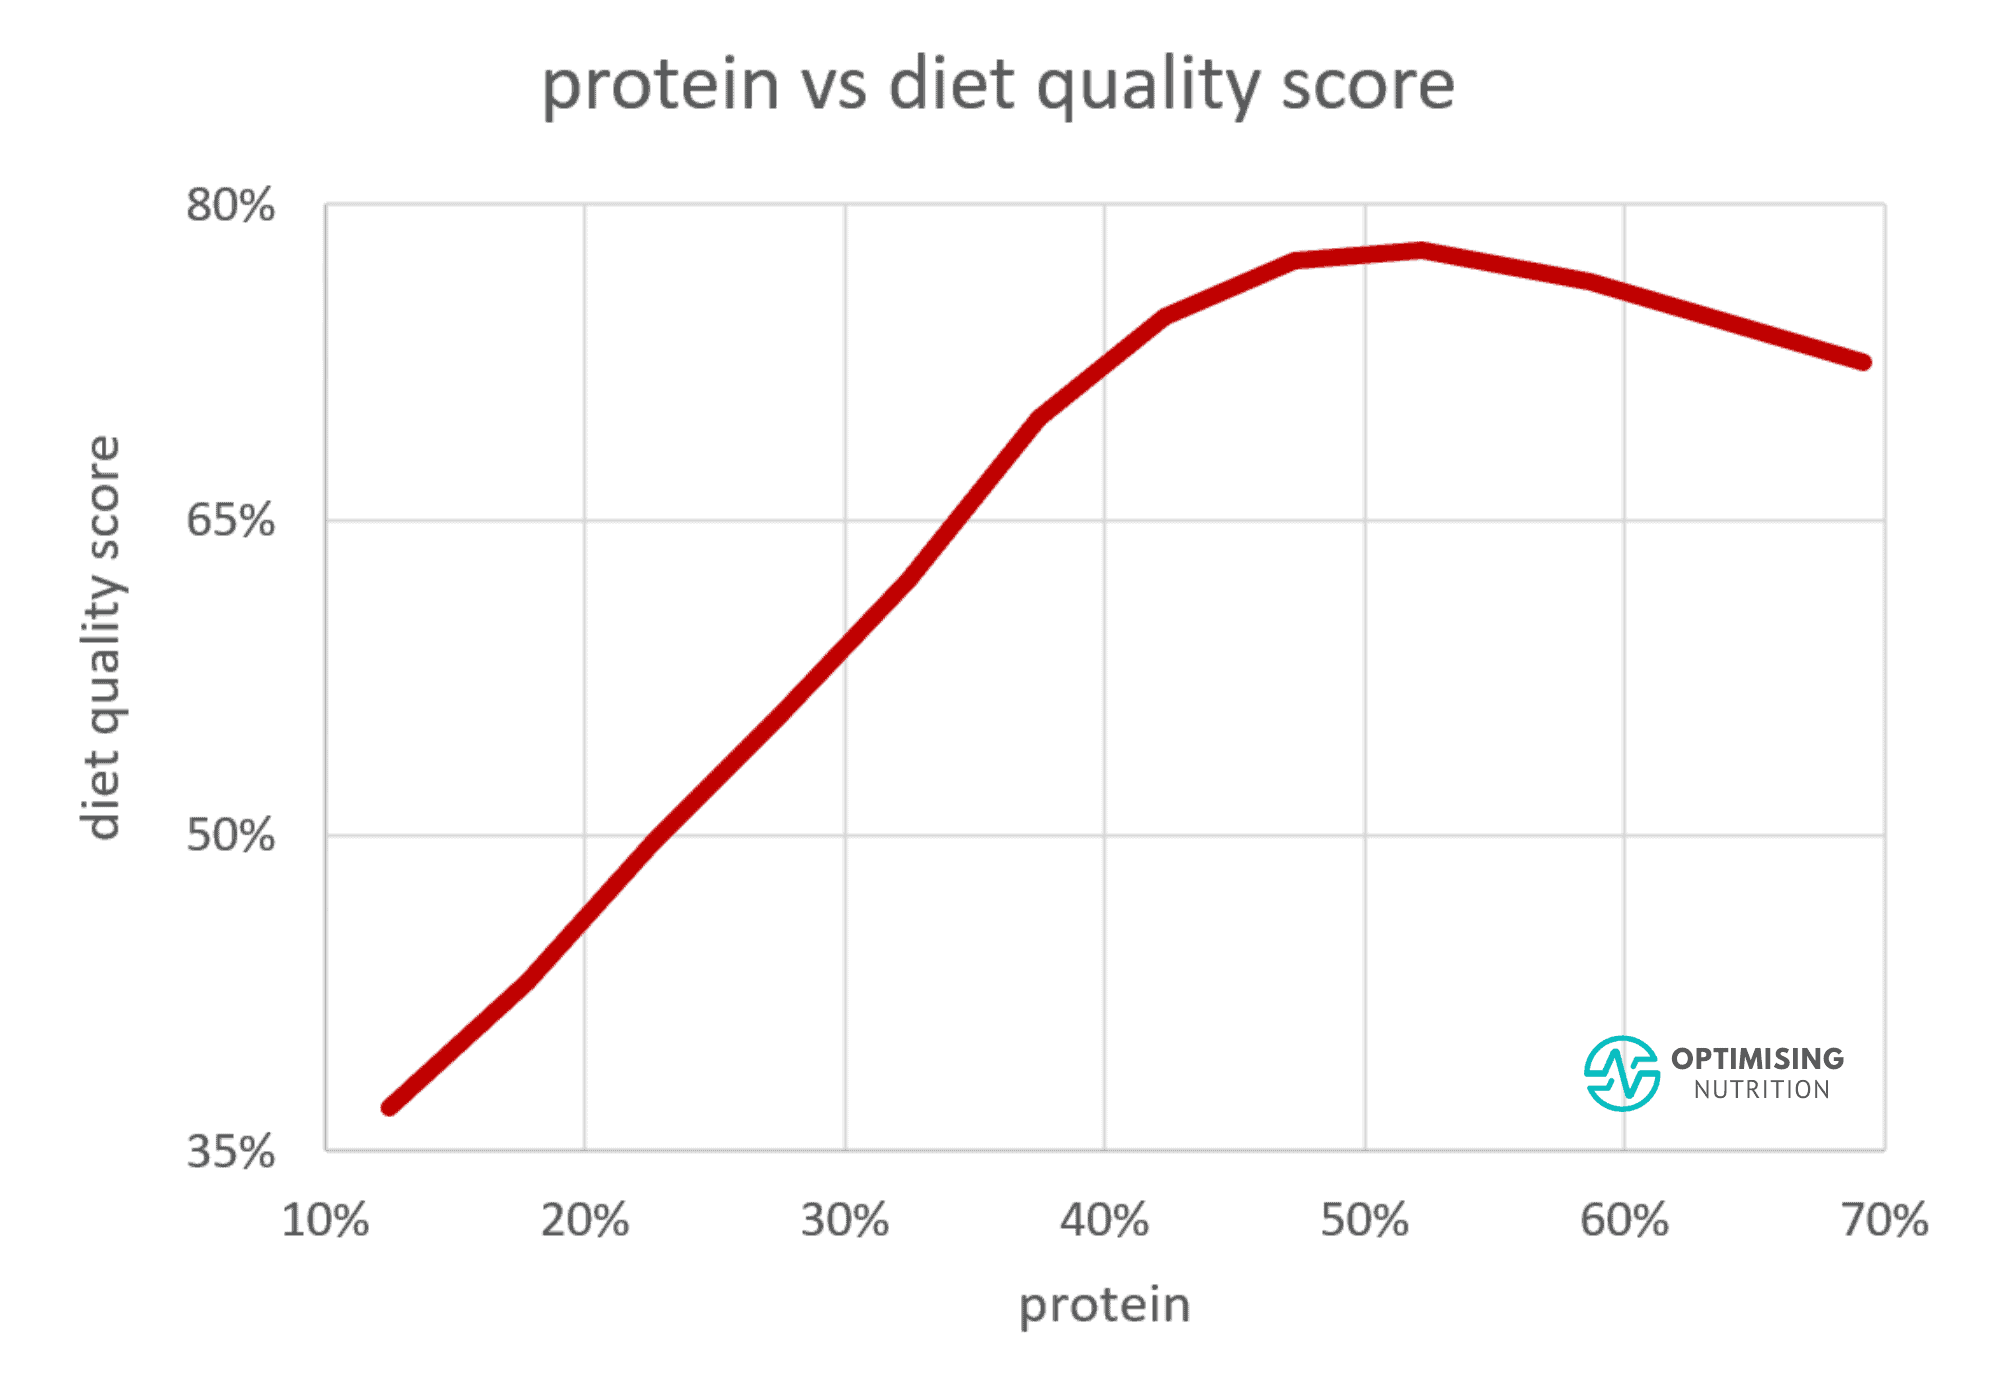
It’s no coincidence that we see the lowest calorie intake when a higher percentage of total calories comes from protein (a high protein %) and less energy comes from carbs and fat.
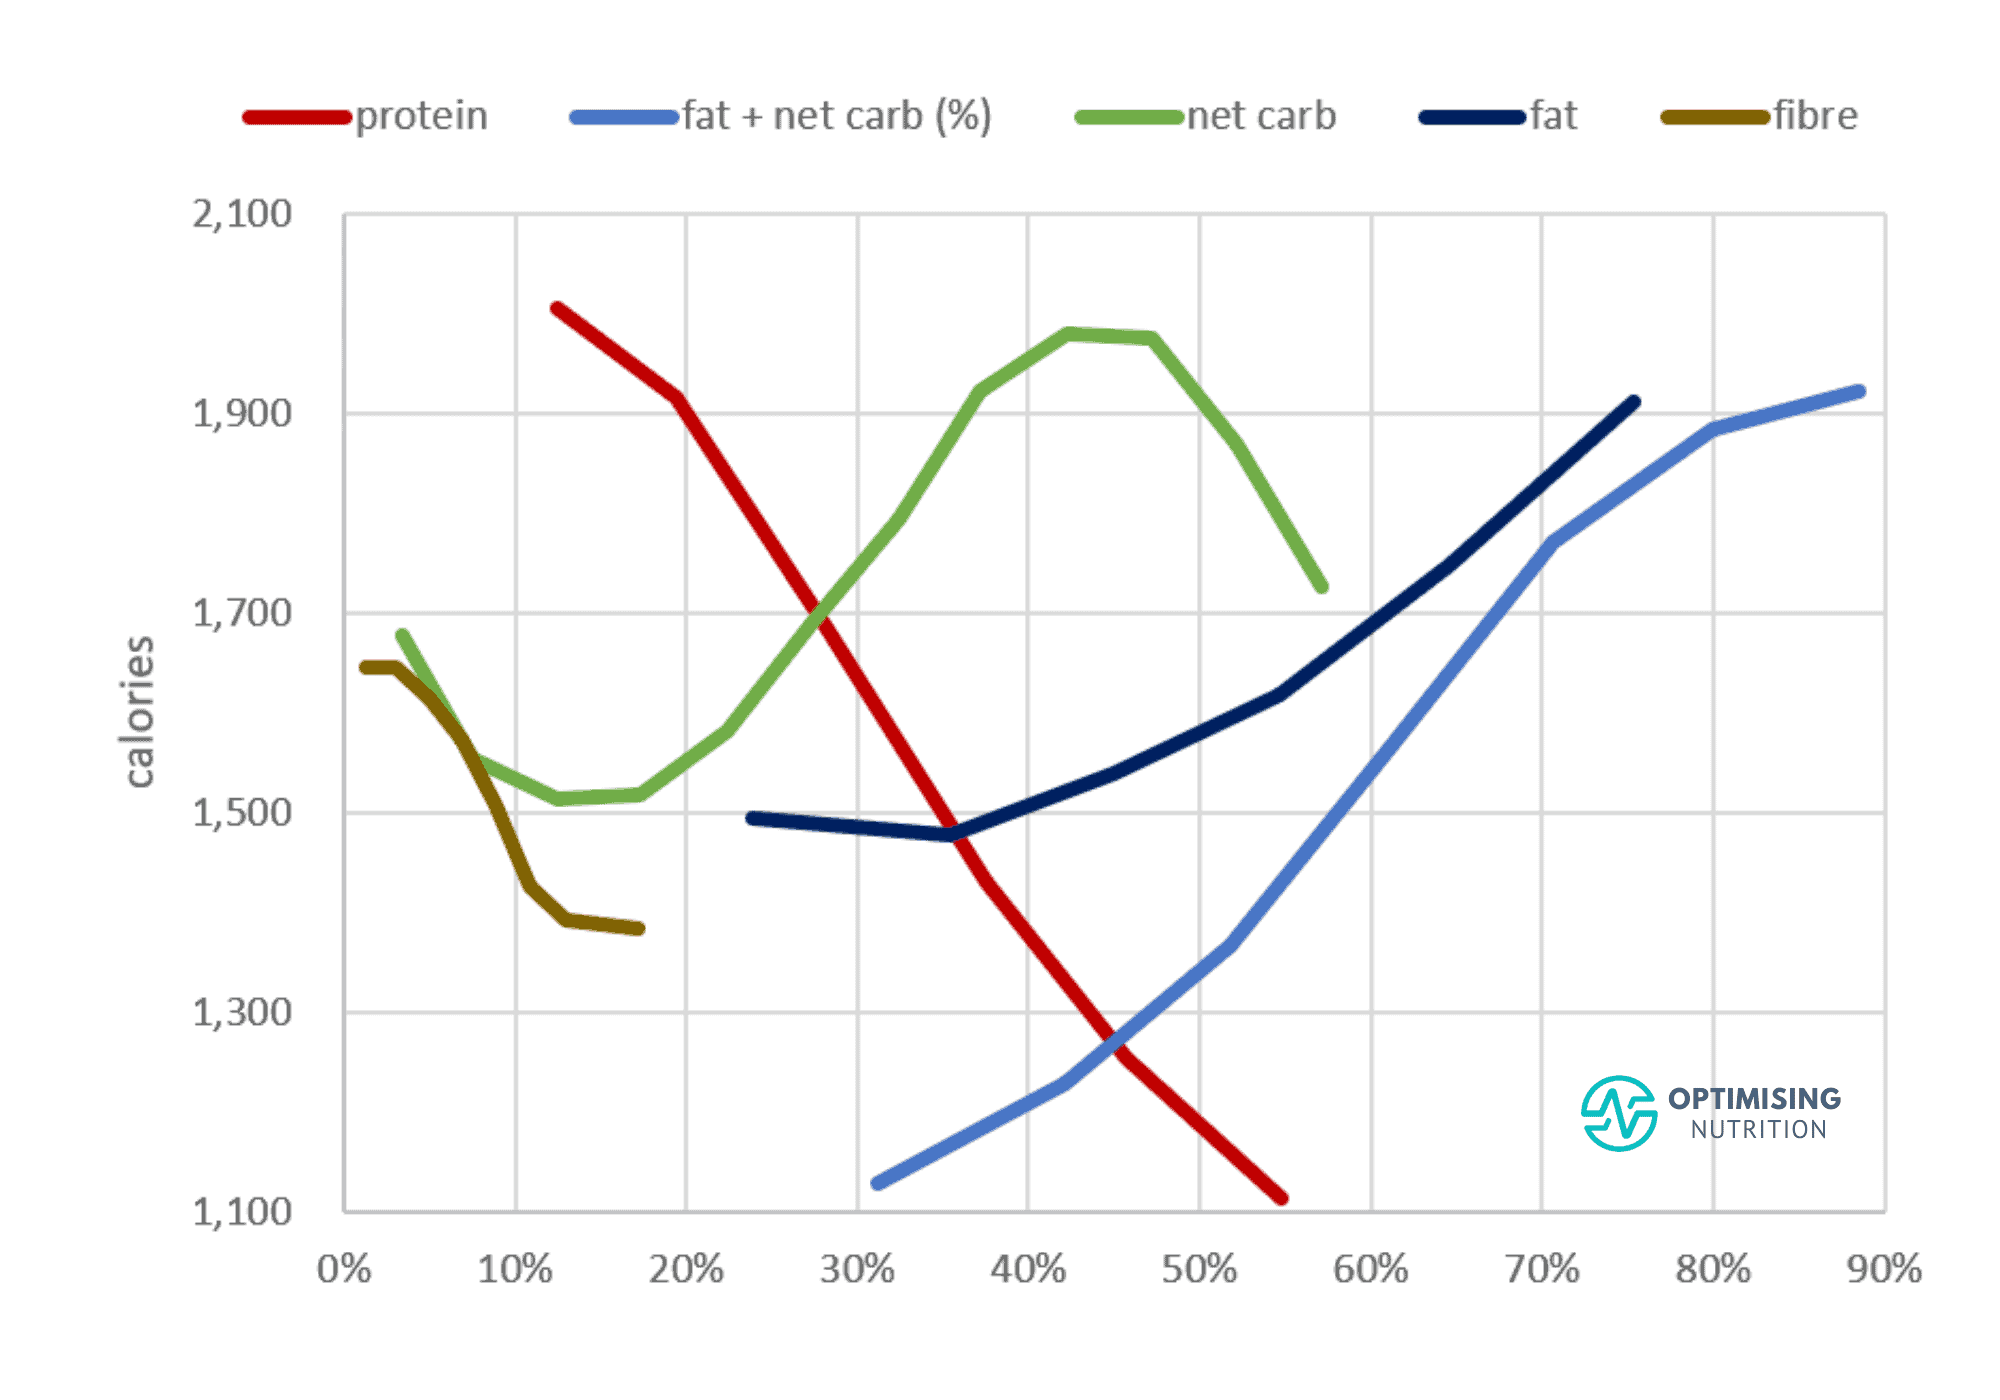
When we give our body the nutrients it requires to thrive and not just survive, our cravings subside, and we eat less!
Food – By Weight
The chart below shows our top five Optimisers’ most popular foods ranked by weight.

If you look at these foods based on the volume they take up on the plate, you might say a nutrient-dense diet is ‘plant-based’.
Food – By Calories
However, the next chart shows the most popular foods ranked by calories.

From this perspective, we see that foods foundational in all of their diets contain plenty of protein from seafood, animal-based foods and dairy.
Perhaps this is what a ‘balanced diet’ is meant to look like after all? You just need to look through the lens of micronutrients.
Next Steps
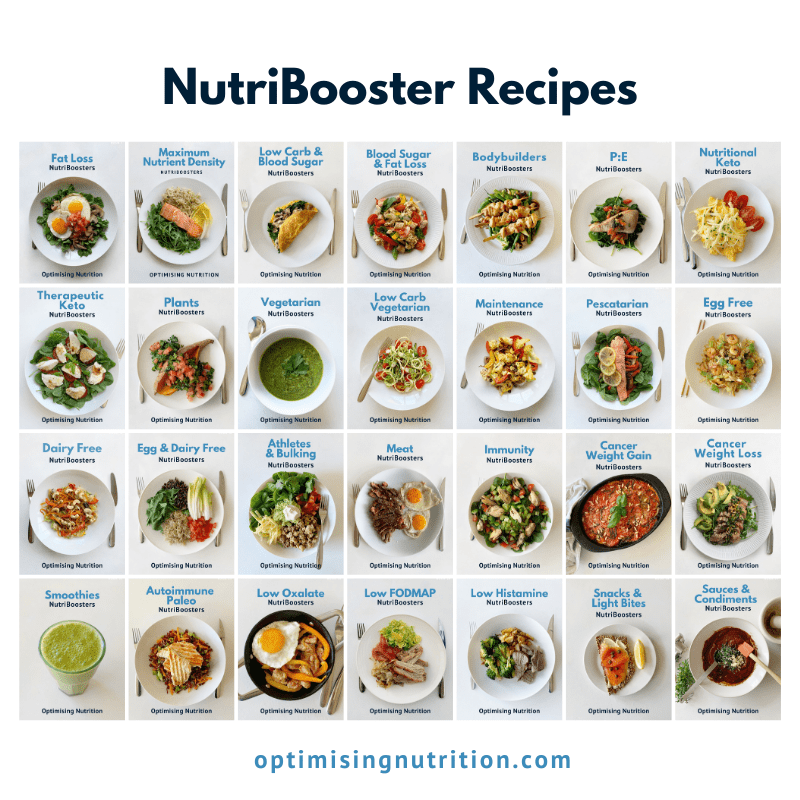
If you want to keep it simple, you can check out our suite of NutriBooster Recipe Books tailored to a range of goals.
If you want to see how your current diet stacks up, check your Diet Quality Score and see which nutrients you need to prioritise, you can take our 7-Day Nutrient Clarity Challenge.
If you want to take your nutrition to the next level, we’d love you to join our Micros Masterclass. Over four weeks, you’ll identify the micronutrient gaps in your current diet and use Nutrient Optimiser to determine which foods and meals you could increase to move towards optimal!

Oh, and Lisa, Karen, Oddny, Michael and Dorrie, and all our other moderators will be there to guide you on your journey.
Read More
- What is Nutrient Density
- All about the Micros Masterclass
- 7-Day Nutrient Clarity Challenge
- Which NutriBooster recipe book is right for me?
- Preventing Deficiencies on a Vegetarian Diet | Karen Lerner-Mayrand
- Optimising Nutrition with Food (Not Supps) | Lisa Angioli
Micros Masterclass Index
- Micros Masterclass
- Join the Micros Masterclass
- Micros Masterclass FAQs
- All About the Micros Masterclass [FAQ Part 1]
- What is Nutrient Density? [FAQ Part 2]
- How to Get the Most Out of Cronometer [FAQ Part 3]
- How to use Nutrient Optimiser [FAQ Part 4]
- Optimising Your Food and Meal Choices [FAQ Part 5]
- Why Are Micronutrients So Important? [FAQ Part 6]
- Micronutrient Deficiencies in Popular Diets [FAQ Part 7]
- Micros Masterclass Articles
- Micros Masterclass Results
I noticed in all the percentages of fat, carbohydrates, and protein, none of the examples add up to 100%. Why is that; do the other calories come from alcohol?
the difference would be fibre (i.e. net carbs = total carbs – fibre).