
Embark on a journey of self-discovery with a bioimpedance scale, your companion in understanding body fat percentage, fat-free body weight, visceral fat level, and skeletal muscle percentage.
Dive deep into the mechanism of how scales measure body fat, the accuracy of body fat scales, and the realms of fat mass. With every step on the scale, unlock a treasure of information, helping you to sculpt a lean, high-protein physique armed with the knowledge of your body’s protein percentage.
It’s not just about weight; it’s about a comprehensive understanding of your body composition, paving the way for informed fitness decisions.
- Background
- What Are Bioimpedance Scales?
- How Does a Bioimpedance Scale Work?
- How Does a Scale Detect Muscle Mass?
- How Accurate Is Bioimpedance for Body Fat and Muscle Mass?
- Do Bioimpendance Scales Work?
- What Is the Best Way to Measure Muscle Mass?
- What Is the Most Accurate Way to Measure Body Fat?
- What About DEXA?
- Athlete Mode vs Normal Mode
- It’s the Long-Term Trend That Matters!
- Body Weight
- How to Change Your Body Weight
- The Pros and Cons of Tracking Your Weight
- Body Weight: A Sum of Many Parts
- Body Mass Index (BMI)
- Basal Metabolic Rate (BMR)
- What Is Subcutaneous Fat?
- What is Visceral Fat
- What Is Muscle Mass on a Scale?
- Can Scales Really Measure Muscle Mass?
- Skeletal Muscle
- Bone Mass
- Protein
- Is It Good To Have a High Protein Mass?
- What Percentage of Your Body Should Be Protein?
- How Do You Increase Your Protein Percentage?
- Bioimpedance Dashboard Display
- Waist-to-Height (W:H) Ratio
- Keeping It Simple
- Summary
- More
Background
Sure, many of us have our eyes fixed on shedding a few pounds, but the real goal is to trim down that body fat while keeping that precious, metabolically charged lean muscle mass intact!
Forget about fixating on your weight alone. Instead, dive into the world of body composition tracking. It’s your secret weapon to:
- Ensure those sweat sessions and dietary tweaks give you the desired results.
- Safeguard your metabolism and wave goodbye to muscle loss.
- Equip yourself with the data to fine-tune your fitness journey like a pro!
Modern scales have stepped up their game, offering insights beyond just your weight. They can spill the beans on your bone density, fat levels, water content, protein, and muscle mass. But hold on a second; those bioimpedance scales might look flashy, but they can also spark more questions than answers.
In this article, we’ll decode the mysteries of every measurement on your bioimpedance scale, spill the beans on their accuracy, unveil their strengths, and shine a light on their limitations.
Plus, we’ll dish out some pro tips on how to steer those numbers in the right direction if they’re playing hard to get. It’s time to ditch the confusion and get the clarity you deserve!
What Are Bioimpedance Scales?
Bioimpedance scales are advanced bodyweight scales that can measure body composition at home. Instead of just giving you your weight, they give you relative percentages of fat, muscle, water, and protein within your body.
How Does a Bioimpedance Scale Work?
Bioimpedance scales (or BIA) scales run a weak electrical signal through your feet and around your body. The resistance (impedance) generated by your body combines with your weight to give you an ESTIMATE of your body fat and several other useful parameters.
How Does a Scale Detect Muscle Mass?
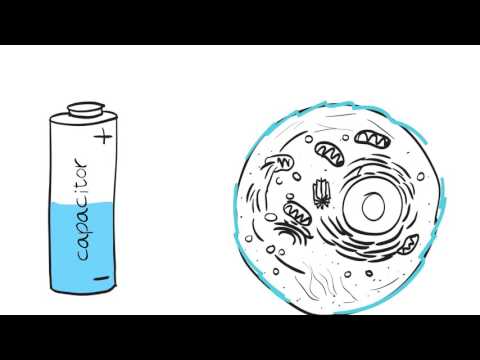
Your muscle is like a sponge filled with approximately 75% water, whereas fat only contains around 10% water.
Because of its high mineral and water content, electrical current moves quickly through salty water, which is very similar to blood. Due to these differing properties, fat is less conductive than muscle. Thus, greater resistance correlates with higher body fat. An electrical pulse will travel more quickly if you are leaner than if you have more body fat.
The short video below explains bioimpedance analysis in more detail.
Using calibrations from DEXA scans, your bioimpedance scale will essentially say, ‘You look like someone with a body fat of X.’ While the measurements given by your scale are only estimates based on correlations, they can still be helpful.
How Accurate Is Bioimpedance for Body Fat and Muscle Mass?
Are bioimpedance scales accurate?
No! Bioimpedance scales are not perfectly accurate.
However, no method of body fat measurement is perfectly accurate (other than perhaps an autopsy… and you’re probably not that committed to knowing your body fat accurately)!
Do Bioimpendance Scales Work?
To understand whether BIAs are useful or not, we must first understand accuracy and precision. If something is accurate, it gives the correct measurement. If something is precise (reliable), it provides the same measurement consistently.

Something that is accurate and precise (reliable) is the best device to use, as it gives the correct reading time and time again. Every form of measurement has some level of error (or noise).
However, we can still use the data if it is reliable and consistent. While we’d love to get accurate and reliable data all the time, we can still use inaccurate data that maintains its consistency to track the trends. This is especially true if we can collect the data quickly and regularly.
Although our data may be slightly inaccurate, we can still use these measurements to track our progress.
What Is the Best Way to Measure Muscle Mass?
Magnetic resonance imaging, or MRI, is the most accurate way to measure muscle mass. Hydrostatic weighing, air-displacement plethysmography, and 3D body scans are other options. However, they aren’t easily accessible for most of us, nor are they affordable on a regular basis!
To get a pretty accurate, cost-effective estimate of your muscle mass, you can simply subtract your body fat from your total body weight. To do this, you must first determine your body fat percentage.
Similar to muscle mass, there are several ways to determine your body fat percentage. All have varying degrees of accuracy.
What Is the Most Accurate Way to Measure Body Fat?
Calorimetry is the most accurate method to measure body fat. We commonly use this method to determine the calories and macros on food nutrition labels.
When we burn a substance, we can determine its glucose, fat, protein, alcohol, and water content based on the heat and gases it produces. While this method is accurate, most of us aren’t—or shouldn’t be—looking for that level of accuracy to determine our body fat.
Your weight, body fat, or any other measurement you make is an estimate that you can use to track changes and trends. The data is not perfect, but it can help you make adjustments to ensure you continue to move toward your goal.
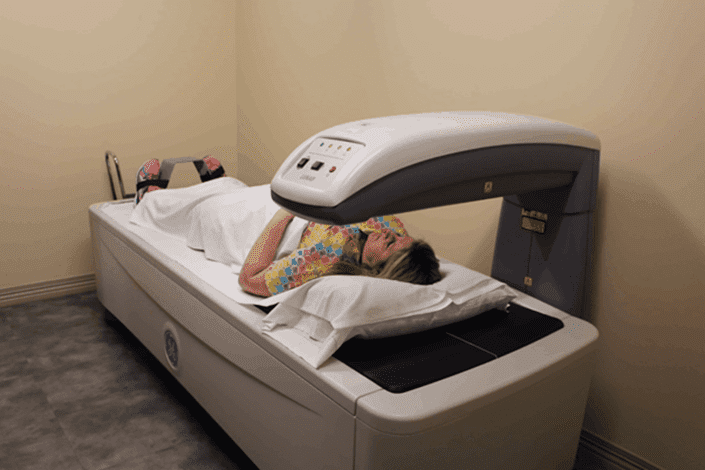
What About DEXA?
One of the most accurate ways to measure your body fat—while you’re still alive—is a DEXA (Dual X-ray Absorptiometry) scan.
The medical community uses the DEXA scan to measure bone mineral density. However, it can also measure the fat, water, and bone volume in different areas of your body, which represent various components of your overall body weight. It is pricier, but it can give us information that we can use to train the algorithms in the less expensive bioimpedance scales.

But even DEXA is not perfectly accurate, and there is still some variability between machines. Across the interwebs, you will see plenty of bodybuilding folks who get lean, fork out the money for a DEXA scan, and still don’t believe their results when comparing themselves to others.
‘Bro, you’re not 8.2% body fat. You look much more like 6.1%! Don’t worry about it, bro. You look great just the way you are. Put down that pizza; ain’t that bad!’
The other downside of a DEXA scan is that it’s expensive. DEXA technology tracks bone density in people with or at risk for osteopenia, osteomalacia, and osteoporosis. While your health fund may cover the cost in this instance, it’s unlikely that most people will go to a specialist clinic regularly and pay hundreds of dollars out of pocket to track these long-term trends.
That’s where bioimpedance scales come in; they function as a DEXA-Lite for the masses. Once we accept that we can’t have perfect accuracy, but we can have precision, we can get on with tracking the trends and changes in our body composition.
Athlete Mode vs Normal Mode
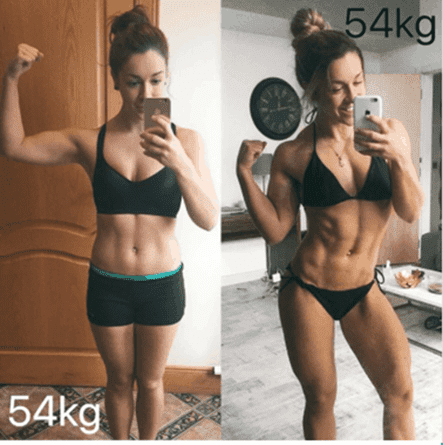
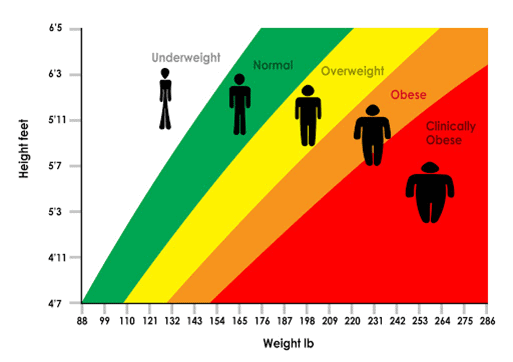
Before you start using your bioimpedance scale, you need to decide whether to set your scale to ‘athlete’ or ‘normal’ mode. ‘Athlete mode’ is best for more muscular people. ‘Normal’ mode is calibrated for the majority of the population with less muscle and more fat.
The best way to decide which setting is right for you is to compare what you see in the mirror vs what you see in the body fat comparison photos below, alongside the number you see on your scale.

You can also use the U.S. Navy Body Fat Calculator, which uses several body measurements to estimate your body fat percentage, fat mass, and lean mass. The Navy Body Fat Calculator tends to be accurate within 1-3% for most people, and it correlates with DEXA rather well. However, it’s not convenient to do regularly.
Once you have selected the option that resembles your mirror image the best, you can get on with tracking using this trend. If you end up changing between athlete and normal mode, make sure you delete the data recorded in the other mode and clean up the long-term trend data.
Note: To do this in the Renpho app, go to trends, tap on the clock in the top right of the screen, select the days you want to delete, and click the trash can.
It’s the Long-Term Trend That Matters!
The most significant benefit to using a bioimpedance scale over other body composition measurements like DEXA, bod pod, or underwater weighing is that you can do it every day at home. In addition, regular measurements are regular reassurance that you’re on the right track over the long term.
Body Weight
Modern scales typically have high precision, meaning you can step on them repeatedly and get similar readings.
The margin of error at different weights per the Renpho user manual appears in the table below.
| 50kg±0.3kg | 100kg±0.4kg | 150kg±0.5kg |
| 110lbs±0.66lb | 220lbs±0.88lb | 330lbs±1.1lbs |
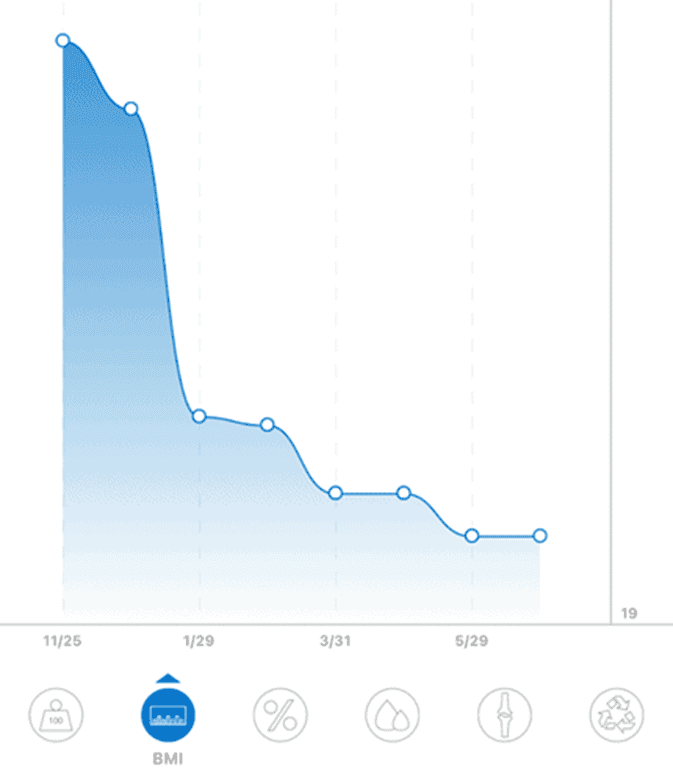
Most people want to see the weight on the scale decrease, like the example shown below. However, someone underweight who wants to ‘bulk up’ will want to see their weight trend up. Ideally, they will want this to be without an excessive increase in fat mass.

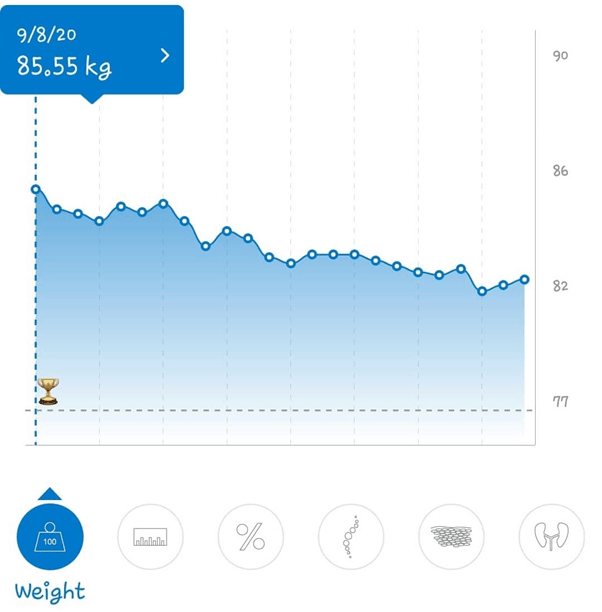
But the Holy Grail that everyone wants to achieve is improved body recomposition or losing fat while gaining muscle (and yes, this can be done).
You can begin this process by resistance training and making wiser food choices, especially at the start of your health journey. But once you’ve made your ‘newbie’ gains and get more training experience, you may find ‘periodising’ your diet and training or splitting time between focusing on strength gain OR losing body fat, to be more beneficial over the long term.
How to Change Your Body Weight
The main factor that affects your long-term weight is HOW MUCH you eat.
However, changing your body composition is also heavily influenced by WHAT you eat; muscle weighs more than fat, and you must burn fat while feeding your muscles.
While energy is always conserved, it’s not as simple as managing calories in vs calories out. Due to our satiety response to different foods, it’s hard to change how much we eat without changing what we eat.
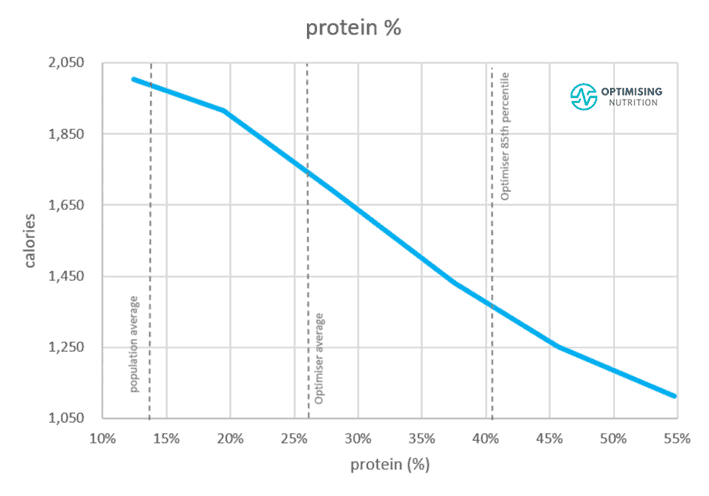
That’s why we encourage people trying to lose weight to prioritise nutrient-dense foods with a higher protein percentage (protein %) or per cent of total calories from protein.
Consuming more protein relative to other macronutrients also takes advantage of the thermogenic effect of food. We burn up to 25-35% of the calories we consume from protein when we turn it into usable fuel (ATP). In comparison, we only burn about 3-15%, turning fat and protein into fuel.
You can learn more about this in our article, Oxidative Priority: The Key to Unlocking Your Body Fat Stores.
Increasing your protein per cent is not a matter of simply eating more protein, but rather scaling up your intake of protein and fibre while dialling back your consumption of fat and carbs. We guide our Optimisers through this very process in our four-week Macros Masterclass.
The Pros and Cons of Tracking Your Weight
Some people can be intimidated by the number on the scale and use it to judge themselves. Because we pay more attention to our shortcomings, any short-term fluctuations that aren’t favourable can additionally make someone feel like a failure.
If you are trying to lose weight and get healthy, it’s best to weigh yourself daily and watch the long-term trend. Try not to overanalyse any day-to-day fluctuations – hormones, the amount of water you’ve drank, the number of minerals you’ve consumed, and stress can, together, elicit dramatically different readings in just a day’s time. Remember: you can’t force the numbers towards the direction you want, but you can manage the inputs you know influence the changes you want to see.
According to an analysis of data from the U.S. National Weight Control Registry, regular weighing is one of the most commonly reported habits of people who have lost weight and kept it off. Seeing the trend in your weight can help you make more mindful eating decisions and increase your activity levels before things get out of hand.
Body Weight: A Sum of Many Parts
While regular weighing can help reinforce your progress, it’s just a cumulative summary of several important details. Bodyweight is essentially a sum of many parts, each having its own importance in your health. We’ll talk about some of the components that make up body weight.
Body Fat Percentage
Your body fat percentage is the amount of fat on your body over your total body weight (i.e., lean mass and fat mass).
Body fat % = body fat / total weight
Your lean mass includes your muscles, water, stored glycogen, bones, and organs like your brain, heart, and liver.
Both Nutrient Optimiser and the Data-Driven Fasting app use your body fat percentage to track your lean mass.
Body fat (in kg or lbs) = weight x body fat percentage
Once you have your body fat in kg or lbs, you can use it to find your lean mass.
Lean mass = weight — fat mass
You can use your lean mass to estimate how much protein you need to consume. The most accurate calorie and protein calculators like our Optimising Nutrition Macro Calculator, rely on lean mass rather than total body weight to generate their recommendations.
Because your lean mass is metabolically active, someone at the same body weight with a greater lean body mass would require more protein. We feel like this is more accurate and optimal.
The table below shows the ranges of body fat percentages for men and women.
| Description | Women | Men |
| Essential fat | 10–13% | 2–5% |
| Athletes | 14–20% | 6–13% |
| Fitness | 21–24% | 14–17% |
| Average | 25–31% | 18–24% |
| Obese | 32%+ | 25%+ |
If you need to lose weight, you ideally want to see your body fat percentage trending downward over time. However, this may not always be the case when you lose weight; progress is not linear, and there may be some increases here and there before you reach your goal. What matters is that you lose more body fat than lean mass and that your long-term trend is downward.
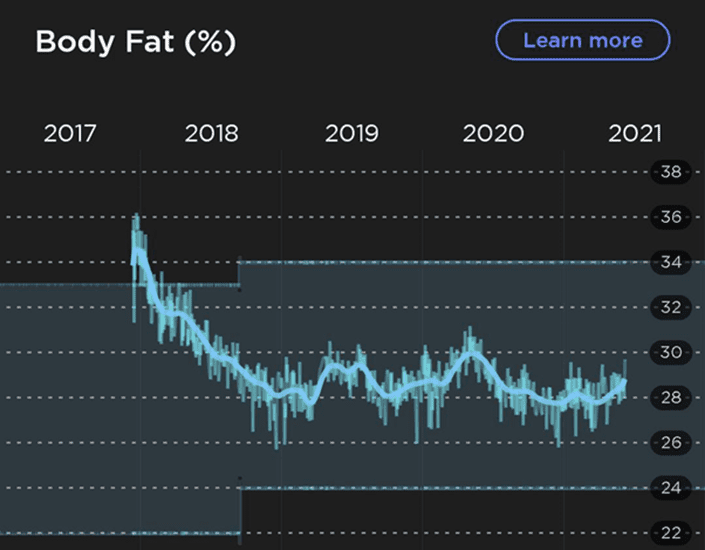
The ‘secret’ here is to ensure you’re consuming adequate protein and using resistance training during the weight loss process to tell your body that it needs to maintain your metabolically expensive muscle in a calorie deficit.
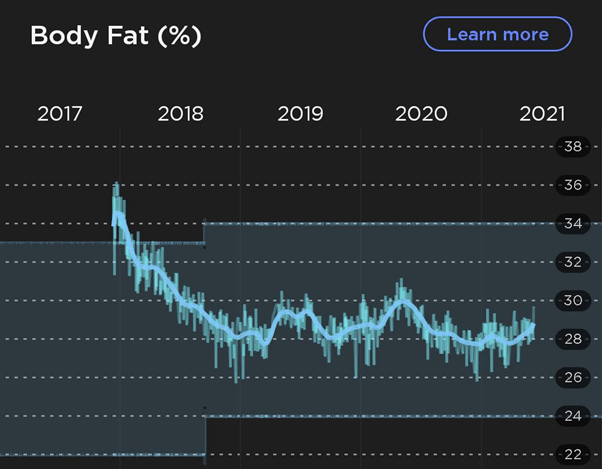
Fat-Free Body Weight (Lean Mass)
If you are losing weight, you want to see your fat mass trending downward over time. Ideally, you want to see your lean mass or your metabolically active muscle mass that burns calories at rest stay the same and avoid it decreasing dramatically.
People in our Macros Masterclass often gain lean mass (fat-free mass) when they increase their protein intake despite making no changes in their activity.
The reality is that most people tend to lose lean mass (or fat-free body weight) as they lose weight. So, the key here is to minimise the loss of lean mass while losing weight. We can do a few things to prevent this from happening.
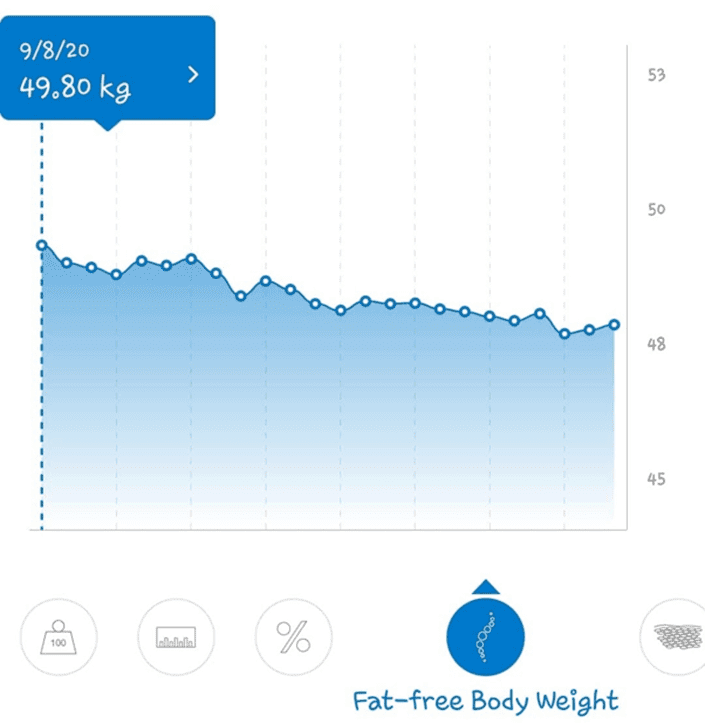
Feeding your muscles with adequate protein can help you preserve your lean mass. Our bodies need protein to repair muscles and carry out a slew of metabolic processes. Thus, more protein helps to ensure your body isn’t dipping into your protein stores (muscle) for amino acids.
Similarly, resistance training tells your body that your expensive-to-maintain lean mass is still required, preventing it from breaking it down and upcycling it for energy in a caloric deficit. It sounds simple.
But it’s not easy to keep overall energy intake low enough for weight loss while maintaining a sufficient protein intake to maintain precious lean mass! Thus, the more aggressive your energy deficit is, the more you need to prioritise protein.
To learn more about increasing your protein intake to avoid losing muscle in an aggressive deficit, check out our article, Secrets to a Nutrient-Dense Protein-Sparing Modified Fast.
- slowly dial up your protein target if you are losing lean mass, and
- alter your calorie target to lose weight at a maintainable, satisfying rate.
Some people can lose weight at up to 2% per week over the short term and keep it off. However, most people find a rate of 0.5% more sustainable over the long term without rebounding due to unbearable hunger.
Your body can only release a finite amount of weight before it begins breaking down your lean muscle mass for fuel. To prevent this from happening, your body compensates with cravings for more food. Thus, maintaining a lower but consistent rate of weight loss is usually better than going all out to avoid rebound bingeing and undoing all your hard work.
As you lower your calorie target and your protein target increases, the overall percentage of total calories from your diet, or your protein %, rises. Our satiety analysis shows that the percentage of our diet coming from protein correlates most with how much we eat.
Body Mass Index (BMI)
Your Body Mass Index (or BMI) is your weight (in kg) divided by your height (in metres) squared. BMI is a simplistic indicator of your metabolic health.
Weight (kg) / (height, in metres)2

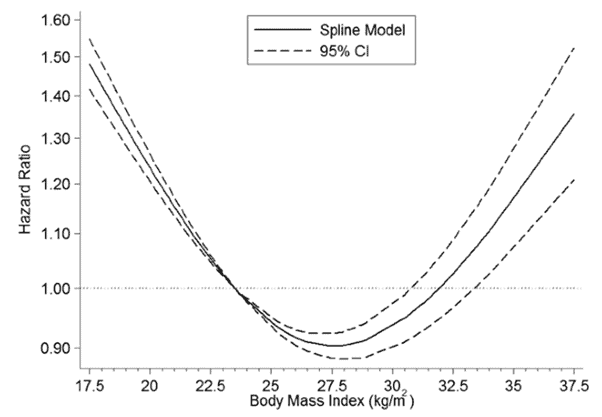
Because BMI is easy to measure, there is plenty of data available to show the relationship between BMI and factors like longevity and your risk of dying from all-cause mortality (e.g., dying from diseases like heart disease, cancer, etc.).
But like most things in nature, optimal is not found at extremes. While we know the risks of obesity, you don’t want to be underweight either. Having too low a body weight leads to frailty, sexual and hormonal dysfunction, and lowered immunity.

But the likelihood of being underweight in our current society with its excess of food availability is small, and most of us struggle with being overweight.
A BMI between 25 and 30 gives you the best chance of living a long and healthy life.
There are some drawbacks to using the BMI. BMI doesn’t consider how muscular you are, so someone with a greater body weight from a high muscle density could make them appear overweight. However, more muscle mass is not a cause for concern; instead, it’s the excess body fat that most people with high BMIs hold.
To account for this, the Fat-Free Body Mass Index (FFMI) has been developed as an alternative to the BMI. If you’re someone who’s more muscular and has been frustrated by the BMI, you might give the FFMI a try.

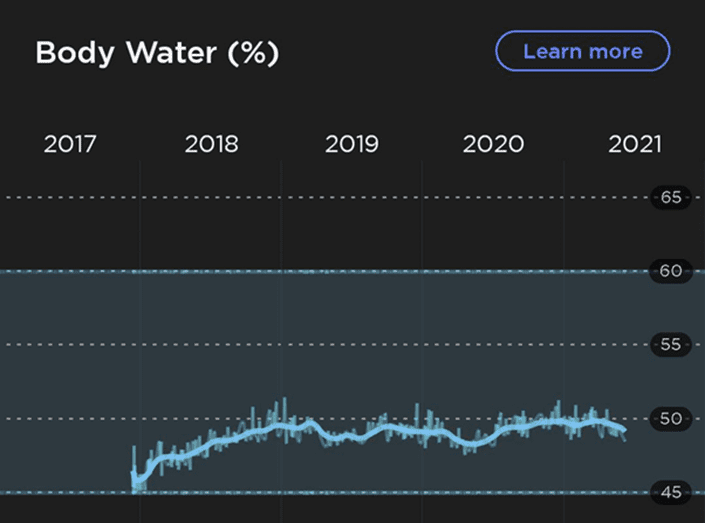
What Is Body Water?
Your blood, lymph, and extracellular fluid make up your body water. Body water typically makes up 50–65% of the weight for men and 45 – 60% for women.
Your weight can fluctuate from day to day based on what you ate or drank, your activity levels, your hormones, or when you last went to the toilet (or didn’t… all the more reason to up your fibre). Some other factors that can influence your water weight are listed below.
Resistance training temporarily inflames your muscles, which attracts more water and increases body weight. This is what ‘looking swole’ means!
- Consuming more electrolytes like sodium, potassium, and magnesium will cause you to hold more water.
- Lowering your carbohydrates forces the use of the glycogen or glucose storage form in your liver and muscles. We are estimated to store three to four grams of water for every gram of glycogen we store. So as your glycogen is depleted, you also lose a significant amount of water.
- Conversely, consuming more carbs can increase how much water we’re storing as our bodies compensate.

Some weight-class athletes like wrestlers and boxers use dramatic interventions like saunas, hot baths, not drinking water, and avoiding electrolytes to shed water weight quickly. But if you’re looking to be healthy, lose body fat, and keep it off over the long term, this is the opposite of what you need to do!
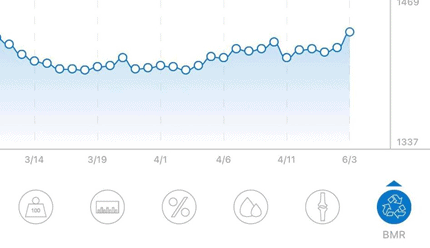
Basal Metabolic Rate (BMR)
Once a bioimpedance scale has determined your weight and lean mass, it can also calculate your theoretical basal metabolic rate (or BMR).
Your BMR is the amount of energy (calories) your body requires to execute necessary bodily functions at rest. In other words, this is the number of calories you need to eat to fuel your body’s everyday tasks if you’re simply lying in bed and breathing. It does not include activity.

You can use your BMR to set your daily calorie target in food-tracking apps like Cronometer. Most diets recommend that you eat at or less than your BMR to lose weight.
While your BMR can provide a quick calorie estimate—if you can stick to it—in our Macros Masterclass, we suggest people track their current intake for a week and then guide them to make small, incremental changes based on how their biometrics respond.
You don’t need to drop your calorie target if you are losing weight. But if your weight loss slows, you can decrease your energy from fat and/or carbs a little for the coming week. This ensures you are only using the minimum effective dose of restriction while still achieving significant but sustainable results.
As a general rule, you will need less energy to maintain your body weight if you’re smaller and more if you’re larger. You will see your calculated BMR fall if you are losing weight. A decrease in metabolic rate is often inevitable with weight loss. However, it’s essential to prioritise adequate protein and some level of resistance training to minimise this drop.
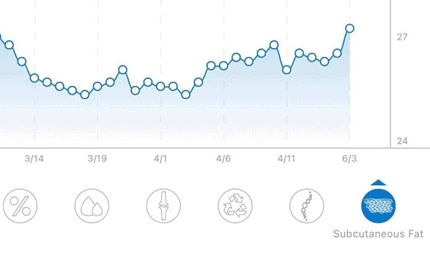
What Is Subcutaneous Fat?
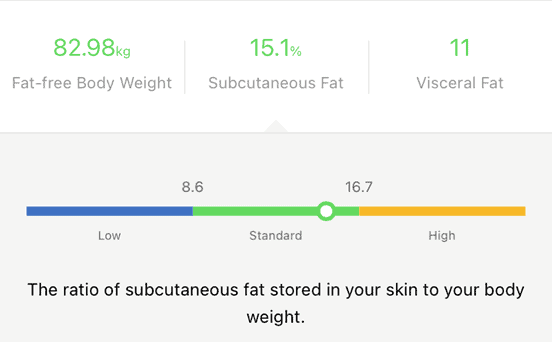
Subcutaneous fat is the fat stored beneath your skin towards the outside of your body.
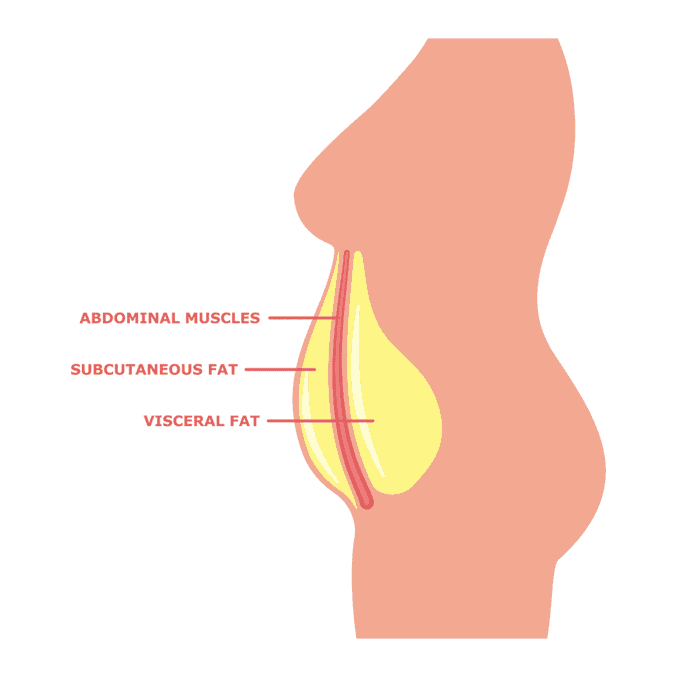
While it’s unsightly, and we’d prefer not to have any, subcutaneous fat is considered healthier than its deeper counterpart, visceral fat, because it’s located where it’s meant to be – away from your organs!
You get into trouble when you overfill your subcutaneous fat, exceed Your Personal Fat Threshold, and have an overflow of visceral fat that latches onto and around your organs. Some people are ‘blessed’ with the ability to store a lot of subcutaneous body fat before they begin packing on visceral fat. Meanwhile, others with a lower Personal Fat Threshold often develop diabetes at a much lower BMI and see more fat around organs like their pancreas and liver.
Once our subcutaneous fat runs out of storage space, any excess energy from our diet backs up into our bloodstream and registers as elevated free fatty acids, ketones, and glucose. This might land you with a medical diagnosis of prediabetes, Type-2 diabetes, or another related metabolic disease.

Keep in mind that the numbers shown on the app from your scale are only estimates based on correlations. Once we get down to this level of granularity, these numbers should only be used to highlight areas of concern so you can manage your risk and monitor trends.
If you are concerned about these numbers and want to know them accurately, it might be worth getting a DEXA scan.
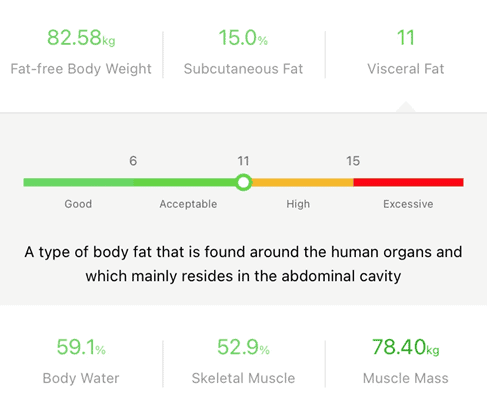
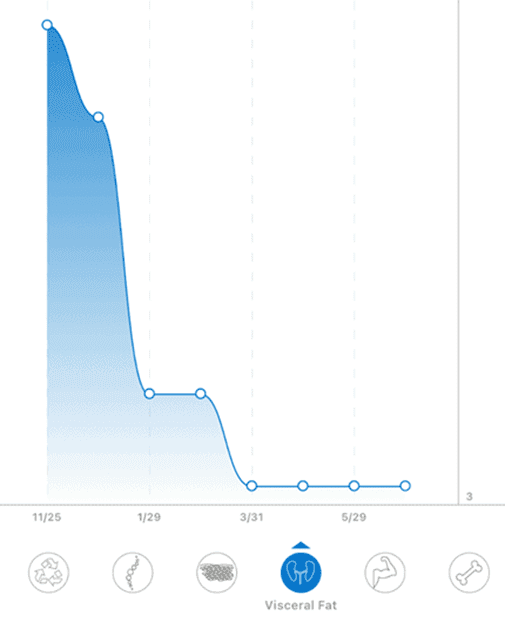
What is Visceral Fat
Visceral fat is the fat stored beneath your muscle wall that surrounds the organs in your abdominal cavity. While you need a minimum amount of visceral fat to survive, too much visceral fat stored around your liver, heart, and muscles can be dangerous. It can also alter organ function and contribute to conditions like non-alcoholic fatty liver disease (NAFLD), pancreatitis, and heart disease.

Some people who look lean tend to carry a lot of fat around their organs. We refer to this as TOFI (or thin on the outside, fat on the inside). If your visceral fat levels are high, your blood sugars are likely elevated because your body is over-fuelled with energy.
In our Data-Driven Fasting Challenges, we address the root cause problem of metabolic syndrome (i.e. energy toxicity) by using your pre-meal blood sugars to guide meal timing so you can use up some of the energy you have on board.
If your blood glucose is high, your fuel tanks are still full, and you can wait a little longer before eating. This method tends to be super effective for targeting visceral fat, which is only used for fuel once excess glucose in your bloodstream and liver has been depleted.
If your blood sugars are elevated, you’ll also likely benefit from dialling back on dietary carbohydrates such as added fructose from soft drinks and food sweetened with high fructose corn syrup. Excess fructose converts to fat in the liver rather quickly, which is why many have linked it to non-alcoholic fatty liver disease (NAFLD).
Energy toxicity is not from carbs alone; high levels of visceral fat also correspond with higher body fat levels overall. Thus, dialling back on calorie-dense dietary fat WHILE lowering your carb intake AND increasing your protein intake will increase your overall protein % and move you towards your goals. We walk Optimisers through this exact process in our four-week Macros Masterclass.
Whatever you decide to do first, we find the secret is not to go too hard too early! Most people experience optimal long-term results when they dial up protein while dialling back their carbs to stabilise blood sugars AND lower dietary fat to burn the fat off their bodies (and not their plates).
We’ve found that using the minimum effective dose, or applying the minimum amount of effort to move towards your goals, keeps more people on board for the long term. In addition, once Optimisers find they’re getting great results without excessive deprivation after a week or two, they are inspired to continue the process.
Aggressive crash dieting leads to rebound binging and feelings of failure. Once progress slows, you can adjust your approach and get back on the fast track to progress. Dieting usually gets challenging eventually, but there’s no need to make it harder than it needs to be too soon!
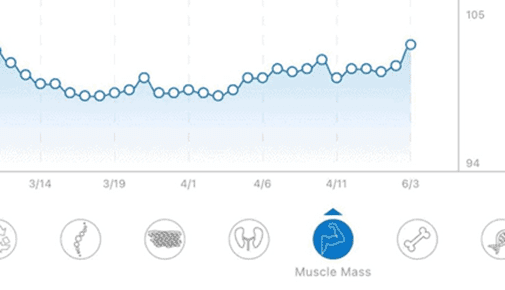
What Is Muscle Mass on a Scale?
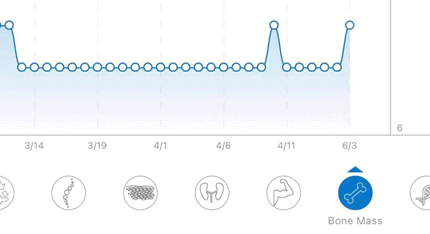
The muscle mass shown on your bioimpedance scales represents the total weight of all the muscles in your body. This includes skeletal muscle, heart muscle, smooth muscle, and the water they all contain. You ideally want to see this trend upward over time, similar to the example shown below.
Your muscle mass is the most metabolically active tissue that uses the most energy in your body. If you lose muscle mass, your metabolic rate slows, and you will have to cut your energy intake to prevent weight gain. Muscle mass tends to decline with age, excessive fasting, or not eating enough protein. Hence, resistance training and consuming adequate protein are the best investments you can make in your future metabolic health!
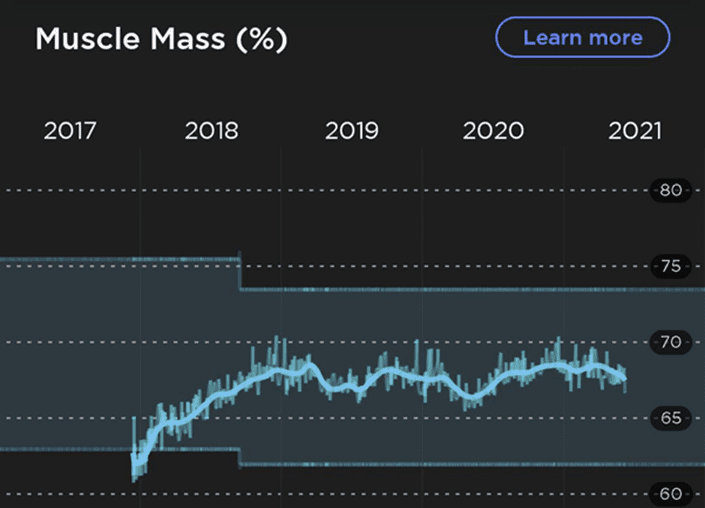
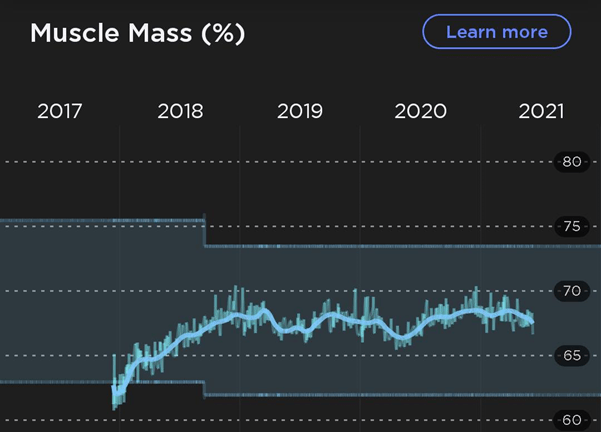
The chart below shows my current muscle mass alongside my fat-free body weight (lean mass). Over the past three years or so, I’ve been working consistently to build strength and put on more muscle mass with progressive overload resistance training and adequate dietary protein. My lean mass is 82.5 kg. Once subtracting my bone mass (4.2 kg), we have 78.4 kg of total muscle mass. This includes my heart, liver, other organs, and the water they contain. 52.9% of my muscle mass is attached to my skeleton (i.e., skeletal muscle), or the muscle used to move my body and lift weights.

Below, we can see the muscle mass progression in Karen, a fellow Optimiser. You can see how her muscle mass increased when she started building muscle through CrossFit.
When you’re building muscle, the reality is that it’s difficult not to add some body fat. It’s natural to crave more food to fuel recovery from the intense workouts we need to put on serious muscle.
The ‘secret’ to minimising this is to dial back on energy from fat and carbs to the point that you feel recovered but aren’t gaining so much excess body fat that you find yourself in a dirty bulk. Over time, you can optimise this process by prioritising protein with just enough energy from fat and carbs to fuel your exercise.

I initially developed our Data-Driven Fasting system to help me lose some extra fluff after an intense strength-building phase. We can use our pre-meal blood sugars to ensure a negative energy balance and reduce the excess glucose and fat in our bodies without the hassle of tracking calories.
Can Scales Really Measure Muscle Mass?
Bioimpedance scales measure muscle mass precisely. In other words, they’ll do an excellent job of giving you consistent estimates that you can use to track your progress. However, as noted earlier, it’s unlikely that they’re perfectly accurate.
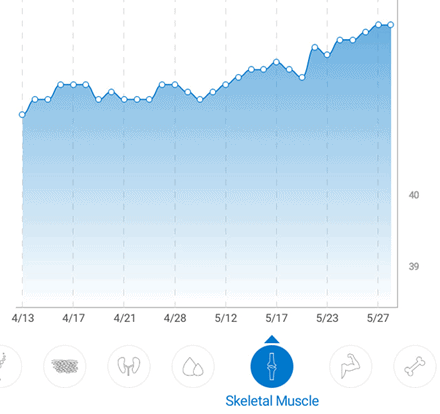
Skeletal Muscle
Skeletal muscle is the muscle attached to your bones that’s involved in moving your body and lifting heavy things. Your skeletal muscle is what makes you look and feel strong rather than just skinny. It excludes organs like your heart. If you’re consuming adequate protein and resistance training, your skeletal muscle mass should ideally increase.

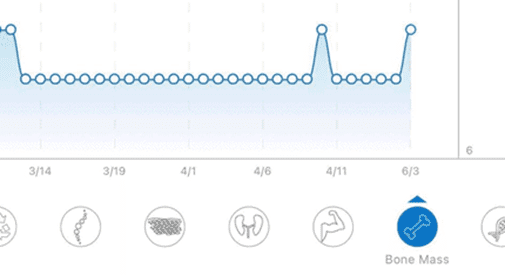
Bone Mass
Your bone tissue consists of minerals like calcium, phosphorus, and magnesium, and your bone matrix is made from collagen (a scaffold made of proteins). Like muscle, consuming adequate minerals and protein and regularly training with resistance is crucial for building and maintaining healthy bone mass.
Again, keep in mind that these numbers on your bioimpedance scales are ESTIMATES! They are not direct measurements, so don’t expect a high degree of accuracy. But they are helpful for tracking trends.
Protein
Some bioimpedance scales also estimate the amount of protein in your body. If you’ve seen the Renpho scale’s protein measurement, you may be wondering, ‘How does a scale measure protein?’ That seems pretty sophisticated!
Protein = fat-free mass — water — minerals — bone mass
However, once we have some basic measurements, Renpho’s protein percentage becomes easy to calculate. As you can see in the equation above, the protein measurement looks at the raw weight of protein in your body.
In other words, it subtracts the mineral and water content that could be associated with muscle. Because water weight can fluctuate so much on a day-to-day basis, this can be a more reliable metric to track your muscle-building progress.
Is It Good To Have a High Protein Mass?
We need protein to make muscle, so having more protein on board means more muscle mass. As you can imagine, the greater your protein mass is, the better. On the contrary, a lower protein mass correlates with higher body fat, less muscle mass, and a lower metabolic rate.
Once you reach your forties, protein and muscle tend to decrease with age naturally. So, you can see every gram of protein as a long-term investment in your resilience and metabolic health in later life.
What Percentage of Your Body Should Be Protein?
There isn’t a well-established body protein percentage chart out currently like there is for body fat per cent. However, a healthy body protein percentage (protein mass) for the body is said to be 17% and above. If your protein mass per cent is far below this, it might be worth evaluating your dietary protein intake and reviewing your training schedule. The app that comes with your scales will give you an indication of where you sit within the normal range.
How Do You Increase Your Protein Percentage?
Increasing your body’s protein percentage goes hand-in-hand with increasing your dietary protein percentage or the percentage of your total calories from protein. While we can lose weight by dialling back on energy from dietary fat and carbs AND dialling up our dietary protein intake, we have seen many Optimisers actually gain muscle while losing fat during our Macros Masterclass.
To maintain or increase your body’s protein percentage during a calorie deficit, it’s essential to keep your protein percentage high. This will not only give your body the raw ingredients it needs to keep the muscle you have and even build more, but it will also give you the micronutrients (i.e. amino acids, vitamins, and minerals) to feel satiated and manage your cravings. You can read more about this approach in our article, Secrets of the Nutrient-Dense Protein-Sparing Modified Fast (PSMF).
Adding weights and resistance training will build muscle once you’ve maxed out your protein intake. When you lift weights, your muscles break down after each session and repair themselves to be stronger and more resilient. By progressively adding more weight over time, your strength will grow, too.
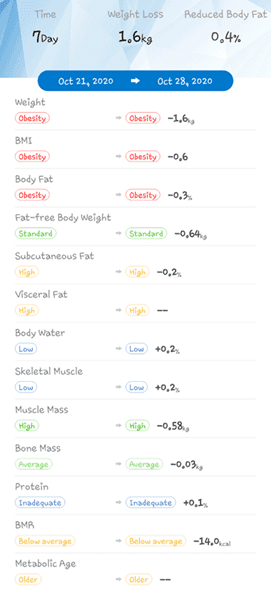
Bioimpedance Dashboard Display
Bioimpedance scales give you a handy dashboard to highlight areas that may require some focus. They can also show you your trends and where you’re improving. This positive feedback ensures people stick with the process for the longer term.
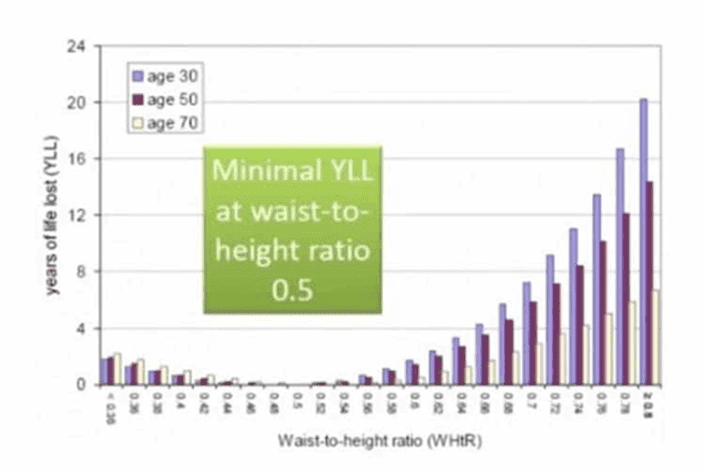
Waist-to-Height (W:H) Ratio
Although the scale doesn’t measure this directly, the apps that come with bioimpedance scales typically allow you to track your W:H ratio and other biometrics. We encourage people to measure their waist weekly and record it in Nutrient Optimiser and the Data-Driven Fasting app.
Your W:H ratio is an even better indicator of the state of your metabolic health than your BMI. A waist-to-height ratio of 0.5 or below means you are in good shape and have a lower chance of dying from any cause (lower all-cause mortality).
Keeping It Simple
Some people love to keep tabs on all the data and track their progress. But many find it overwhelming and too much hassle!
If you want to keep it simple, you can use your ‘skinny jeans’, your wedding ring or old belt to measure your progress. If you find you need to add new holes in your belt, you know you’re on the right track (and vice versa). If you find your wedding ring is slipping off, you’re probably losing fat in all the right places!

Summary
A bioimpedance scale can be a handy, cost-effective way to track your metabolic markers from home. However, the numbers you see are estimates that allow you to make inputs to manage the long-term trend and move towards optimal.
Great info! I’m a fan of body composition analysis as it offers a deeper insight into what works and doesn’t. I periodically submit to an 8 point bioimpedance scan at a local gym called an ‘Inbody’. I also have a home bioimpedance scale that I use to track trend as you describe above, however I find it can be ‘all over the shop’ at times! My understanding is that home bioimpedance typically uses an algorithm to calculate results which are based on information the user enters into the device, such as age and gender. In contrast, the Inbody results are direct and not a result of an algorithm.
As a nearly 65 year old woman, tracking has lead me to better understand the efficacy of any program I follow. For example, I’ve followed experts who state that exercise does not assist much with weight loss, and that diet is the main contributor. that may be true, though when I was practicing basic 5:2 intermittent fasting I became fatigued and as a result quite sedentary over a number of months. I was aware that I’d gained around half a kilogram over that time, though wasn’t concerned until I underwent my annual body composition scan which showed that I’d shed 1.5 kg of muscle and gained 1.9 kg of fat. It was scary realizing I’d shed so much muscle and that my fat mass had expanded. The Inbody revealed that even my visceral fat mass had even grown by 4 centimetres square! Since then I’ve continued to educate myself and experiment.
Many thanks to Optimising Nutrition for the key to satiation! I gave up 5:2 fasting because I’d fallen into a vicious cycle of fasting, feeling starved and then over eating on non-fasting days because I would be so hungry. I then switched to a low carb and eventually keto lifestyle. This was an improvement as I had more energy though satiation was still an issue. I began to crave fat and easily polish off a bowl of cacao butter buttons like a bag of crisps! I kept on with it thought hoping I would eventually become ‘fat adapted’ from doing so and be able to seamlessly go hours without hunger or food naturally as my body commenced using its own stores. That never happened for me and I wondered what was wrong? Was I an exception to the rule about being able to utilize body fat for energy? Gnawing hunger kept getting the better of me.
It wasn’t until I heard Marty being interviewed and about the important role of oxaloacetate as an essential ingredient in the krebs cycle that I experienced a ‘lightbulb’ moment! Maybe the solution to my body fat utilization dilemma was as simple as not consuming enough protein, given I keep carbs under 20 grams per day. Oxaloacetate is required to utilize fat for energy and I wasn’t providing myself with enough of that ingredient given I was eating low carb and not enough protein to suffice. I slowly began adding in more meat and eggs and now aim to eat 120 grams per day. This has given me the energy I require to move more and exertion that previously left me fatigued, felt easy. I’m no longer hungry all the time and the tape measure is showing that padding around my belly button is shrinking. This has been helped by the Protein Sparing Modified fast days I added in once or twice a week, and for the first time ever, I’m seeing my weight maintained in between fasting days, something I was rarely able to attain when conventionally practicing 5:2. Wow! To be free of the fasting yo-yo roller coaster, so liberating! In fact I’ve been maintaining so well in between PSMF days that I’m ready to drop practice frequency further. I’m guessing my visceral fat is reducing, because I’ve also gathered from Optimising Health info that my expanding visceral fat quotient may have been due to the gnawing hunger and resultant overeating response. If I understand correctly, eating an overload of energy at once floods the body which results in stuffing excess energy away and would necessitate stuffing some around the organs if all there is still too much compromising the blood stream because there is too much coming in too fast to fit into subcutaneous areas? In another month or so, I will see if this understanding leads to a reduction in visceral fat . By the way, I do not have any kind of business or profit connection to the company that makes the Inbody scan. I thought to mention as are affordable and radiation free method.