

Are you on a quest for better health and nutritional balance? Delve into the intricacies of nutrient balance ratios in our in-depth analysis.
This guide demystifies the micronutrient ratio dials in Cronometer and Nutrient Optimiser, shedding light on the likes of zinc:copper, potassium:sodium, and omega-6:omega-3 ratios.
Whether you are a seasoned nutrition enthusiast or a newcomer to the wellness scene, understanding these ratios could be a game-changer for your health.
Navigate through the fascinating realm of nutrient balance ratios with us and take a step closer to achieving a well-balanced, healthier you.
- Supplements and Fortification
- Synergistic Interactions of Micronutrients
- Commonly Accepted Micronutrient Balance Ratios
- The Data
- Do the Nutrient Ratios Align with Greater Satiety?
- Satiety Benefit of Micronutrient Ratios
- How Nutrient Optimiser Helps Manage the Micronutrient Balance Ratios
- Potassium:Sodium Ratio
- Zinc:Copper Ratio
- Calcium:Phosphorus Ratio
- Fibre:Carbohydrate Ratio
- Iron:Copper Ratio
- Calcium:Magnesium Ratio
- Omega 3:6 Ratio
- Summary and Recommendations
- How Nutrient Optimiser Uses the Micronutrient Balance Ratios
Supplements and Fortification
Let’s start with the good news: micronutrient ratios are unlikely to be a major concern unless you’re using supplements or consuming fortified processed foods.
Whole foods contain micronutrients in the forms that your body understands and in ratios that your body can easily assimilate. Your gut can allow nutrients that it requires more of from food to enter your body selectively while letting others pass through and out the other end.
Similar-sized nutrients can compete for absorption and uptake. Thus, if your supplementation or the fortification of your food is excessive, you may be adversely impacting the absorption of other essential nutrients.
Micronutrient ratios will be more relevant if you consume fortified foods or use supplements. Because your gut doesn’t deal with concentrated doses of nutrients well, more may be absorbed.
Conversely, your gut could respond by flushing all your food – and the other nutrients it needs – out the other end. This is why so many supplements come with warnings of diarrhea or GI distress.
Synergistic Interactions of Micronutrients
The body requires thirteen essential vitamins and thirteen essential minerals. While each has its own unique role, they also work together to carry out specific functions. In addition, individual vitamins and minerals have strong relationships with one or multiple vitamins or minerals, especially those of a similar size.
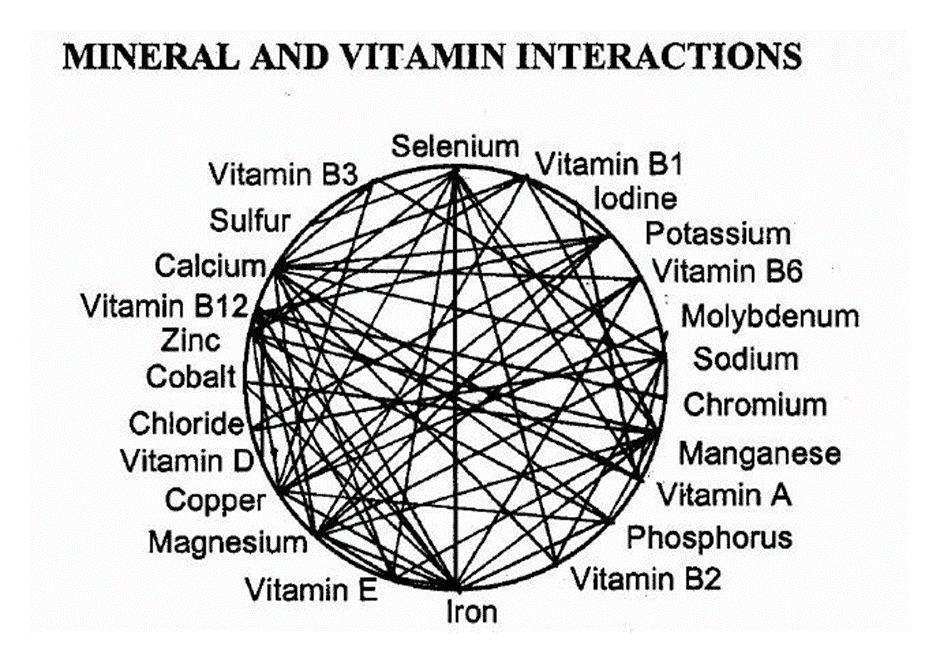
These relationships can be:
- synergistic: where consuming one nutrient increases the effectiveness of another,
- antagonistic: where consuming one nutrient decreases the efficacy of another or
- both, depending on the nutrients in question.
Hence, overconsuming one micronutrient or not enough of another can impact the action and absorption of others. Looking at the ratios between associated nutrients allows us to ensure that we’re not over-supplementing one nutrient that may lead to deficiency in another.
Commonly Accepted Micronutrient Balance Ratios
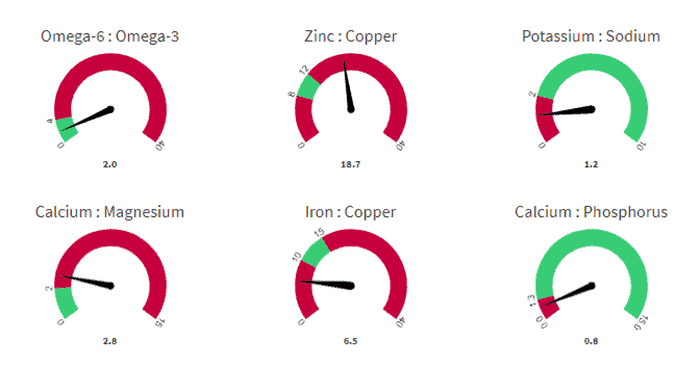
The commonly accepted ratios shown by default in Cronometer and other similar nutritional programs are shown in the table below.
| nutrient ratio | target |
| zinc:copper | 8 – 12 |
| potassium:sodium | > 2 |
| calcium:magnesium | 2 |
| iron:copper | 10 – 15 |
| calcium:phosphorus | > 1.3 |
| omega-6:omega-3 | < 4 |
Unfortunately, there is little research on the minimum nutrient intake targets, let alone ratios between the micronutrients. Even the Cronometer website says, ‘We don’t know much about these ratios, but you’ll be OK if you just eat whole food’.
However, there is solid research into optimal nutrient ratios in soil for optimal agriculture. Sadly, it seems easier to identify optimal ratios to maximise plant growth than for human health!
Fortunately, our data can help us understand the relationship between complimentary micronutrients to help Optimisers in our Micros Masterclass.
Building on our data, we’ll examine whether these are sensible and achievable and what range is best for satiety.
The Data
Our analysis is based on 125,761 days of data from 34,519 Optimisers who have uploaded their Cronometer data to Nutrient Optimiser.
The data we’ve analysed represents how people eat and record in the real world, so it is directly applicable to understanding optimal targets when tracking your food.
Before analysing this data, we culled all entries that contained high levels of any nutrient that could align with supplementation or fortification. After data cleaning, 54,577 days of ‘clean’, unbiased data remained.
Do the Nutrient Ratios Align with Greater Satiety?
The table below shows the complete list of 45 quantifiable nutritional parameters that we have analysed, ranked by their satiety benefit.
At the top of the list, moving from a low 12% protein to a high protein 55% aligns with a massive 55% reduction in calories. By comparison, the various nutrient ratios align with a much smaller satiety response.
| Nutrient | satiety benefit |
| protein (%) | 55% |
| potassium (g/cal) | 49% |
| methionine (g/cal) | 43% |
| valine (g/cal) | 42% |
| nutrient score | 41% |
| cystine (g/cal) | 41% |
| isoleucine (g/cal) | 40% |
| phenylalanine (g/cal) | 40% |
| lysine (g/cal) | 40% |
| histidine (g/cal) | 40% |
| threonine (g/cal) | 40% |
| tyrosine (g/cal) | 38% |
| phosphorus (g/cal) | 38% |
| tryptophan (g/cal) | 37% |
| cholesterol (%) | 33% |
| folate (g/cal) | 33% |
| calcium (g/cal) | 33% |
| niacin (B3) (g/cal) | 32% |
| vitamin B5 (g/cal) | 28% |
| riboflavin (B2) (g/cal) | 28% |
| iron (g/cal) | 28% |
| selenium (g/cal) | 26% |
| omega 3:6 | 24% |
| sodium (g/cal) | 24% |
| vitamin A (g/cal) | 23% |
| iron:copper | 22% |
| magnesium (g/cal) | 22% |
| fibre:carb | 21% |
| vitamin B6 (g/cal) | 20% |
| energy density | 20% |
| vitamin K1 (g/cal) | 19% |
| leucine (g/cal) | 18% |
| thiamin B1 (g/cal) | 17% |
| vitamin E (g/cal) | 17% |
| fibre | 16% |
| manganese | 15% |
| vitamin C (g/cal) | 14% |
| zinc (g/cal) | 13% |
| calcium:magnesium | 11% |
| omega 3 (g/cal) | 11% |
| vitamin B12 (g/cal) | 9% |
| calcium:phosphorus | 8% |
| copper (g/cal) | 8% |
| zinc:copper | 8% |
| potassium:sodium | 5% |
For more detail on how vitamins and minerals affect satiety individually, see:
- The Role of Minerals in Cravings, Hunger, Satiety and Health and
- The Role of Vitamins in Satiety and Weight Management
Satiety Benefit of Micronutrient Ratios
To focus on the micronutrient ratios, the table below only shows the nutrient ratios and their associated satiety benefit.
| Nutrient Ratio | satiety benefit |
| omega 3:6 | 24% |
| iron:copper | 22% |
| calcium:magnesium | 11% |
| fibre:carb | 21% |
| calcium:phosphorus | 8% |
| zinc:copper | 5% |
| potassium:sodium | 5% |
It’s important to note that the impact of the micronutrient ratio has on satiety is much smaller than the effect of each individual nutrient.
So, before you start worrying about fine-tuning your micronutrient ratios, it’s more helpful to get the priority nutrients you require from the food you eat.
However, our analysis can help us understand the typical ranges for these nutrients and which end of the range you might want to target for greater satiety.
How Nutrient Optimiser Helps Manage the Micronutrient Balance Ratios
If you’re using Nutrient Optimiser, you likely needn’t worry much about the ratios; they will look after themselves.
Nutrient Optimiser works by recommending foods and meals that contain the cluster of nutrients in your diet. However, it will not recommend foods and meals that will imbalance your nutrient ratios further. As you consume more of your priority foods, the ratios will fall in line.
Once you’re done optimising your diet as much as possible, you can use the micronutrient ratios as a cross-check. This is particularly helpful if you are still supplementing or consuming fortified foods that may push these ratios out of balance.
The following sections will dive into the nutrient ratios to help you understand:
- the typical range for these ratios, and
- the micronutrient ratios that align with a lower calorie intake and greater satiety.
Potassium:Sodium Ratio
The potassium:sodium ratio is possibly the most important nutrient ratio in your body.
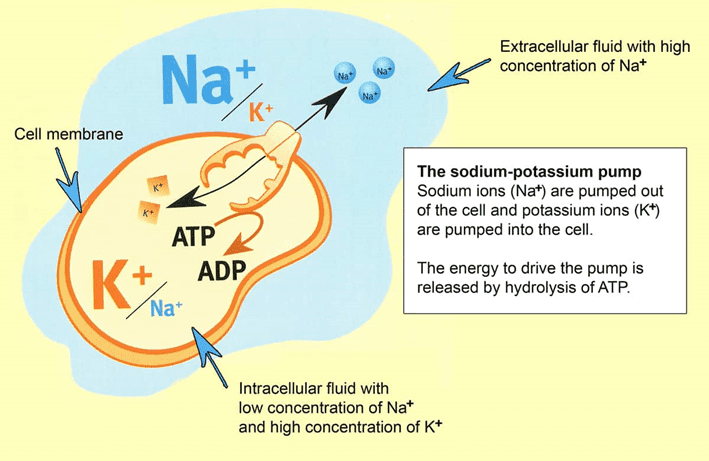
Managing sodium and potassium is a huge priority for our body as the sodium-potassium pump is fundamental for our energy production and fluid balance. Up to 40% of the body’s energy and 70% of the brain’s energy is devoted to managing the sodium-potassium pump alone!
For more on sodium and potassium, check out:
An imbalance between your potassium and sodium intake is linked to a wide range of health issues like hypertension or elevated blood pressure. It’s not so much that sodium is bad and should be avoided. Instead, it’s that most people don’t consume enough potassium.
Sadly, few people meet the Adequate Intake (AI) level for potassium of 2.8 g/day (women) and 3.8 g/day (men). Even fewer get close to the ideal potassium: sodium ratio of 2:1, which is important if you’re trying to manage your cardiovascular disease risk and tame elevated blood pressure.
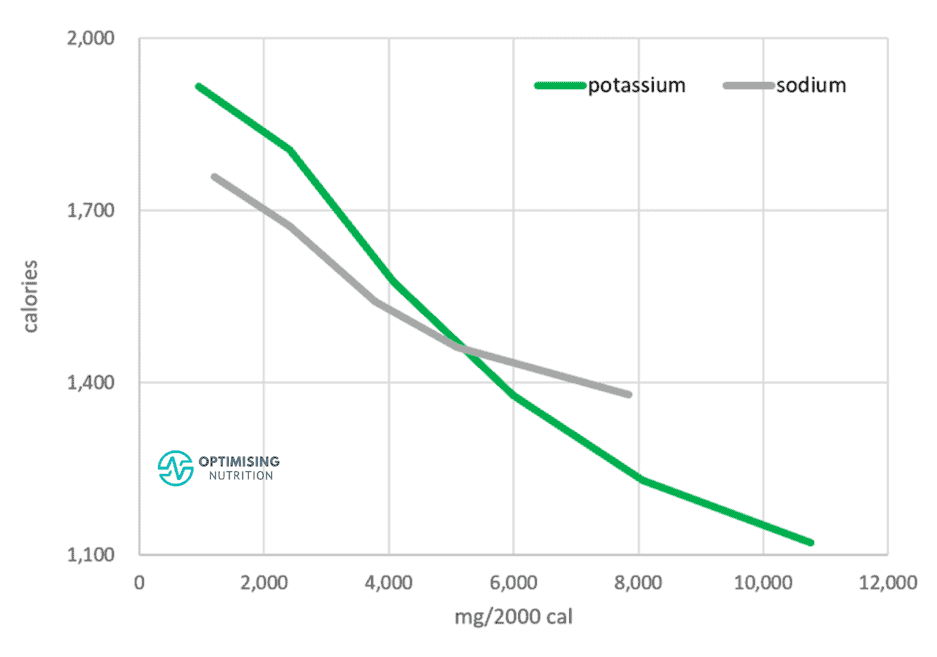
The chart below shows the average satiety response to potassium and sodium together. We can see that:
- we have a robust satiety response to both sodium and potassium,
- we tend to consume a similar amount of potassium and sodium (in grams), however
- potassium has a greater satiety response.
The following chart shows the potassium: sodium ratio vs calorie intake. Here, we can see that people who get more potassium than sodium tend to consume 5% fewer calories.

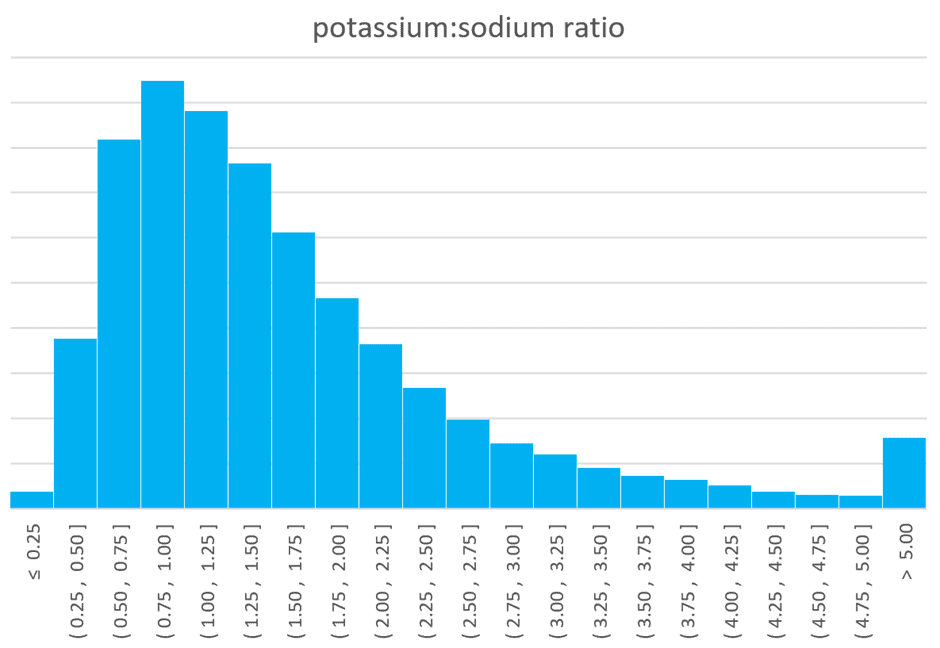
Finally, the chart below shows the distribution of the potassium: sodium ratio from our Optimiser data. We can see that the:
- average potassium:sodium ratio = 1.6,
- 15th percentile = 0.7, and
- 85th percentile = 2.5.
While you need adequate sodium, our analysis indicates that it is even more important to prioritise potassium. To coincide with this, we have set our Optimal Nutrient Intake (ONI) stretch targets at 4 g/2000 for sodium and 6 g/2000 calories for potassium.
While athletes and people with adrenal fatigue need more sodium to stay hydrated, replenish the salt they lose in sweat and satisfy their salt demands, more sedentary people often don’t need more sodium. This is especially true if they already consume processed foods that contain added sodium.
Sodium is one of the micronutrients we have a strong conscious taste for. Hence, most people find it easy to meet their sodium requirement by simply adding salt to taste. If your food tastes too salty, you’ve likely had enough salt. Because we crave sodium intensely, it is often added to processed foods so we buy and eat more of it.
However, it is theorised that our ancestors lived in an environment where salt was rare, and potassium was plentiful. Thus, we don’t have a strong taste or appetite for potassium. Hence, we must go out of our way to prioritise potassium in our food.
If you want to stay within the normal potassium:sodium range, you could use a 0.7 potassium:sodium ratio as a lower limit. This lower limit might benefit athletes who require more sodium.
If you are more sedentary and have health issues like obesity or hypertension, you could use a 1.5 potassium:sodium ratio as a stretch target to increase satiety and help you eat less.
For more details on the potassium: sodium ratio, see How Many Grams of Sodium Do You Need Per Day?.
If you’re interested in supplementing potassium, check out our Optimised Electrolyte Mix recipe for a hydrating beverage with the most critical minerals in more optimal ratios.
Zinc:Copper Ratio
Zinc and copper are essential microminerals that we need in small amounts. However, this ratio needs to be kept in balance.
Copper is vital for heart health, brain development, ATP production, antioxidant protection, collagen synthesis, and bone health.
For more on copper, check out our article, Copper Rich Foods and Recipes: A Practical Guide.
Meanwhile, zinc boosts immunity and ensures your body stays healthy and protected. It is required for more than 300 enzymatic reactions in the human body. We also need it for healthy sperm production, cell structure, regulated cellular communication, gene expression, and healthy growth and development in children.
For more on zinc, check out our article, Zinc-Rich Foods and Recipes: A Practical Guide.
Zinc also helps other nutrients to work in the body. For example, we need it to transport vitamin A into the bloodstream and absorb folate adequately. Too much zinc can interfere with copper absorption, which can lead to copper deficiency and inherent neurological ailments.
On the contrary, excessively high intakes of copper with low zinc have been attributed to several severe conditions, like:
- Anxiety, panic attacks, general inner tension
- Depression
- Fatigue
- Hypothyroid symptoms (cold hands and feet, brain fog, dry skin)
- Overly sensitive, obsessive thinking
- Insomnia and interrupted sleep
- Premenstrual Syndrome (PMS)
- Estrogen Dominance and Premenstrual Dysphoric Disorder (PMDD)
- Anxiety
- Fluctuating blood sugar and inherent cravings
- Mood swings and paranoia
- Constipation
- Autism
- Racing heart and palpitations
- Adverse reaction to vitamins and minerals from ‘copper dumping’ caused by supplements
- Poor attention span and a spacey feeling
- Eating disorders (anorexia, bulimia, overeating)
- Accelerated ageing
- Yeast infections from candida and other fungi
- Copper toxicity
- Cramping and body aches
Because many relationships rely on the intricate balance of the zinc:copper relationship, the ideal zinc:copper ratio is thought to fall between 8:1 and 15:1.
As the chart below shows, getting more of either of these minerals is not necessarily better. There is a point where the satiety response rebounds and eating foods that supply more of one mineral aligns with a slightly higher calorie intake.

However, a higher zinc:copper ratio aligns with a modest 3% reduction in energy intake.
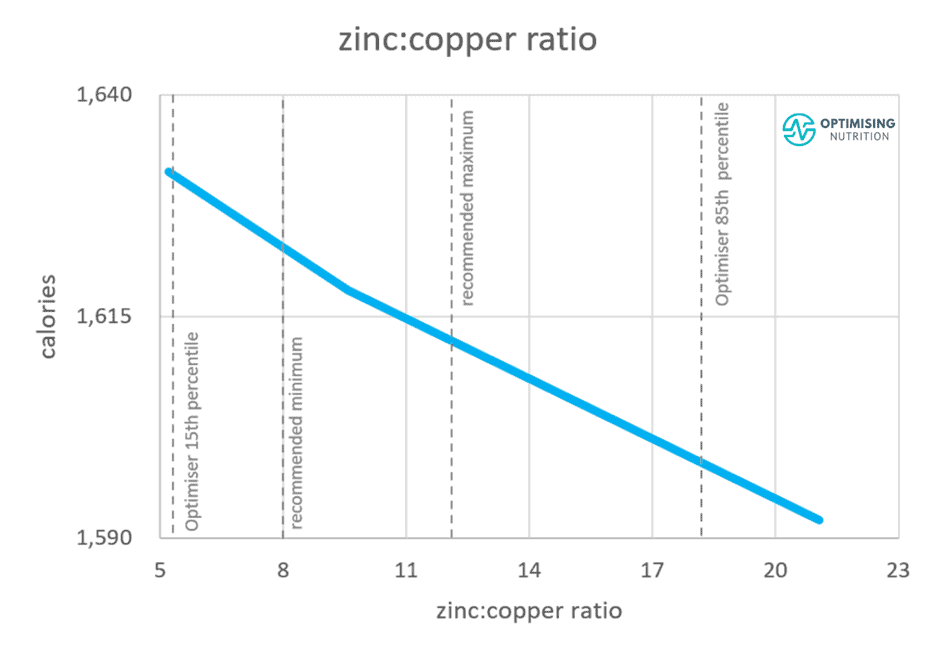
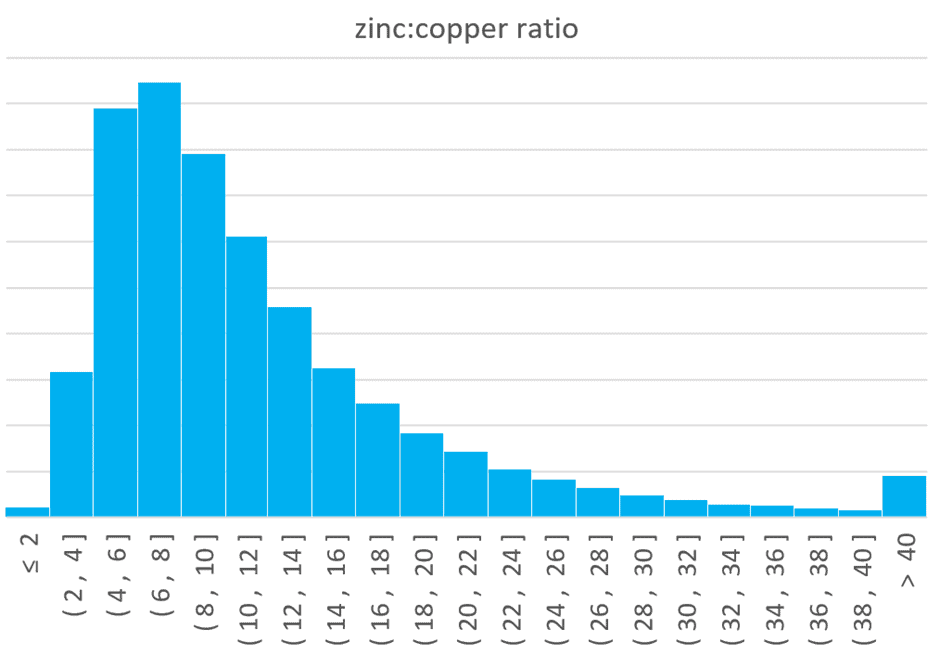
Analysis of our Optimiser data shows the:
- median zinc:copper ratio = 9,
- 15th percentile zinc:copper ratio = 5.2, and
- 85th percentile zinc:copper ratio = 18.3.
If you’re not taking any supplements or consuming any foods fortified with zinc or copper, you can be assured you’re in the normal range if your zinc:copper ratio is between 5 and 18. However, being on the higher end of this range will be better from a satiety perspective.
But if you’re supplementing with either zinc or copper, you should be mindful that concentrated bolus doses of supplements can bypass your gut’s natural absorption defences. Hence, you should work to keep your zinc: copper ratio strictly between 8 and 12 if you’re supplementing either of these minerals.
Calcium:Phosphorus Ratio
Similar to magnesium, calcium needs phosphorus to do its job correctly.
For more on calcium and where to find it, check out our article, Healthy High-Calcium Foods and Recipes.
Phosphorus is also required for strong bones and teeth, proper renal function, and a balanced pH. For more on phosphorus, check out our article, Phosphorus Foods: A Practical Guide.
While there is minimal research in this area, some believe a calcium:phosphorus ratio greater than 1:1.3 to be optimal.
As shown in the chart below, we tend to consume similar amounts of calcium to phosphorus. They also have similar satiety response curves.

However, although phosphorus is easy to obtain enough of, calcium tends to be harder to come by. When you are consuming plenty of protein, this is especially true. Calcium is a nutrient that many people struggle to get, especially if they reduce high-fat dairy products to try and increase their nutrient density.
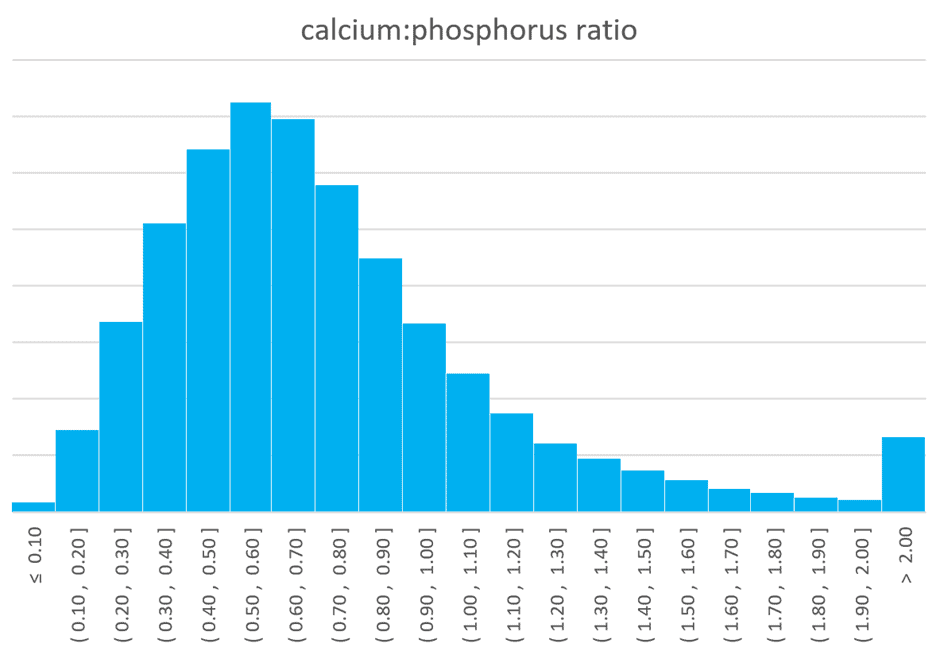
The distribution chart below shows the:
- median calcium:phosphorus ratio = 0.65,
- 15th percentile calcium:phosphorus ratio = 0.37, and
- 85th percentile calcium:phosphorus ratio = 1.08.
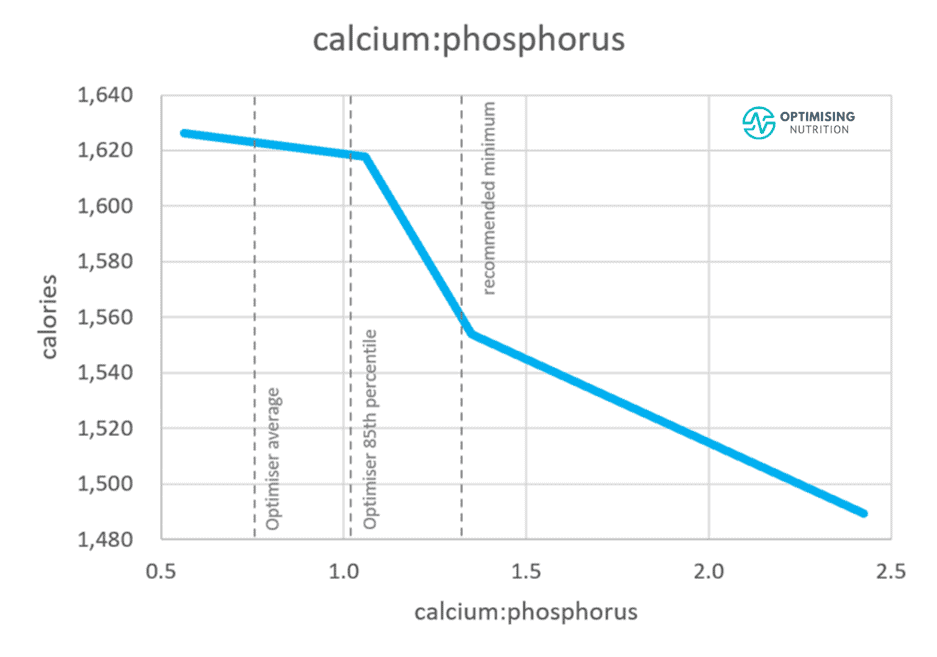
When we look at our satiety response to the calcium:phosphorus ratio, people consuming more calcium relative to phosphorus tend to eat about 8.5% fewer calories.
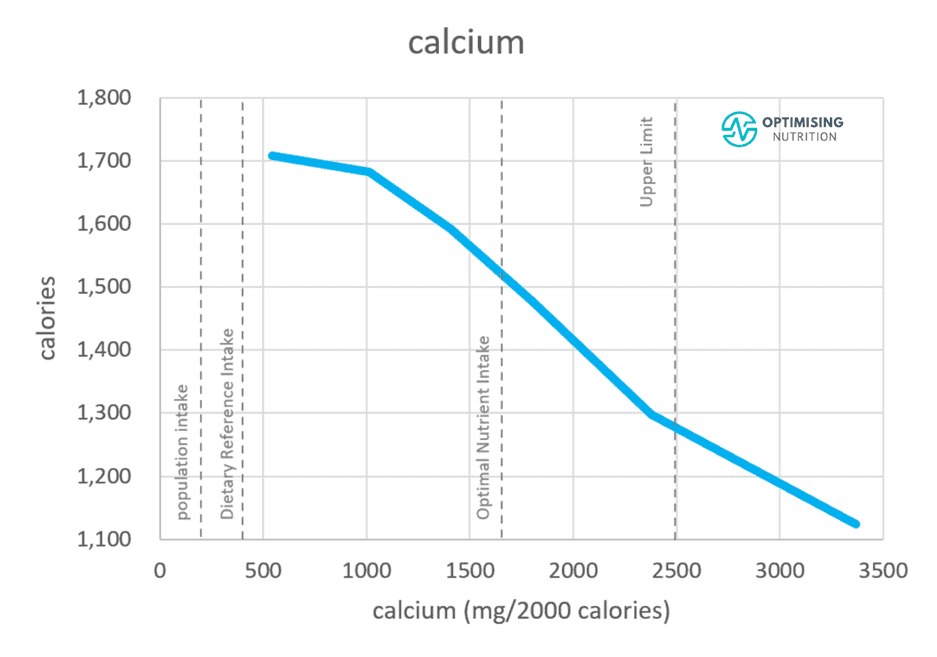
We also see a significant (36%) satiety benefit to consuming more dietary calcium. Thus, we have set our Optimal Nutrient Intake (ONI) to 1.6 g/2000 calories for calcium. This stretch target is challenging but achievable from food.
It’s important to note that calcium is best obtained from food, not supplements. Calcium supplementation tends to have more disbenefits than benefits. Studies suggest that a calcium-rich diet protects against heart disease, but supplemental calcium may increase the risk.
- A 2010 BMJ study found that those who used calcium supplements had a 139% greater risk of a heart attack, while increased calcium intake from food did not increase the risk.
- A meta-analysis of studies involving more than 12,000 people also found that calcium supplementation increased the risk of heart attack by 31%, stroke by 20%, and death from all causes by 9%.
- An analysis of 12,000 men found that more than 1,000 mg of supplemental calcium per day from multivitamins or individual supplements was associated with a 20% increase in the risk of death from cardiovascular disease.
Hence, we don’t recommend using supplements to optimise these ratios.
Calcium requires vitamin D3 for absorption and vitamin K2 to ensure it is stored in the bones and teeth instead of the arteries, joints, and ligaments. If you must supplement because of dietary restrictions, ensure you’re taking these three together.
In the early years of calcium supplementation, calcium was alone. This was when many of the adverse events were documented. In later years, vitamin D was added for absorption. It has only been in more recent years that the relationship between K2, D, and calcium was understood.
In practice, the typically recommended ratio of 1.3 times more calcium than phosphorus appears to be a lofty goal from food itself. So, rather than reducing dietary phosphorus, we suggest you focus on getting more calcium from the food you eat.
Fibre:Carbohydrate Ratio
Another ratio worth mentioning is the fibre:carbohydrate ratio, or the proportion of fibre relative to total carbohydrates.
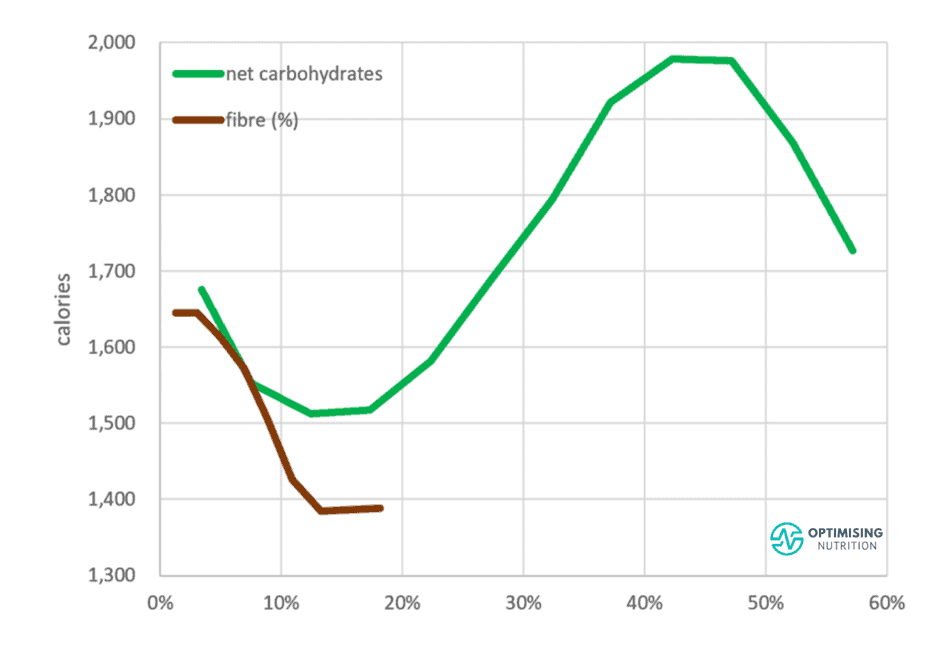
The chart below shows the satiety response to fibre and non-fibre carbohydrates together.
- Unless you’re consuming a low-fat diet with more than 50% of your energy from carbohydrates, reducing energy from non-fibre carbohydrates tends to align with a lower overall calorie intake.
- We also see that more fibre tends to have a beneficial effect on satiety up to about 11%.
It makes sense to prioritise less-processed carbohydrates, especially if you want to avoid overeating. Whole food carbs are likely more nutritious and digest more slowly, thus keeping you feeling fuller for longer.
For more info on how carbs and fibre influence satiety, check out our article, How Carbs, Fat, Sugar, and Alcohol Affect Appetite.
As shown in the chart below, people consuming 40% of their carbohydrates as fibre tend to consume up to a significant 22% fewer calories than the population’s average fibre:carbohydrate ratio.
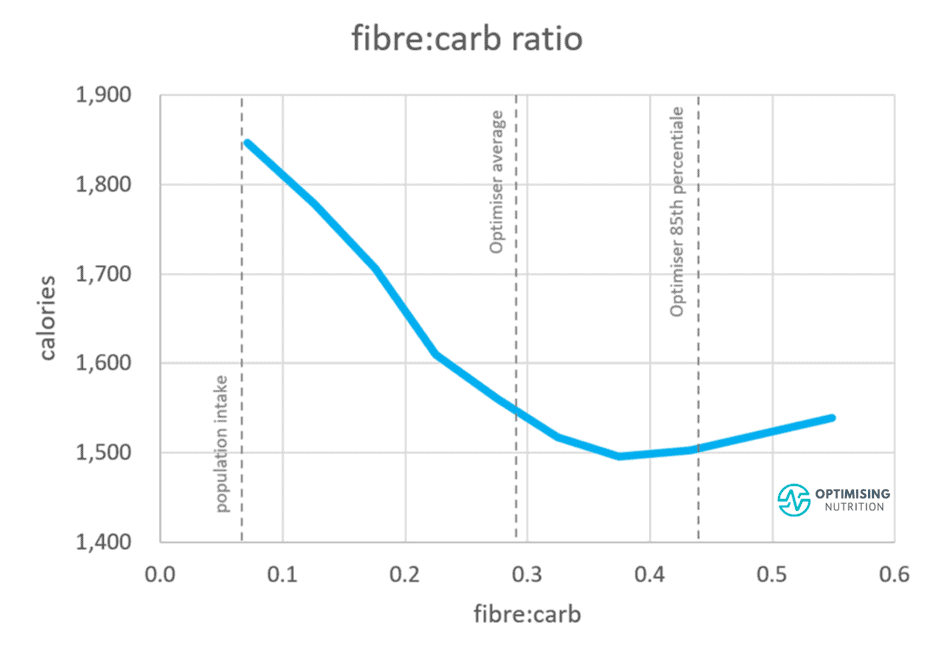
However, there is a limited satiety benefit from fibre. While a higher proportion of fibre may be helpful in terms of satiation (i.e., you can’t eat more of these foods in one meal), they do not help satiety (i.e., keeping you feeling fuller across the whole day).
As shown in the distribution chart below from our Optimiser data, the:
- median fibre:carbohydrate ratio = 27%,
- 15th percentile fibre:carbohydrate ratio = 14%, and
- 85th percentile fibre:carbohydrate ratio = 44%.

This data suggests that you should target at least 15% of your carbohydrates from fibre. However, you will experience greater satiety if your diet is closer to 40% fibrous carbohydrates.
Iron:Copper Ratio
Similar to our above nutrient relationships, iron and copper must be adequately balanced to avoid deficiency or excess in one another. Studies have shown that copper excess can accumulate in the liver during times of iron deficiency and vice versa.
The body requires iron to synthesise red blood cells and transport oxygen into cells. It also needs iron for healthy immune activity, enzyme production, and to protect the body from heavy metals. Iron and copper are used to synthesise antioxidant enzymes like superoxide dismutase (SOD). For more on iron, check out our article Iron-Rich Foods and Recipes.
The suggested iron:copper ratio is somewhere between 10:1 and 15:1.
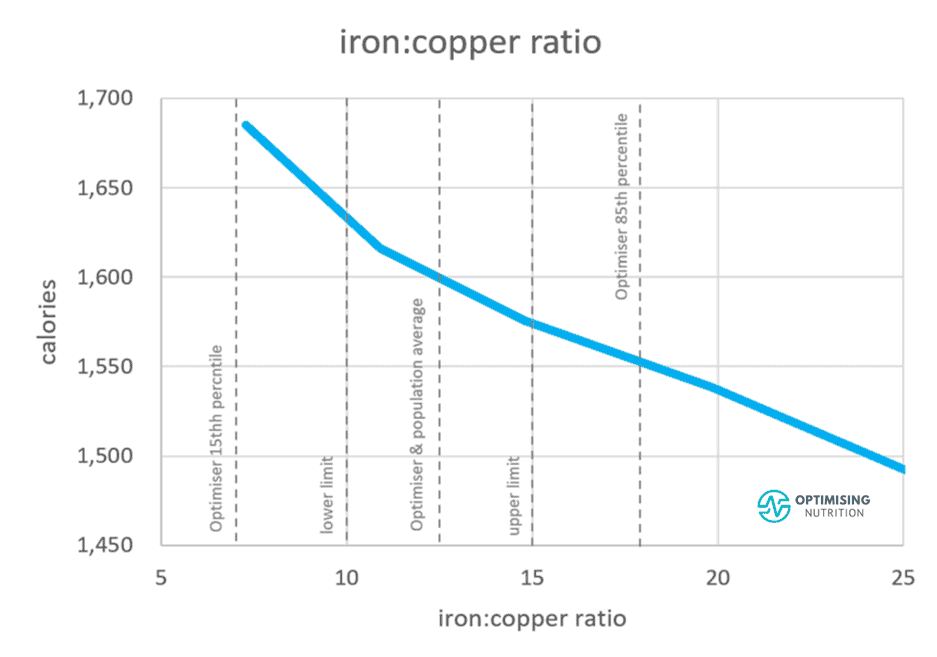
The chart below illustrates the satiety response we have to copper and iron together. Here, we can see that we have a much stronger craving for foods that contain more iron.

We consume less energy when our iron:copper ratio is higher.
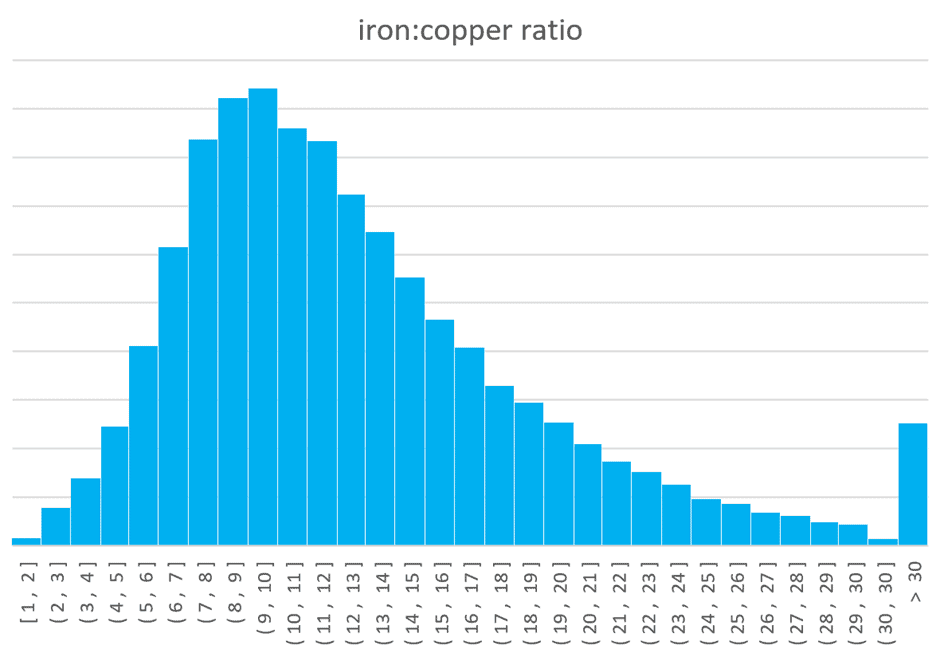
The distribution chart below shows that Optimisers have:
- A median iron:copper ratio = 11,
- A 15th percentile iron:copper ratio = 6.8, and
- An 85th percentile iron:copper ratio = 18.5.
While the Optimiser average is in the middle of the recommended range of 10 to 15, the iron:copper distribution amongst the Optimiser data is much broader.
So again, you likely needn’t be concerned if your iron:copper ratio is between 7 and 19 unless you are supplementing. But if you are supplementing, it will be safer to stay in the 10 to 15 target range.
Calcium:Magnesium Ratio
The human body needs adequate magnesium levels to properly use calcium, the most abundant inorganic mineral of the body. We need calcium for muscle contraction, sending nerve impulses, bone integrity, and maintaining a healthy pH. Calcium is also an antihistamine.

Meanwhile, magnesium deficiency affects calcium metabolism and alters the levels of certain hormones that regulate calcium metabolism. Besides calcium utilisation, we need magnesium for over 300 enzymatic reactions. It is required for muscle relaxation, fluid balance, hormone detoxification, and stress management, amongst other things. Almost half of the US population is not meeting their recommended magnesium requirement.
For more on magnesium, check out our article, Magnesium-Rich Foods: A Practical Guide.
High intakes of calcium may interfere with magnesium status by reducing intestinal absorption and increasing urinary losses. On the flip side, magnesium deficiency is known to induce calcium deficiency.
Like zinc and copper, calcium and magnesium have a synergistic and antagonistic relationship. This means they also compete and interfere with each other’s functions if they are out of balance (i.e., if one is much higher than the other).
Magnesium may prevent calcium from contracting muscles when the ratio of magnesium to calcium is unfavourable. If calcium is too high and magnesium is too low, muscles may not be able to contract.
The ideal calcium:magnesium ratio is said to be 2:1 to minimise cardiovascular risk. However, even Cronometer’s blog on the topic notes a lack of research supporting this recommendation.
The chart below shows that our satiety response to calcium is much stronger than to magnesium.
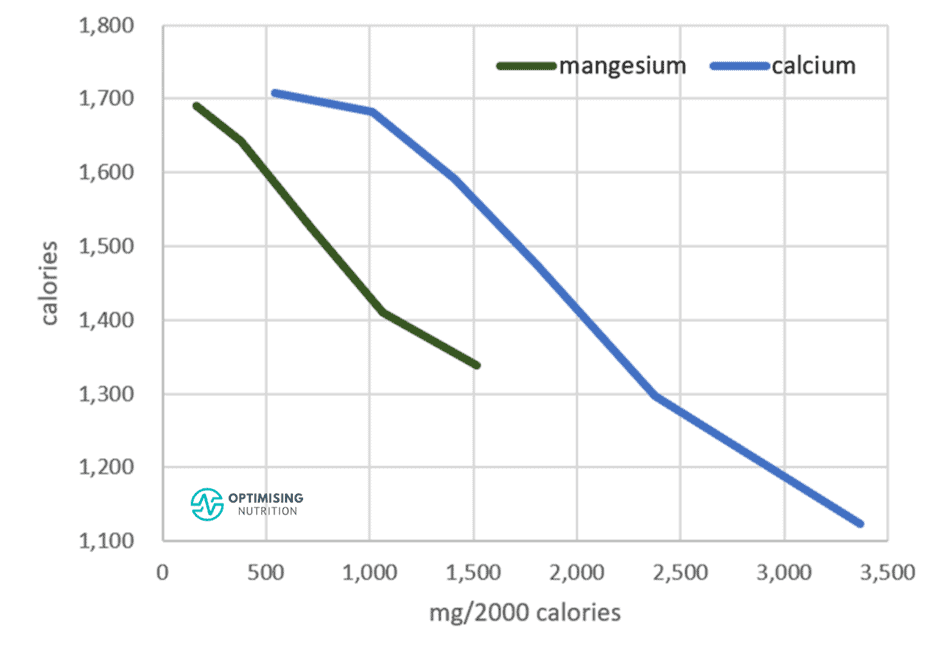
We eat 9% fewer calories when we consume more calcium than magnesium.
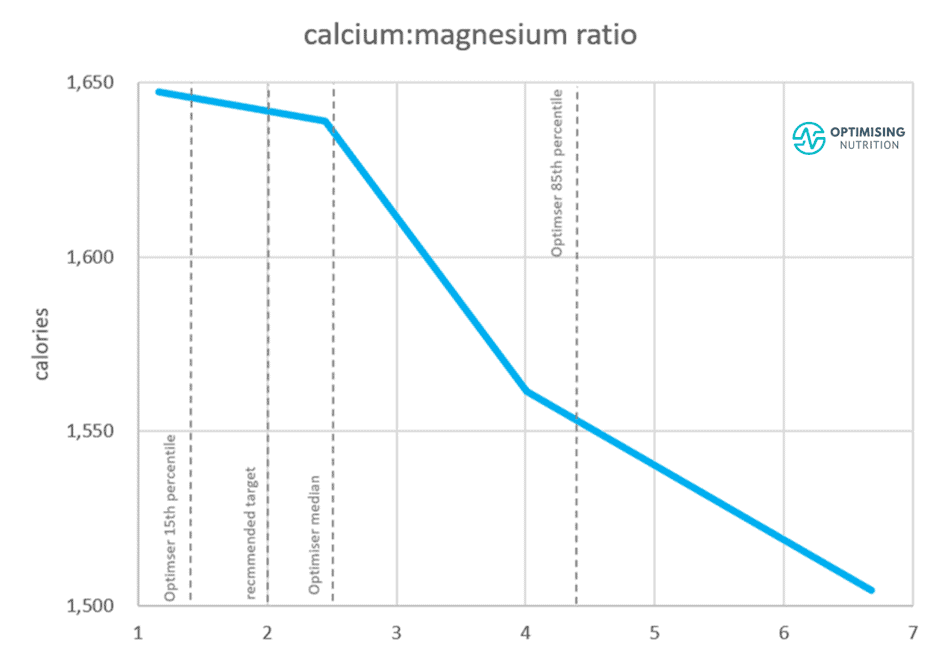
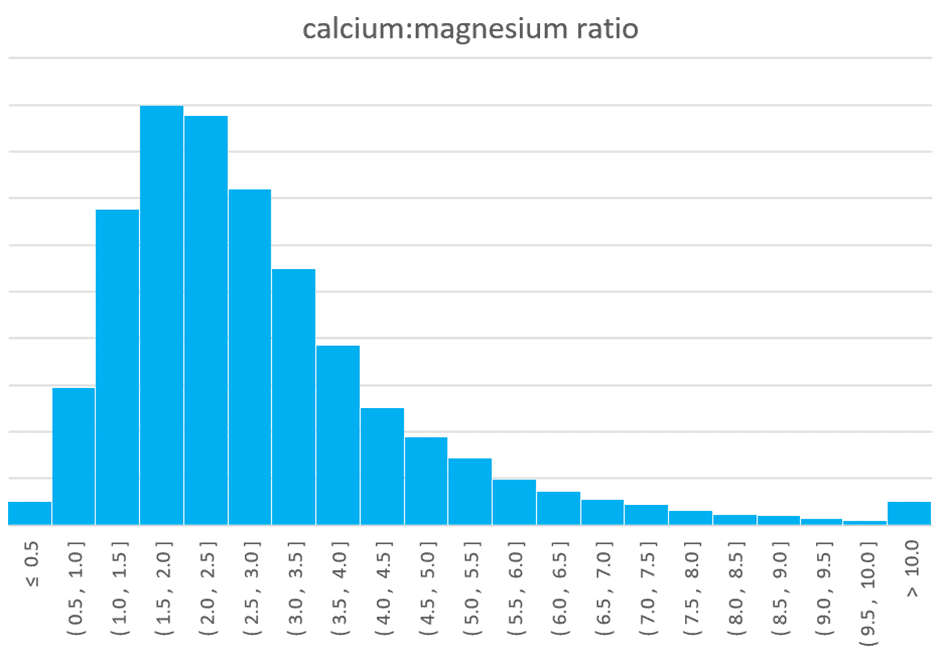
Our Optimiser data analysis shows that the:
- median calcium:magnesium ratio = 2.5,
- 15th percentile caclium:magnesium ratio = 1.4, and
- 85th percentile calcium:magnesium ratio = 4.3.
While it is prudent to limit calcium supplementation to avoid a calcium:magnesium ratio greater than 2, having a higher calcium intake relative to magnesium seems beneficial when supplements are not utilised.
Omega 3:6 Ratio
One of the most well-known micronutrient ratios is the omega-6:omega-3 ratio. While you need some omega-6 fatty acids, excessive amounts can cause inflammation and outnumber anti-inflammatory omega-3s. For more on what omega-3s do for you, check out Omega-3 Foods: A Practical Guide.
Before the advent of agriculture, we would have likely obtained a similar amount of more omega-3 fatty acids than omega-6. However, due to our heavy reliance on oils, grains, and animals fed grains today, the average omega-6: omega-3 ratio in the modern day is between 12:1 to 25:1.

Even Optimiser data shows an average omega-6:omega-3 ratio of 7.

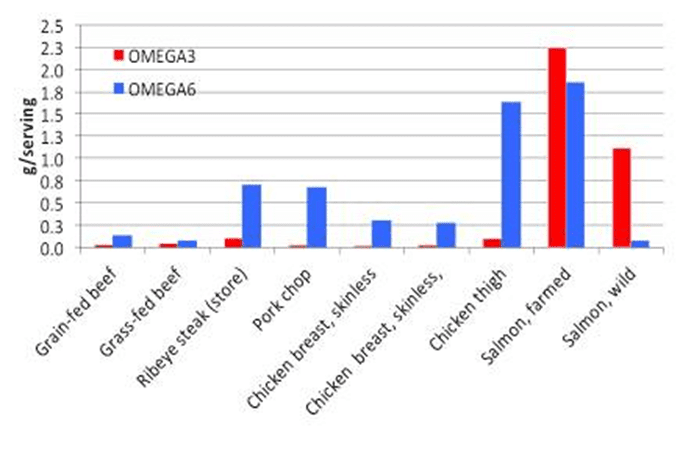
Even if you avoid bread and vegetable oils, the omega-6:omega-3 ratio in the food system is still relatively high in many animal foods fed on grains, especially farmed beef, pork, fish, and poultry.
Epidemiological studies suggest that a low omega-3 fatty acid intake can contribute to mental illnesses like depression, schizophrenia, ADHD, personality disorder, and bipolar disorder. Other conditions like cardiovascular disease, hormone imbalance, and arthritis have also been linked to an imbalanced omega 6:3 ratio.
The general recommendation is to aim for less than a 4:1 omega 6:omega 3 ratio and ideally closer to 1:1.
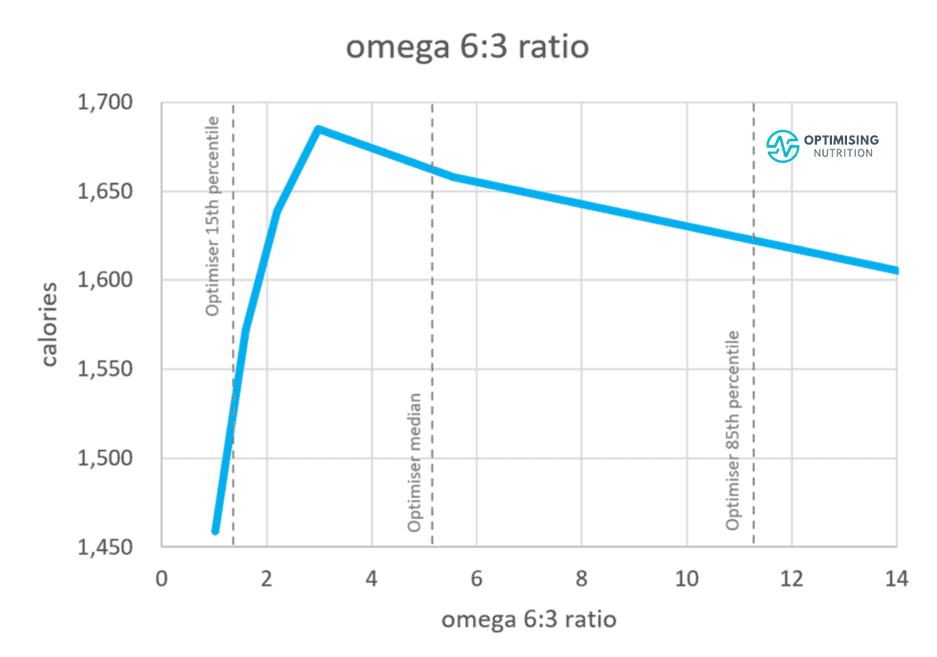
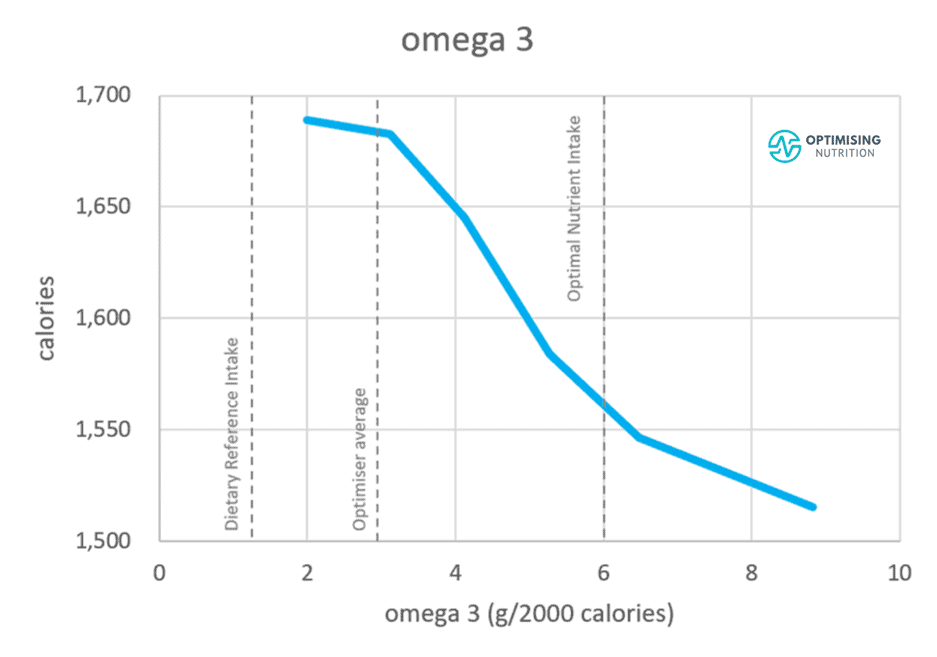
When we look at the omega-6:omega-3 ratio from our Optimiser data analysis, we see that although it correlates with the most significant satiety impact, it’s not a linear relationship. An omega-3:omega-6 ratio of 3 aligns with the maximum calorie intake. However, this may simply be because reducing your omega-6 intake dramatically reduces your overall calorie intake. For more on how different fatty acids influence satiety, check out our article, Which Fats Will Make You Skinny?
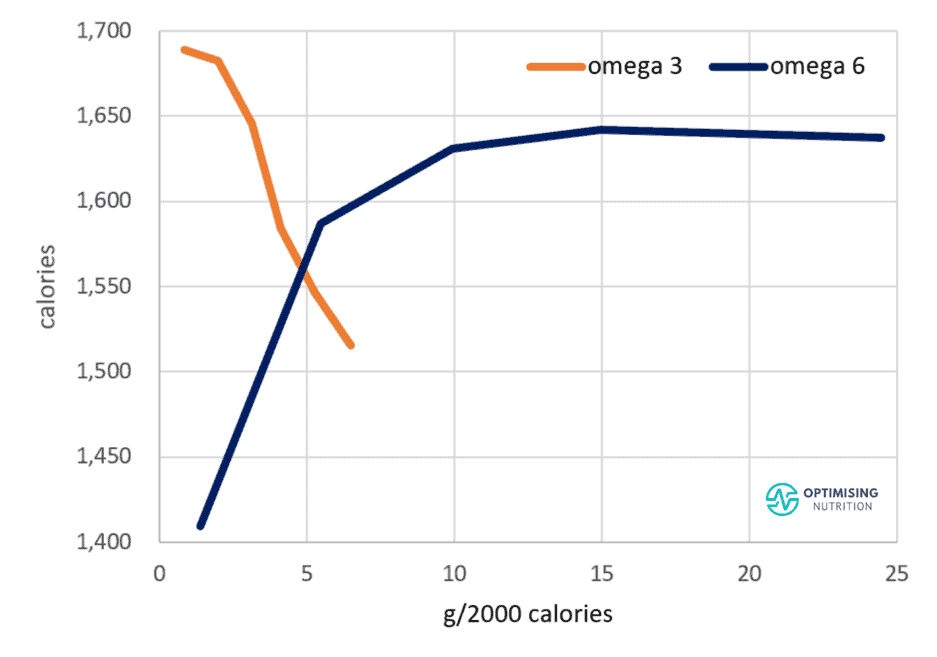
When we look at omega-3 and omega-6 separately, we see that more omega-3 aligns with a lower overall energy intake (by 4.5%).
However, foods and meals with more omega-6 align with a much greater energy intake (i.e., 14%).

When we plot omega-6 and omega-3 intakes on the same chart, we see that the consumption of omega-6 is much greater than omega-3, even in this Optimiser population.
While most people would benefit from consuming more seafood that provides omega-3 naturally, the most significant satiety benefit would come from decreasing the intake of foods containing industrial seed oils as ingredients. To improve satiety, you could target an omega 6 intake of less than 5 g/2000 calories or less than 2% of your total calorie intake.
Summary and Recommendations
The various nutrient balance ratios should not be a significant concern if you simply chase your priority nutrients from whole foods guided by Nutrient Optimiser.
The table below summarises the various ranges for each ratio (i.e., lower 15th percentile, median, and stretch target) based on the analysis of the Optimiser data that you can use as a guide
| Ratio | Range | Lower | Median | Target | Comment |
| zinc:copper | 8 – 12 | 5.2 | 9.0 | 18.3 | Target narrower range if supplementing. |
| potassium:sodium | > 2 | 0.7 | 1.6 | 2.5 | Lower target if athlete. Higher potassium:sodium ratio for weight loss. |
| calcium:magnesium | < 2 | 1.4 | 2.5 | 4.3 | Keep calcium:magnesium < 2 if calcium is coming from supplements. Otherwise, target optimal calcium from whole food. |
| iron:copper | 10 – 15 | 7 | 11 | 18 | Target narrower range if taking supplements or fortification. But chase ONI iron target for satiety and weight loss from whole foods. |
| calcium:phosphorus | > 1.3 | 0.4 | 0.65 | 1.1 | Target Optimal calcium intake from whole food. Most people don’t need to prioritise phosphorus. |
| omega-6:omega-3 | < 4 | 0.5 | 7 | < 3 | Avoid industrial seed oils and prioritise seafood. |
| fibre:carb | – | 15% | 40% | Carbs should be minimally processed carbs and contain plenty of fibre. |
How Nutrient Optimiser Uses the Micronutrient Balance Ratios
Our analysis has shown that de-prioritising single nutrients you want to avoid leads to a lower nutrient density overall.
While you can easily take less of a particular supplement, in practice, you can’t remove nutrients from a whole-food diet. But you can prioritise the nutrients you need more of while ignoring the ones you might want to avoid. As you prioritise foods that contain other nutrients, the other nutrients will decrease.
To help Optimisers balance their micronutrient ratios in the Micros Masterclass, Nutrient Optimiser reviews your nutrient profile to pinpoint and identify any shortcomings. From there, it recommends foods and meals that contain more of the nutrients you are not getting enough of. At the same time, it refrains from recommending foods high in nutrients you’re already getting plenty of.
Instead of trying to piece together which foods give you the perfect ratios of the nutrients you need, Nutrient Optimiser recommends nutrient-dense, whole-food recipes to complement your current way of eating and keep your nutrient ratios balanced.
If you are using supplements or fortified foods, you should stick with the tighter ranges (shown in the left-hand column in the table above) to ensure you are not driving imbalances and decreasing absorption of any complementary nutrients.
More
- How to Get the Most Out of Cronometer
- How to use Nutrient Optimiser
- Optimising Your Food and Meal Choices
- Why are Micronutrients So Important?
- Micronutrient Deficiencies in Popular Diets
How Can I Calculate My Nutrient Intake?
If you’re interested in checking if you’re getting just enough dietary phosphorus, you can check your nutrient profile using our Free 7-Day Nutrient Clarity Challenge.
After a week of tracking your current diet in Cronometer, Nutrient Optimiser will give you a prioritised list of foods and NutriBooster recipes that will help you plug your current nutritional gaps.
Level Up Your Nutrient Density
To help you level up your nutrient density, we’ve prepared a Nutritional Optimisation Starter Pack to ensure you are getting plenty of all the essential nutrients from the food you eat every day.
The free starter pack includes:
- Maximum Nutrient Density Food List
- Sample Maximum Nutrient Density Recipe Book
- Sample Maximum Nutrient Density Meal Plan.
To get started today, all you have to do is join our new Optimising Nutrition Group here.
Once you join, you will find the Nutritional Optimisation starter pack in the discovery section here.
Nutrient Density Index
Minerals
Vitamins
- Vitamin A
- Vitamin E
- Thiamine (B1)
- Riboflavin (B2)
- Niacin (B3)
- Pantothenic acid (B5)
- Vitamin B6
- Folate (B9)
- Vitamin B12
- Vitamin C
- Vitamin D
- Choline
- Vitamin K1
Thanks for this detailed summary Marty!
Do you think the cause of an electrolyte imbalance is always directly related to the consumption of the respective electrolytes or is there evidence of other causes being involved?
Are there any other causes of imbalance outside of dietary?
Cheers!