
- The real magic of ketosis seems to occur in a lower energy state.
- High levels of beta-hydroxybutyrate ketones (BHB) can be a good sign, particularly with lower blood glucose levels.
- Unfortunately, forcing extra energy in the pursuit of higher BHB levels (e.g. exogenous ketones or refined fat) has the potential to drive higher insulin and insulin resistance.
- As we lose weight, improve our metabolic health and stop over-fueling, many people start to see lower levels of BHB.
- While it can be used as an alternative to glucose in the brain, BHB needs to be converted to acetoacetate to be used by the body.
- If you make ketones without consuming excessive energy, you will likely see lower blood glucose, higher breath acetone and lower BHB levels.
- The ratio between breath acetone and glucose can be a useful indicator of genuine nutritional ketosis and a healthy metabolism.
- Introduction
- What is ketosis?
- Are ketones magical?
- Oxidative priority
- Low carb and weight loss
- Blood sugar and HbA1c
- The risk of focusing on beta-hydroxybutyrate as your measure of ketosis levels
- The glucose:BHB index
- The glucose : acetone index
- Are breath ketones a better measure of health than BHB?
- Why does the balance of acetone vs. BHB vs. BrAce matter?
- Tell me what to do!!!
- How to get higher NAD+ levels and higher acetoacetate
- How to get lower blood glucose levels
- How Can I Calculate My Nutrient Intake?
- Level Up Your Nutrient Density
- More
- Thanks
- References
Introduction
In previous articles, we’ve looked at why chasing higher blood ketones with more dietary fat or exogenous ketones might not be smart.[1] [2]
We also looked at the glucose:ketone ratio as a useful parameter to track therapeutic ketosis (i.e. for the management of epilepsy, dementia, Alzheimer’s, Parkinson etc.).[3] [4]
This article looks at the ratio between acetone (a form of ketone that can be measured on your breath) and your blood glucose.
What is ketosis?
Ketosis is trending hard at the moment.

But what is it?
And do you really need more of it?
Some people think we must be “in ketosis” to burn fat. Hence, many people think that more ketosis is better, especially if you have body fat you want to burn. While this belief helps sell keto-related products, it’s technically not correct.
Ketosis is simply an alternative metabolic pathway that our body uses when there is not enough oxaloacetate in our diet (from carbs or protein) to burn fat via the Krebs cycle. When this occurs, the fat that can’t be oxidised in the Krebs cycle is oxidised via ketosis.

People following a typical Western diet will have lower levels of blood ketones (e.g. 0.1 or 0.2 mmol/L),[5] while people eating more fat and fewer carbs tend to have higher levels of ketones.
The fact that we can use this backup metabolic pathway has helped us survive many a famine to procreate another day. Ketosis is a critical component of our metabolism and our survival as a species.
Are ketones magical?
Our understanding of ketones and ketosis is evolving fast.
Some people believe that ketones have unique and special signalling properties.[6] [7] Others feel that these beneficial properties of ketosis are limited to endogenous ketosis (i.e. when we predominantly burn stored body fat).[8]
When our energy levels are low, we also see an upregulation of mitochondrial biogenesis, sirtuins, autophagy and NAD+, which are also highly beneficial.
But perhaps all of these things working together cause the benefits that many people associate with “being in ketosis”, not just the ketones themselves.
When energy levels are low, our body goes into repair mode to ensure survival, and we switch to burning body fat. Our blood ketones rise significantly after a few days without food.
The chart below shows about three thousand data points from people following a low carbohydrate or ketogenic diet simultaneously measuring blood ketones and blood glucose. Blood ketones (shown in blue) are not necessarily high for most people while they eat normally, even if blood sugar levels are low (shown as orange).

We can drive high blood ketones by taking exogenous ketones and/or lots of refined fat (the right-hand end of this chart). But, unless you’re about to do some explosive exercise to burn off all this energy, this over-fueling may not be optimal.
Oxidative priority
Our appetite does an excellent job of making sure we get the fuel if it’s available. While our bodies are adapted to deal with a range of fuel sources, they struggle to deal with too much energy for a long time.
The chart below (from a paper by Ray Cronise, David Sinclair and Andrew Bremer, with the addition of exogenous ketones courtesy of Craig Emmerich) shows the order in which we generally prioritise using different fuel sources.

- Alcohol will be burned off first because it’s effectively a poison that the body can’t store. (Alcoholics can have really low HbA1c levels because insulin rises to shut off the release of glucose into the bloodstream while the alcohol is burned off.[9])
- Similar to alcohol, ketones are used up as a priority because we can’t channel them back into storage in the body. Ketones are acidic and high levels of ketones in the blood lead to diabetic ketoacidosis. (Note: As discussed below, Beta-hydroxybutyrate (BHB) can be thought of as the storage form of ketones. While BHB can be used directly by the brain, it needs to be converted back to acetoacetate to be used by the rest of the body.)
- Protein is not a great fuel, so we can’t store much of it in the blood. It’s hard for the body to convert protein to energy, so it’s hard to overeat.[10]
- Carbohydrates can be a useful source of fuel for explosive efforts. But glucose can be toxic in large quantities (it leads to glycation), so the body tries to limit the amount in the bloodstream.
- If glucose levels are high, the body won’t burn off the fat from our diet. Fat is last in line to be burned because it’s such an effective way of storing energy.
- Similarly, if the level of fat in our diet is high, we won’t burn off the fat on our body effectively. (High levels of fat in the bloodstream can lead to oxidised LDL, so the body wants to keep it moving rather than building up high levels.)
Your body increases insulin to hold back the release of stored energy until the energy in the blood decreases. As you burn through all these fuel sources, the body decreases your insulin levels to eventually allow the release of your stored fuel for use to make up the difference.
You can think of a lower energy state as one where you don’t have a lot of fuel lined up in front of your body fat, while a high energy state occurs where your body has to ramp up insulin levels to hold your stored energy back from being used while the energy from your mouth is being used.
When you look at it from this perspective, you see that good nutrition is essentially a process of optimising our food choices to ensure we get the nutrients and fuel we need without stacking up too much energy in front of our body fat stores.[11] [12]
Low carb and weight loss
More stable blood glucose levels can help people normalise their appetite. People often eat less when they are no longer on the blood glucose roller coaster.
However, BHB levels often typically taper off over time, especially if you are lean, active, metabolically healthy and weight stable.
It seems that as our fat stores become ‘less full,’ we don’t store as much energy in the bloodstream. And, as we will see later, once our NAD+: NADH ratio increases, less acetoacetate is pushed off into storage as BHB.
One of the most fascinating outcomes of the one-year Virta study was that over the period of a year, participants’ BHB levels went from 0.17 mmol/L to an average of 0.54 mmol/L after 10 weeks and then settled back to 0.3 mmol/L after a year.[14]

I found it ironic that in this study of treating diabetes with a ‘ketogenic diet’ that, on average, these people only temporarily dipped into “nutritional ketosis” (defined as having BHB > 0.5 mmol/L). Then in the long term, they settled back to much lower levels of BHB.

At no time did they go near “optimal ketosis” (as defined as having BHB between 1.0 mmol/L and 3.0 mmol/L[15]).

Blood sugar and HbA1c
While the science around ketosis is still controversial, we do know that a lower HbA1c and lower blood sugar levels can be beneficial in terms of long-term health and avoiding many common killers (e.g. diabetes, heart disease, cancer, stroke etc).
The chart below shows that an HbA1c of 4.5% (i.e. a proxy for your average blood sugar level) gives the lowest hazard ratio (i.e. lowest risk of mortality from all causes).[16] [17]

As shown below, a lower HbA1c is beneficial in terms of reducing your risk of stroke, heart disease, cardiovascular disease and many modern diseases.


The risk of focusing on beta-hydroxybutyrate as your measure of ketosis levels
However, if at first, you don’t succeed in achieving “optimal ketone levels” many people resort to the following to raise their blood ketone levels:
- load up on high levels of refined fat, such as Bulletproof Coffee with butter and MCT oil,
[Warning: These foods are typically more energy-dense and less satiating, so many people find them easy to overeat. While most people don’t need to avoid dietary fat, simply eating ‘fat to satiety’ doesn’t lead to long-term weight loss for many people.]
- eat less protein to reduce oxaloacetate and force more fat to be burned via ketosis rather than the Krebs Cycle,
[warning: Replacing energy from protein and carbohydrates with fat can lead to a less nutrient-dense selection of foods],

- eat a more acidic diet with fewer electrolytes to ensure that the keto acids are not able to be balanced with alkaline minerals such as magnesium, potassium and calcium), or
[warning: This approach may lead to the keto flu in the short term and insulin resistance[19] and metabolic acidosis in the longer term.[20]]
- eat a diet that contains fewer B vitamins to decrease your NAD+:NADH ratio to force more acetoacetate to be stored and converted to BHB.
[Warning: B vitamins are important for efficient and effective energy production].
The glucose:BHB index
So we do know that lower glucose levels are a good thing and high blood ketones are not necessarily bad. They can actually nourish the brain if we are insulin resistant and aren’t using glucose well, and this is helpful where therapeutic ketosis is required (i.e. Alzheimer’s, epilepsy, Parkinson’s, cancer etc.).
However, high ketones are not great if accompanied by high blood glucose levels and/or free fatty acids. So, the way to ensure we are not overloading our system in our pursuit of ketosis is to ensure that lower glucose levels also accompany our higher ketone levels.
Enter the glucose: ketone index developed by Professor Thomas Seyfried of Boston College[21] [22] to help optimise the metabolism of cancer patients.
Seyfried subscribes to the Warburg hypothesis of cancer, which says that cancer cells ferment glucose and, hence, reducing the glucose supply to cancer cells can help them slow proliferation.

To help understand what this looks like in practice, I plotted more than 1200 blood glucose versus ketone values in the chart below and divided them up into five groups based on their GKI value. The charts show the average GKI values of these data point groups (i.e. GKI = 1.5, 2.8, 4.5, 7.5 and 20).
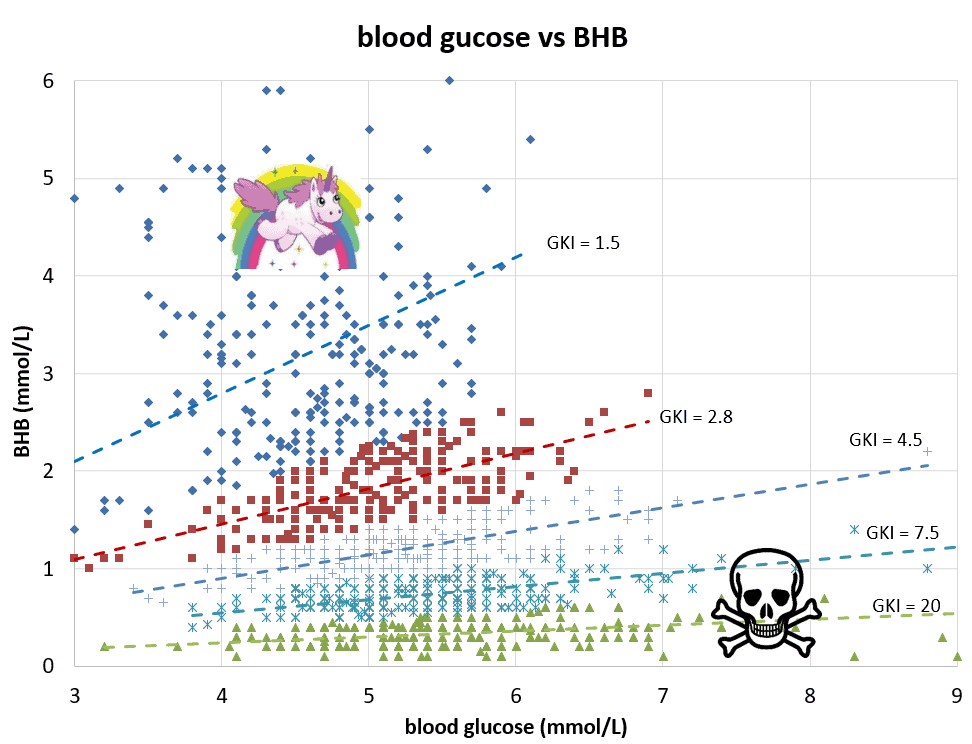
The worst metabolic health is the GKI = 20 population (green dots at the bottom of the chart) with high blood glucose levels and low ketones. This means that glucose values are twenty times that of the ketone values.
Meanwhile, the people with the lower glucose and the higher ketone are likely to be in a better place metabolically. They will be more likely to experience the positive therapeutic benefits associated with “being in ketosis”.
Before you go chasing a super low GKI value, be aware that most people are not going to get GKI values under than 2.0 until they fast for a few days, even if they are following a ketogenic diet. The chart below shows what you could expect if you fasted for seven days.

The glucose : acetone index
Both Michel Lundell from Ketonix and Dave Korsunsky from Heads of Health recently told me that, building on the GKI concept, a number of people are finding it more useful to track the ratio between their breath acetone readings and their glucose levels.
In order to better understand the relationship between breath acetone and ketones, I have plotted about two and a half thousand glucose and breath ketone readings taken at the same time in the chart below.
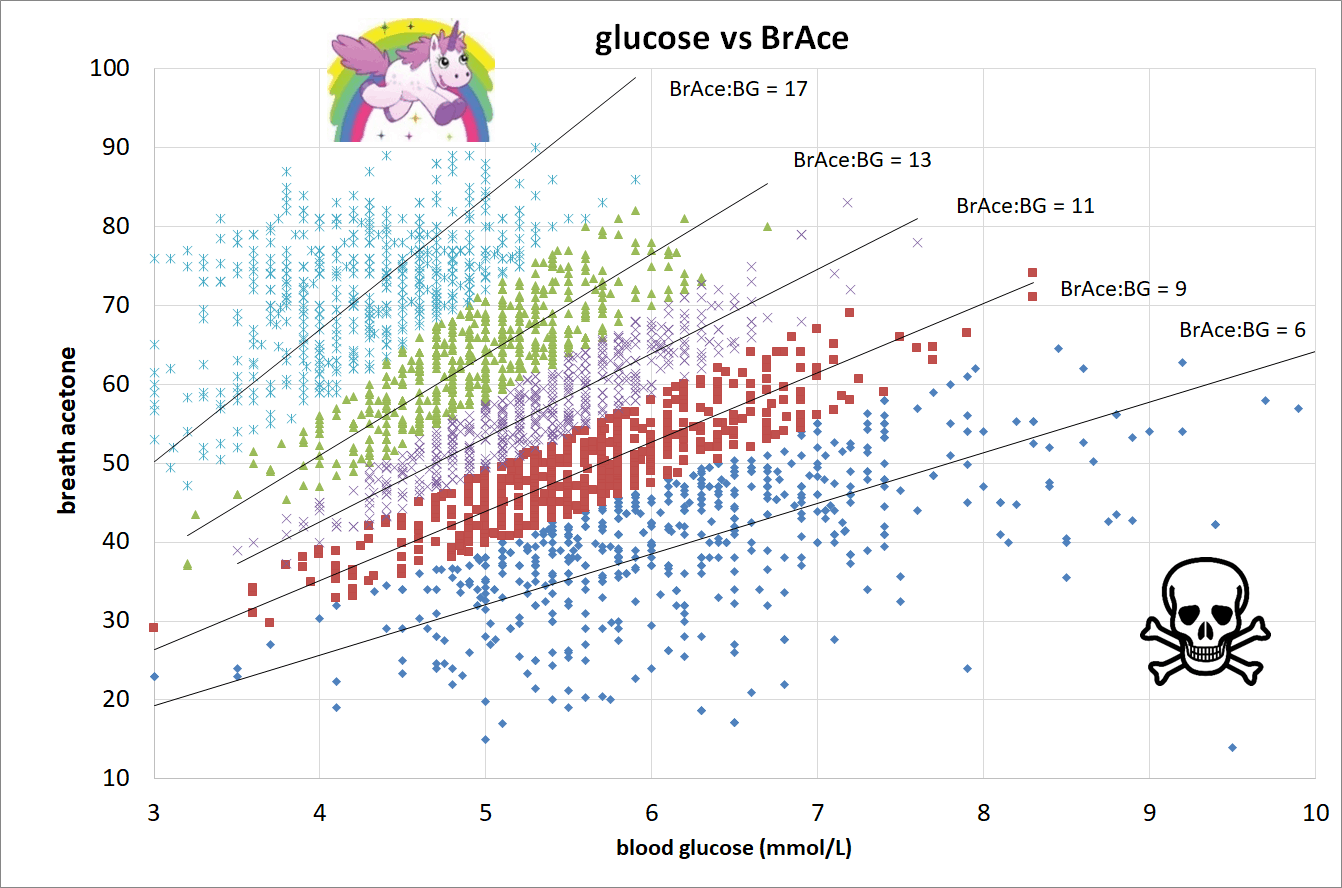
You can see from this chart that there is a similar relationship between glucose and breath ketones as with blood ketones. However, there is less scatter compared to the previous chart. It seems that blood glucose and breath acetone are more closely correlated than blood ketones.
It’s hard to have high breath acetone with high blood glucose levels. You can’t ‘game the system’ in the same way you can with BHB by forcing in exogenous fat or ketones.
As your energy and insulin levels start to rise, more of your acetoacetate will be shunted off to storage as BHB. So, while some refer to BHB as ‘the gold standard”, it’s hard to know whether high blood ketone values are due to a low energy state or if your bloodstream is full of energy so you need to store more as BHB.
The optimal situation to be in is to have lower blood glucose levels with a solid amount of breath acetone in your system, which suggests you are producing ketones without driving excess energy.
If you have good metabolic health, you’ll probably be in the purple or green area on this chart. If you are achieving a therapeutic level of ketosis or fasting for longer periods, you will ideally be in the upper left corner of this chart (green or light blue) with low glucose and high-breath ketones.
The chart above shows breath acetone (BrAce on the Ketonix scale of 0 to 100) and blood glucose in mmol/L. To calculate your BrAce:BG ratio, you can divide your Ketonix reading by your blood glucose level. If you’re going to measure, it’s probably better to measure your glucose and ketones in the morning when you first wake up. The key is to measure these values all at the same time. While it’s interesting to see how you compare with others, it’s most important to ensure your values move in the right direction over time.
The chart below shows glucose vs. breath acetone with glucose in mg/dL (American units). If you have Ketonix and a blood glucose meter, you can test and see how you compare.

Are breath ketones a better measure of health than BHB?
If you’re interested in this topic, I recommend you watch this video from Chris Masterjohn that explains how ketones are made and used in detail.


In summary:
- Acetoacetate is the first ketone body made in the liver (unfortunately, it’s hard to measure in the bloodstream).
- If your NAD+:NADH ratio is low, more acetoacetate will be converted to BHB, which can be measured in the blood.
- While the brain can use BHB directly, BHB needs to be converted back to acetoacetate for the rest of the body.
- When the energy level in your bloodstream decreases, your NAD+:NADH ratio increases and insulin levels decrease. You can then shuttle the ketones stored as BHB back to acetoacetate for energy in the rest of the body.
Acetone is like a vapour released from acetoacetate, similar to nail polish fumes. If you release a high level of breath acetone, then people might say you have a ‘fruity’ smell on your breath, or you will experience a different, metallic taste in your mouth.
It’s difficult to measure acetate in the blood, but devices like the Ketonix are becoming more popular to measure acetone in your breath. Acetone on your breath is not a direct measure of the quantity of acetoacetate in your system, but it’s a useful proxy. Imagine the difference in smell if you have a small thimble versus a massive drum of nail polish. You’ll get more fumes coming off a large amount of acetone.
The take-home point here is that if our NAD+:NADH ratio is high, and our overall energy levels are low, then not as much acetoacetate will be converted to BHB, and hence more acetoacetate will be available in the blood, and more acetone will be measured on the breath.
Meanwhile, if you have excess energy in your system, you will have high levels of ketones in their “storage form” available for use only by the brain. Conversely, if you have a lower energy state that is more conducive to burning body fat, you may have less BHB and more acetoacetate.
So, breath acetone is more of a measure of ketones ready to be used by your body, while BHB is more of a measure of ketones being stored for later use.
Why does the balance of acetone vs. BHB vs. BrAce matter?
NAD+ is a metabolite that declines with age.[23] A lot of the anti-aging research at the moment is focusing on how we can boost NAD+ levels.[24] [25] [26] [27] [28] IV NAD+ treatments are being used for drug addiction, anti-ageing and quick recovery from a really big night.[29] [30] [31]

The secret here is that, while you can take supplements and injections to boost NAD+, most people can get plenty from B vitamins (particularly vitamin B3 (niacin), which is dirt cheap).[32]

NAD is also made from tryptophan in the diet.

NADH builds up when we become over-fueled and is typically higher in conditions such as diabetes.[33] When we eat and get energy from food, a hydrogen ion (H+) and two electrons (2e-) attach to NAD+, and we get NADH. When we use the energy and go without food, the reverse reaction occurs. NADH decreases, and NAD+ builds up.

Too much energy in our system drives high NADH levels. Just like in a car engine, we can drown our mitochondria in fuel, and they choke.
When we have lots of fuel in our system, NADH rises, but then if we don’t have enough NAD+, we can’t use it. So we’re drowning in fuel, but we can’t use it!
Bringing this back to measuring ketones… if we have a higher NAD+:NADH ratio we will see higher breath acetone, lower blood glucose and lower levels of BHB (which is a good thing).
Tell me what to do!!!
So ideally, we want to see:
- higher breath acetone,
- lower blood glucose levels, and
- blood ketone values may be greater than 0.2 mmol/L (they’re not really a big deal unless you specifically require high levels of blood ketones to feed your brain in conditions such as epilepsy, Alzheimer’s or Parkinson’s).
How to get higher NAD+ levels and higher acetoacetate
Boosting your NAD+ levels can be achieved by:
- Eating nutrient-dense foods with plenty of B vitamins (which are a precursor to NAD+),
- Not avoiding protein (particularly tryptophan), and
- Supplementing with niacin.

If you find your breath acetone is on the lower end you can try supplementing with Niacin. When I supplement with Niacel or Niacin my BHB levels drop and my breath acetone rises substantially.
Be warned, you can get a flushing reaction so make sure you start slowly. There is no need to take super high levels, particularly if you’re already keto-adapted.
You can supplement to the point that you start to see higher Ketonix readings. Or, if you don’t have a Ketonix, to the point that you get a funky metallic taste in your mouth.
You might want to start with 25 mg or 50 mg of Nicotinic Acid and build up to 100 mg or even 200 mg if you don’t see any flushing or a rise in your breath acetone.
- If you want to start gently, the Carson Lab niacin is the only one I’ve been able to find in 50 mg in Australia via iHerb.
- The 100 mg Nicotinic Acid is actually a lot cheaper (only 5 c per tab).
- Nicotinamide Riboside can be useful for people who can’t as easily convert niacin to NAD+, but it’s more expensive.
However, rather than supplementing, nutrient-dense, minimally processed whole foods are ideal, at least as a starting point before adding supplements. The Nutrient Optimiser has been designed to help you find the most nutritious whole foods to balance your macro and micronutrients.
If you require therapeutic ketosis, the Nutrient Optimiser free report will give you a suggested macro range to help you avoid excessive energy. It will also give you a shortlist of nutrient-dense meals and foods that will help boost your mitochondrial function.

If you’re interested, the Nutrient Optimiser full report will give you a longer list of foods and meals. You also have the option to upload your Cronometer data to fine-tune your diet to achieve your goals progressively.
How to get lower blood glucose levels
The key to achieving lower blood glucose levels is:
- Avoid processed, nutrient-poor high carbohydrate foods (e.g. processed grains, cereals and sugars),
- Eat less often / fast / avoid snacking,
- Eat less overall.
If you do these things, you will see your blood glucose levels decrease, your NAD+ levels increase, and your breath acetone levels increase.
You can stabilise your blood glucose levels by eating a diet with more fat and less carbohydrates, but to really shift your NAD+:NADH ratio in a favourable direction, you may need to reduce your body fat to more optimal levels.
The article How to use your blood glucose meter as a fuel gauge can guide you through how to use a glucose meter to re-calibrate your eating routine based on when you really need to eat.
The Nutrient Optimiser will suggest macronutrient ranges and nutritious foods that will help you stabilise your blood sugars.
How Can I Calculate My Nutrient Intake?
If you’re interested in checking if you’re getting just enough dietary phosphorus, you can check your nutrient profile using our Free 7-Day Nutrient Clarity Challenge.
After a week of tracking your current diet in Cronometer, Nutrient Optimiser will give you a prioritised list of foods and NutriBooster recipes that will help you plug your current nutritional gaps.
Level Up Your Nutrient Density
To help you level up your nutrient density, we’ve prepared a Nutritional Optimisation Starter Pack to ensure you are getting plenty of all the essential nutrients from the food you eat every day.
The free starter pack includes:
- Maximum Nutrient Density Food List
- Sample Maximum Nutrient Density Recipe Book
- Sample Maximum Nutrient Density Meal Plan.
To get started today, all you have to do is join our new Optimising Nutrition Group here.
Once you join, you will find the Nutritional Optimisation starter pack in the discovery section here.
More
Thanks
Special thanks to:
- Robert Miller for sharing his unique insights into biochemistry.
- Michel Lundell from Ketonix for supplying all the data!
- Weikko Jaross and Alessandro Ferretti for help with the initial database analysis.
- Craig Emmerich. Mike Julian, Ben McDonald, Robin Reyes, Alex Leaf and Helen Kendall for their review and editing.
References
[1] https://optimisingnutrition.com/2016/08/08/how-to-make-endogenous-ketones-at-home/
[2] https://optimisingnutrition.com/2017/04/30/are-ketones-insulinogenic-and-does-it-matter/
[3] https://optimisingnutrition.com/2015/07/20/the-glucose-ketone-relationship/
[4] https://optimisingnutrition.com/2018/02/03/is-too-much-protein-on-keto-a-thing/
[5] https://link.springer.com/article/10.1007%2Fs13300-018-0373-9
[6] https://www.ncbi.nlm.nih.gov/pubmed/25686106?dopt=Abstract
[7] https://www.ncbi.nlm.nih.gov/pubmed/23223453?dopt=Abstract
[8] https://optimisingnutrition.com/2016/08/08/how-to-make-endogenous-ketones-at-home/
[9] https://www.ncbi.nlm.nih.gov/pmc/articles/PMC5125693/
[10] https://www.dropbox.com/s/zej4razn4dn993y/protein%20leverage%20hypothesis%20-%20simpson2005.pdf?dl=0
[11] https://www.ncbi.nlm.nih.gov/pmc/articles/PMC5326984/
[12] https://www.amazon.com/Keto-Complete-Ketogenic-including-Simplified/dp/1628602821
[13] http://doi.org/10.1007/s13300-018-0373-9
[14] http://doi.org/10.1007/s13300-018-0373-9
[15] https://www.amazon.com.au/Art-Science-Low-Carbohydrate-Living/dp/0983490708
[16] http://circoutcomes.ahajournals.org/content/3/6/661
[17] This chart is interesting because it shows that very low blood glucose levels can be association with issues such as autoimmune issues or alcoholism which can cause blood sugars to go very low while the body burns through the alcohol.
[18] https://blog.virtahealth.com/how-much-protein-on-keto/
[19] https://optimisingnutrition.com/2017/10/21/redesigning-nutrition-from-first-principles/
[20] https://optimisingnutrition.com/2016/11/19/the-alkaline-diet-vs-acidic-ketones/
[21] https://nutritionandmetabolism.biomedcentral.com/articles/10.1186/s12986-015-0009-2
[22] https://www.bc.edu/bc-web/schools/mcas/departments/biology/people/faculty-directory/thomas-seyfried.html
[23] https://www.ncbi.nlm.nih.gov/pmc/articles/PMC2852209/
[24] http://www.lifeextension.com/Magazine/2018/2/Anti-Aging-Effects-Of-NAD/Page-01
[25] https://www.sciencedaily.com/releases/2017/03/170323141340.htm
[26] http://www.iflscience.com/health-and-medicine/preliminary-results-early-human-trials-anti-aging-formulas-reveal-no-adverse/
[27] https://bengreenfieldfitness.com/podcast/anti-aging-podcasts/what-is-nad/
[28] http://longevityfacts.com/nmn-nad-nicotinamide-mononucleotide-david-sinclair-interview-anti-aging-drug-trials-nicotinamide-adenine-dinucleotide-sirtuins/
[29] https://www.nadtreatmentcenter.com/6-major-benefits-of-nad-iv-therapy
[30] https://www.vice.com/en_us/article/bn3vmq/nad-plus-brain-reboot-infusion-injection
[31] https://bengreenfieldfitness.com/podcast/anti-aging-podcasts/what-is-nad/
[32] https://openi.nlm.nih.gov/detailedresult.php?img=PMC4588049_cells-04-00520-g001&query=&req=4&npos=-1
I think we’re saying the same thing. Maybe the drum of nail polish is a bad analogy. I think Michel’s point is that AcAc is the ketones being used rather than BHB which is more of a storage form.
You can get a nasty flush so make sure you start slowly.
To avoid niacin “flushing”, take an adult aspirin about 20 mins. before your niacin. The flushing is caused by your blood vessels constricting during niacin dosing, and the aspirin beforehand acts as a vasodiolator, preventing the vasoconstriction leading to flushing. I’ve been doing this for YEARS as a method of bringing my LDL down before cholesterol lab tests, thus gaming the CMP. I’m sick and tired of hearing about my LDL levels from the doc, so I do this stunt for about a week before my visit, and it shuts her up. Other than the levels of LDL, I’m perfectly fine (thanks to keto)–mine isn’t super high or anything, but just higher than she’d like to see (a little outside of range).
Are you using the “fasting” glucose, e.g.- typically overnight. and then BHB after breakfast!! When to measure these?
I just measure them on waking. They should be at the same time.
The ratio is from the measurements taken at the same time.
Excellent, well written, informative. Good stuff, thanks for sharing your knowledge!
Cheers James!
Hi Marty, Great post. Doing some research on niacin seems to increase blood glucose levels and insulin resistance. Any thoughts?
Comment from my friend Robert Miller who is a lot more immersed in the detail: “Depends on dosage. Also a lot of contradictory daya even at higher dosage. Due to NA stalling lipolysis, high doses means that you need GNG to supply fuel. You don’t you only start to see potentially issues at dosages over 1.5g per day, we don’t go anywhere near that so nothing to determine.”
Good to know. Thanks!