

Dive into the enigmatic world of ultra-processed foods and uncover the science behind the ‘hedonic factor’ – a unique combination of fat and carbs that ignites our cravings and keeps us coming back for more.
In a society flooded with highly palatable yet nutritionally void foods, understanding the hedonic factor is a step towards mastering your appetite and making better food choices.
This article deciphers the science of hedonic hunger, unveils the tactics used by food manufacturers to hit your ‘bliss point’, and provides actionable insights on how to prioritize nutrient-dense foods to optimize satiety.
Embark on this enlightening journey and arm yourself with the knowledge to navigate the modern food landscape.
- Executive Summary
- Background
- Carbs vs Fat
- Digging Deeper into Carbs and Fat
- The Dangers of Food Combining
- Where’s the Protein?
- Fibre
- Other Nutrients
- Focusing on the Good vs. Bad
- Protein %
- Protein and Fibre
- Add Sugar, Starch, Monounsaturated Fat
- With Micronutrients
- Add Cholesterol
- Does the Hedonic Factor Make a Difference to Satiety Calculations?
- Pros and Cons of the Hedonic Factor
- Ultra-Processed Foods Like Oils Are Easier to Assimilate
- We’re Eating Less Sugar but More Seed Oils
- Minimally Processed Foods are Less Efficient
- How to Avoid High-Hedonic Factor Foods
Executive Summary
- Ultra-processed foods combine fat and carbs to drive a supra-additive dopamine response to make us want more of these foods. This is often known as a hedonic factor or bliss point.
- Food manufacturers use a combination of ultra-cheap industrial seed oils, added sugar and refined grains, colours, artificial sweeteners, flavours and fortification to make the ingredients palatable.
- Ultra-processed foods require minimal effort for your body to digest and store as body fat.
- To fine-tune our satiety index, we can quantitatively model this hedonic factor due to the combination of sugar, starch and monounsaturated fat.
- This article examines how we can quantitatively model the hedonic factor when combining these ingredients leads us to eat more.
- In the end, we’ll show you foods you can prioritise and avoid to optimise your satiety and nutrient density which will help you manage your appetite.
Background
Your appetite is fascinating, complex, and multifactorial.
Whether you realise it or not—and it may even seem like a nuisance—your appetite is optimised to keep you alive by motivating you to seek out the energy and nutrients you need at any given time.
If you’ve been following our research and analysis, you’ll be aware that protein has the most significant impact on satiety. But while protein should be the foundation of your diet, it’s not the only factor that keeps you feeling full or prevents overeating!
When it comes to processed foods, most of us feel like our stomach is a bottomless garbage can when that’s all we eat.
So, what is it about these foods that makes us so hungry and unsatisfied?
There appears to be something ‘magical’ that happens when processed foods combine fat and carbs together. While some call it ‘hedonic hunger’, others refer to it as the ‘bliss point’ that food manufacturers strive for. Essentially, it’s the pleasure you feel from eating something that brings you back for seconds… and then some.
The term ‘hedonic hunger’ refers to one’s preoccupation with and desire to consume foods for the purposes of pleasure and in the absence of physical hunger. Lowe, et al (20018)
Take a moment to imagine how you’d feel eating:
- a plain potato, which is predominantly starchy carbohydrates;
- a tablespoon of table sugar, which is a mix of glucose and fructose;
- plain butter, which is mainly saturated fat; and
- a doughnut, cookie, or brownie (pick your favourite), which is a conglomerate of fat, starch, and sugar.

You’re more likely to eat more of the doughnuts, cookies, or brownies, and you’re probably not as excited about the other foods, at least by themselves. Right?
In nature, fat-and-carb combo foods like nuts and dairy are prized because they help us build fat to survive the coming winter. These foods fill our fat and carb fuel tanks, which provide us with a lot of energy we can easily store.
For more on your energy tanks, check out Oxidative Priority: The Key to Unlocking Your Body Fat Stores.
Before ultra-processed foods, these low-protein, fat-and-carb combo foods were rare and only available in autumn. But even then, foods like milk, nuts and fruit are tame compared to the constant onslaught of hyper-palatable ultra-processed foods in our modern food environment.
Whether by design, trial and error or just good fortune, food scientists have discovered that this magical combination has you wanting more and more! Brain imaging studies have shown that foods that enable us to fill our glucose simultaneously and fat fuel tanks elicit a supra-additive dopamine response.
Ultra-processed foods combine cheap ingredients like refined flour, industrial seed oils, and processed sugar in the perfect ratios to make us eat and buy more of these foods. They also have minimal protein and fibre, making it difficult to stop eating and even harder to feel full after consuming them!
For the past 50 years, food manufacturers have exploited this phenomenon with diabolical precision at the expense of our metabolic health. It’s not a conspiracy; it’s just good business to sell you cheap, ultra-profitable, hyper-palatable foods you can’t stop eating (or buying).

While these modern food concoctions might be great if you’re a starving caveman, they’re not so great in our modern world, where food security is no longer a problem. Nowadays, we have modern technologies like synthetic fertilisers and mono-crop agriculture that make food abundant ALL the time.
For more details on what lies behind our energy abundance, check out, What Lies Beyond the Nutritional Apocalypse?
In the article, Carbs OR Fat vs Carbs AND Fat, we examined why these hyper-palatable ‘junk’ foods are so special to us and how they contribute to overeating and obesity.
Building on this prior analysis, we’ll look at how to identify these hedonic foods quantitatively. From there, we can use our observations to design a comprehensive satiety index algorithm that can help you identify low-satiety foods wherever they are hiding.
As you will see, avoiding ultra-processed foods that combine industrial seed oils, refined flours and added sugars is wise. However, if you prioritise the protein and nutrients your body needs, you won’t need to worry too much about avoiding these highly hedonic foods optimised to hit your bliss point.
Regardless of whether you start by avoiding the ‘bad things’ in food or prioritising the nutrients your body needs, you will arrive at the same place.
Carbs vs Fat
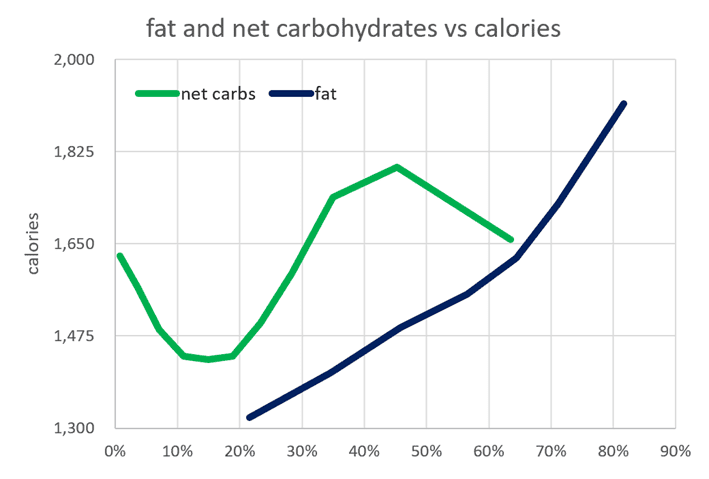
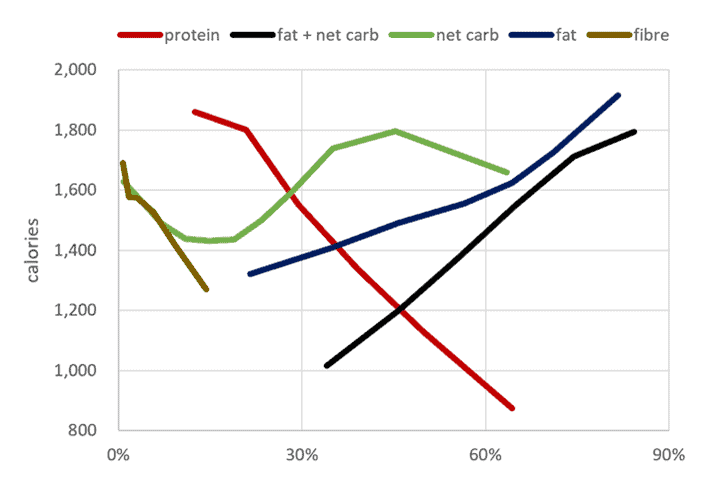
As the chart below from our satiety analysis shows, our satiety response to carbohydrates is far from a simple linear relationship.

Our appetite seems to go into overdrive when around 45% of our energy comes from non-fibre carbs, and most of the rest is fat. As you can imagine, these fat+carb combo foods also provide little in the way of satiety-driving protein.
If you’re like most of the modern world and rely on processed foods, you’re likely eating around 45% non-fibre carbs. Our analysis shows that reducing your carb intake from 45% to 10-20% of calories will increase satiety and allow you to reduce your energy intake by 23%.
But carbs aren’t the only problem! Someone on a standard Western diet tends to consume a similar fat percentage. The following chart shows how decreasing fat intake also aligns with reducing energy consumption.
These observations are reinforced by our quantitative analysis. In the following table, we can see from the results of a multivariate analysis of our data from people using Nutrient Optimiser that:
- reducing fat from 62% to 31% aligns with a 28% reduction in calories; while
- reducing carbs from 30% to 6% aligns with a 22% reduction in calories.
| 15th | 85th | Calories | % | |
| Fat (%) | 31% | 62% | 496 | 28% |
| Net Carb (%) | 6% | 30% | 397 | 22% |
While it seems we can shave slightly more energy out of our daily intake by reducing fat over carbs—which makes sense because it is so energy-dense—they’re pretty similar overall.
It’s also worth noting here that lower carb seems to be better than zero carb when it comes to satiety. We see somewhat of a rebound effect when our carbs drop too low. It seems we crave some energy from carbs and will eat more if we push carbohydrates too low.
Digging Deeper into Carbs and Fat
Rather than simply thinking about carbs and fat, let’s dig a little deeper and see how the following components of carbs and fat influence appetite:
- starch,
- sugar,
- saturated fat, and
- monounsaturated fat.
Modern processed foods are unique mixtures of high-energy sources that wouldn’t (and couldn’t) have occurred a hundred or a thousand years ago.
When we run our multivariate analysis on the various energy sources, we see that each independently contributes to a higher calorie intake.
| 15th | 85th | Calories | % | |
| Sugar (g/2000 cal) | 11 | 71 | 119 | 6.7% |
| Saturated fat (g/2000 cal) | 20 | 61 | 279 | 16% |
| Starch (g/2000 cal) | 0.8 | 48 | 201 | 11% |
| Monosaturated fat (g/2000 cal) | 16 | 53 | 225 | 13% |
| Total | 46.5% |
Whole foods also provide energy from sugar (e.g. fruits and vegetables), saturated fat (meat and seafood), starch (grains) and monounsaturated fat (nuts, seeds, meat and seafood). These foods tend to be available during different seasons. There is no whole-natural food that combines all of these energy sources at the same time!
But today, ultra-processed foods combine all of these energy sources together. This is really the ‘secret sauce’ of ultra-palatable processed foods.
The Dangers of Food Combining
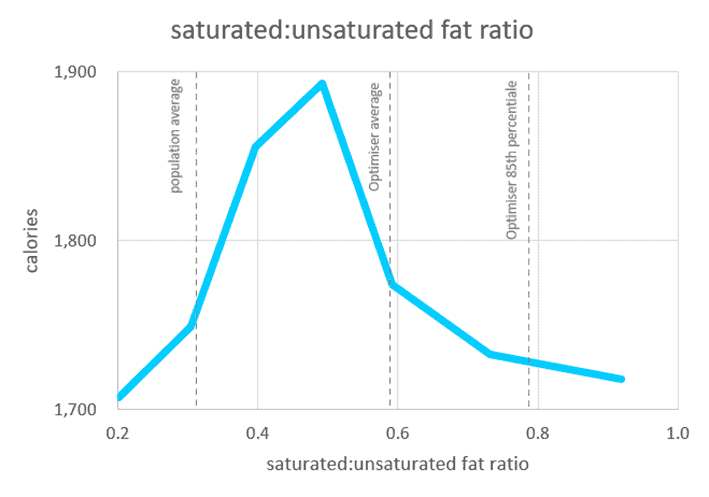
Rarely in nature do we find saturated and unsaturated fats together in similar quantities; animal foods come with energy as saturated fat, and subsidised grains like soy and corn are heated and squeezed to give us mono and polyunsaturated seed oils (and yes, that is a picture of the process below).

We know from our previous analysis that blending saturated and unsaturated fat together aligns with a higher calorie intake than one or the other. Something unique appears to happen when we mix food components that aren’t typically found together.
Where’s the Protein?
While we’ve discussed the components in ‘junk’ food that make us overeat, we haven’t mentioned much about what it’s missing. Perhaps the most critical nutrient that hyper-palatable processed foods lack is protein, which many studies and analyses—including our own—have shown to be the most satiating component of food. We consume less energy when we consume foods with a higher protein %.
Our analysis shows that diets consisting of ~43% fat and ~45% carbs (88% of calories total) tend to push us to overeat the most energy. Although the mixture of these macronutrients together is quite ‘additive’, the sum of the energy from fat and carb leaves little room for protein.
Thus, our analysis shows that a 12% protein intake aligns with the most significant calorie intake, which just so happens to be the population average. Most processed foods contain somewhere around this quantity, or less.
Fibre
Like protein, our fibre intake has an inverse relationship with the calories consumed. In other words, we consume less energy when we consume more fibre (and protein).
Fibre slows digestion and helps keep blood sugars stable. Together, protein and fibre help you feel full in the short and long term. Nutrient-dense foods with more fibre also tend to have a lower energy density.
In our Nutrient Cluster Analysis article, we saw how various vitamins and minerals tend to accompany foods high in natural fibre. Some of these nutrients appear to have their own critical roles in satiety.
While fibre is not an essential nutrient, it is a key indicator of whether or not a food is processed; whole, unprocessed, natural foods tend to contain more fibre, whereas it’s often removed from processed foods. Because most junk foods are high in starch and fat and low in protein and fibre, they’re the perfect concoctions to get you to eat without control.
We consume fewer calories when our ratio of fibre to carbs is higher. In other words, we eat less when we consume more fibrous carbs vs refined grains and added sugar.

For more on fibre, check out Dietary Fibre: How Much Do You Need?
Other Nutrients
In our article, The Cheat Codes for Optimal Nutrition and Health, we talked about the findings from our multivariate analysis and which nutrients contributed to satiety the most. Beyond protein, a number of other nutrients tend to factor into the satiety equation, including:
- Potassium,
- Fibre,
- Sodium,
- Vitamin B2,
- Vitamin B5,
- Selenium, and
- Calcium.
While we’ve already talked about processed foods, protein, and fibre—or their lack of these nutrients—it’s critical to mention that most processed foods lack these nutrients.
Many processed foods contain white flour, often fortified with nutrients like iron and B vitamins. However, fortification often provides only a limited number of isolated nutrients compared to the full spectrum of whole foods. Minerals are rarely used in fortification because they are so bulky.
Additionally, our analysis has shown that synthetic nutrients—whether from fortification or supplements—do not provide the same satiety benefit as whole foods and could lead to a decreased appetite for more satiating whole foods that naturally contain the nutrients you require.
Focusing on the Good vs. Bad
You require all these components from your food and will eat more until you get them. However, all of them are missing from processed foods.
As a general rule, prioritising what you need from food is a much better strategy than focussing on what you should avoid. When you give your body what it needs, all the other components look after themselves.
Nonetheless, understanding the composition of the most hedonic foods engineered for their optimal bliss point might help us make better decisions. Additionally, knowing the effects of various energy combinations on our appetite—like carbs and fat—is also helpful.
Next, let’s look at how we can quantify the good, the bad, and the ugly into a more effective system so we can avoid these Frankenfoods and crush our cravings.
Protein %
Starting with a solid foundation of dietary protein is critical if we’re looking to optimise our food choices.
When it comes to satiety, or feelings of fullness on fewer calories, protein is the most critical factor. If we aren’t eating adequate protein, we’re more likely to continue eating.
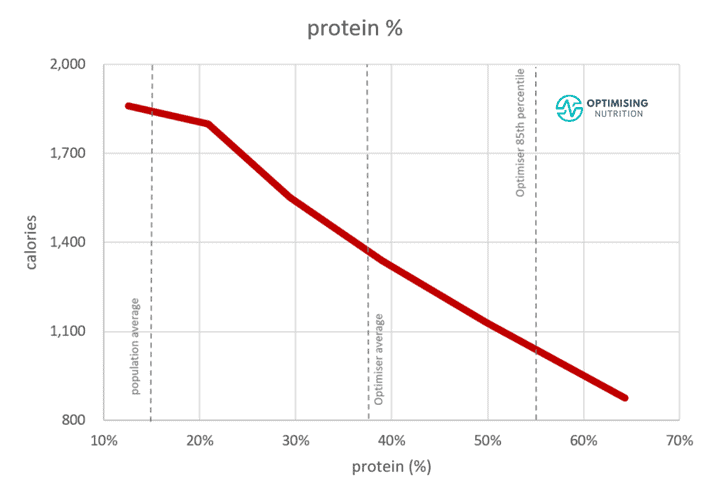
Our analysis has shown that it isn’t the absolute quantity of protein (i.e., protein in grams) that has the most profound influence on satiety; instead, it’s the percentage of total calories from protein or protein %. The simple table below shows that moving from 19 to 44% protein aligns with a 45% reduction in calories (p < 0.0000005).
| 15th | 85th | Calories | % | |
| Protein (%) | 19% | 44% | -533 | -35% |
Increasing your protein % does not simply mean someone must substantially increase the amount of protein they’re eating. Instead, they must dial back their intake of fat and carbs while prioritising protein to increase the total percentage of calories (i.e., protein %) that comes from protein.
While prioritising a higher protein % is critical, focusing on all the essential nutrients (i.e., nutrient density) encourages you to create a more nutritious diet rather than high-protein % foods (i.e., chicken breast, protein powder, and egg whites). These foods may help you nail your protein target, but they can lack other vitamins, minerals, amino acids, and essential fatty acids found in other whole foods.
Protein and Fibre
As mentioned earlier, fibre provides additional predictive power for whether a food is processed without detracting from protein. Foods naturally containing more fibre are less processed and have lower energy density.
| 15th | 85th | calories | % | |
| protein (%) | 19% | 44% | -524 | -35% |
| fibre (g/2000 cal) | 10.8 | 44.2 | -124 | -8% |
| total | -43% |
If someone consumes carbs, it’s ideal if they’re minimally processed and fibrous; non-starchy vegetables are always preferred over refined sugar and grains!
Add Sugar, Starch, Monounsaturated Fat
Now that we’ve touched on protein and fibre, let’s consider the nutrients that provide energy and align with eating more. Both starch and monounsaturated are substantial factors. Sugar plays a more minor and less statistically significant role.
| 15th | 85th | Calories | % | |
| Protein (%) | 16% | 39% | -473 | -31% |
| Fibre (%) | 2% | 9% | -184 | -12% |
| Sugar (g/2000 cal) | 11 | 71 | 13 | 0.9% |
| Starch (g/2000 cal) | 1 | 48 | 84 | 5.6% |
| Monosaturated fat (g/2000 cal) | 16 | 53 | 65 | 4.3% |
Note: The first pass analysis showed that polyunsaturated (PUFA) and saturated fats weren’t correlated with a higher calorie intake after protein and fibre were considered. Hence, they were eliminated from the analysis.
With Micronutrients
When we also consider micronutrients, we see that sodium, potassium, B2, and selenium have the most statistically significant influence on satiety. It’s interesting to note that protein’s satiety impact is redistributed to other essential nutrients. Rather than protein leverage, it appears we have a nutrient leverage effect. Our cravings are satiated when we consume foods that naturally contain the broad spectrum of nutrients our bodies require.
| 15th | 85th | Calories | % | |
| Protein (%) | 16% | 38% | -374 | -21.1% |
| Fibre (g/2000 cal) | 12 | 43 | -128 | -7.2% |
| Sodium (mg/2000 cal) | 1,335 | 4,395 | -78 | -4.4% |
| Potassium (mg/2000 cal) | 1,794 | 5,408 | -71 | -4.0% |
| Vitamin B2 (mg/2000 cal) | 1.3 | 4.7 | -60 | -3.4% |
| Selenium (mcg/2000 cal) | 65 | 254 | -37 | -2.1% |
| Vitamin B5 (mg/2000 cal) | 3.8 | 14.0 | -19 | -1.1% |
| Sugar (g/2000 cal) | 12 | 73 | 13 | 0.8% |
| Monosaturated fat (g/2000 cal) | 17 | 53 | 64 | 3.6% |
| starch (g/2000 cal) | 0.9 | 51 | 91 | 5.1% |
The great thing about focusing on eating more micronutrients per calorie is that it quickly eliminates any ultra-processed foods without relying on subjective food classification systems like NOVA, which have limitations.
This analysis suggests that we may crave non-protein nutrients like sodium, potassium, selenium, calcium, and several vitamins. Foods that naturally contain these nutrients tend to be minimally processed, low-energy-density whole foods that are hard to overeat.
The takeaway is that nutrient density works as a quantifiable proxy to eliminate ultra-processed foods while ensuring that you get the nutrients your body requires. It also serves as a surrogate for energy density. In contrast, foods containing monounsaturated fat and starch trigger your supra-additive dopamine response (hedonic factor).
Add Cholesterol
In our final scenario, we’ve also considered cholesterol. Interestingly, our analysis has shown foods that contain more cholesterol tend to provide greater satiety. While protein % is still the dominant factor, the contribution of protein falls to only 18% once we consider cholesterol and all the other factors in the satiety equation.
| 15th | 85th | Calories | % | |
| Protein (%) | 16% | 37% | -316 | -17.8% |
| Fibre (g/2000 cal) | 11 | 42 | -204 | -11.5% |
| Cholesterol (mg/2000 cal) | 235 | 1,087 | -181 | -10.2% |
| Potassium (mg/2000 cal) | 1,788 | 5,290 | -95 | -5.4% |
| Sodium (mg/2000 cal) | 1,332 | 4,359 | -77 | -4.3% |
| Vitamin B2 (mg/2000 cal) | 1.3 | 4.7 | -35 | -2.0% |
| Selenium (mcg/2000 cal) | 65 | 252 | -23 | -1.3% |
| Sugar (g/2000 cal) | 12 | 71 | 5 | 0.3% |
| Starch (g/2000 cal) | 0.9 | 50 | 73 | 4.1% |
| Monosaturated Fat (g/2000 cal) | 17 | 53 | 86 | 4.9% |
Although this is an exciting observation, most people won’t likely adopt cholesterol as a priority nutrient. But while cholesterol is not considered an essential nutrient, the findings of this analysis highlight that avoiding foods that naturally contain cholesterol does not provide any additional benefit.
For more on cholesterol, visit Cholesterol: When to Worry and What to Do About It.
Does the Hedonic Factor Make a Difference to Satiety Calculations?
Thus far, we’ve looked at several scenarios to understand the contribution of variations factors on how much we eat. The multivariate regression analysis gives us regression coefficients that allow us to estimate how much of a particular food we would consume if that’s all that was available.
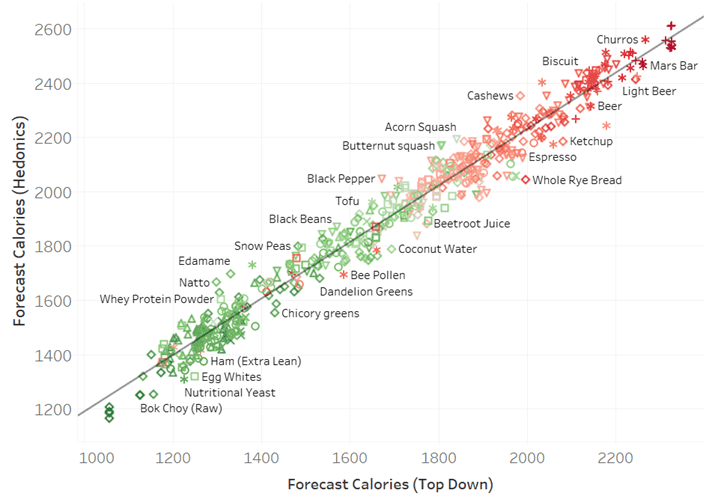
But what does it look like in terms of whole food? The chart below shows the forecast calorie intake of six hundred popular foods. The estimate of calorie intake on the x-axis considers only the key fats that positively impact satiety (i.e. protein %, fibre, potassium, calcium, and sodium). The vertical axis also considers the negative impact of sugar, monounsaturated fat and starch.
Pros and Cons of the Hedonic Factor
Overall, there is a close alignment between the two methods of estimating calorie intake.
The more complex ‘hedonics’ approach considers more factors and is less reliant on protein. There is also something attractive about avoiding the ‘bad things’ in food that tend to drive us to eat more.
But, on the flip side, a simple and robust system is often best, especially if more data is available for parameters like protein, fibre, sodium, potassium and calcium, while not all foods have data for sugar, monounsaturated fat and starch.
When we zoom into the top corner and filter for more binge-worthy foods, we see that foods like cashew butter, brownies and cheesecake, are forecast to be overeaten more than only considering protein and the dominant essential nutrients.
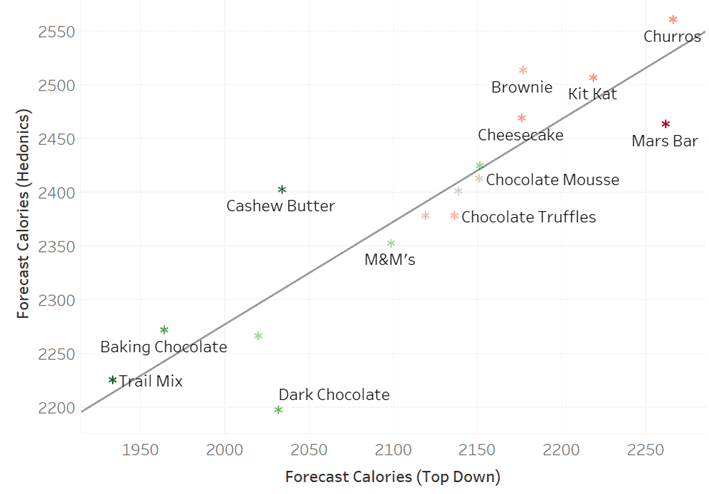
However, the overall impact is small compared to protein %, which tends to dominate the analysis. So, while we can model the hedonic factor in food, it doesn’t make a big difference either way.
Ultra-Processed Foods Like Oils Are Easier to Assimilate
We created the chart below using food production data from the USDA Economic Research Board and obesity data from the CDC. Here, we can see a pretty clear correlation between the energy available in the food system from 1960 to 2000 and climbing obesity rates. So, while we may have solved the food security issue, we created the obesity epidemic!
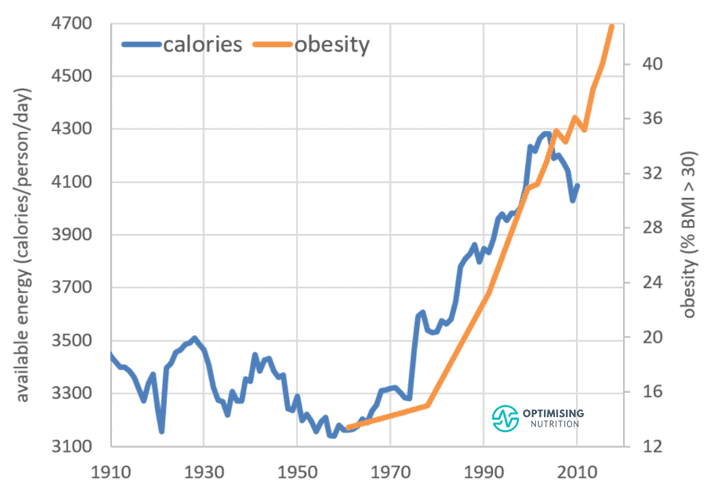
However, interesting to note that energy availability and intake have been relatively stable over the past 20 years. Still, the chart below from Dariush Mazafarrian’s paper, Perspective: Obesity—an unexplained epidemic, shows how obesity rates have continued to increase.
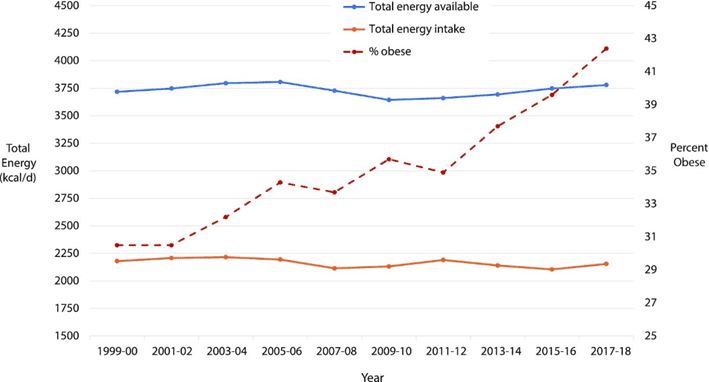
This is indeed puzzling, and many have noted there seems to be a disconnect between calorie intake and weight gain.
Do calories no longer matter?
But I think it’s critical here to remember that burning food and the way we absorb and metabolise it in our bodies are different. When our food is less refined and contains more protein and fibre, there are more losses in digestion and converting our food to ATP.
One possible explanation for the uncoupling of calories and obesity rates is that increased food processing and more refined ingredients simply enable us to extract more energy from our food than ever before.
We’re Eating Less Sugar but More Seed Oils
To provide some context, the chart below shows the sugar intake per person per day over the past 50 years. Here, we see an abrupt change in direction around 1999 when artificial sweeteners like Splenda were approved.

When we look at the sources of sugar since 1970, we see that most of the change from high-fructose corn syrup (HFCS), which was initially a cheap waste product that food manufacturers turned into a sweetener. However, it became unpopular in the late 1990s and 2000s once people started linking it to metabolic syndrome.
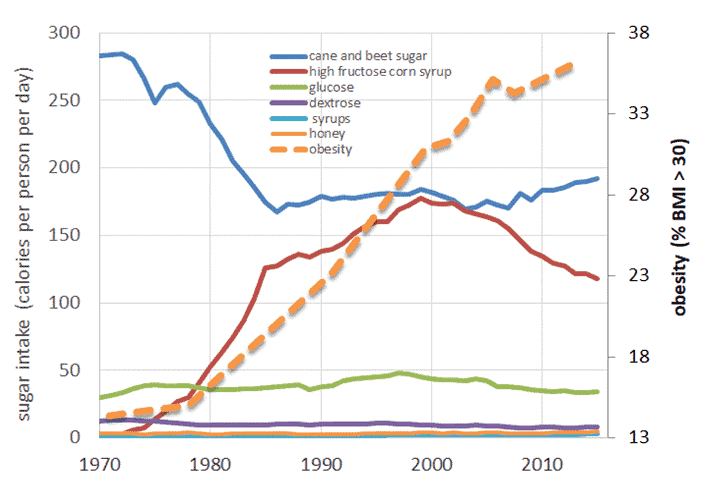
However, HFCS was quickly replaced with artificial sweeteners. Once ultra-processed foods began using them instead of HFCS, cost-conscious food manufacturers also began using cheap-to-produce yet highly profitable ‘heart-healthy’ industrial seed oils, and the obesity epidemic continued to power on. Notice the abrupt jump in added fats and oils (represented by the purple line in the chart below).

As the following chart shows, we’ve seen an exponential increase in vegetable oil production over the past 50 years. Unfortunately, while HFCS has few positive qualities, industrial seed oils are potentially worse as they require even less effort for your body to process and convert to body fat.
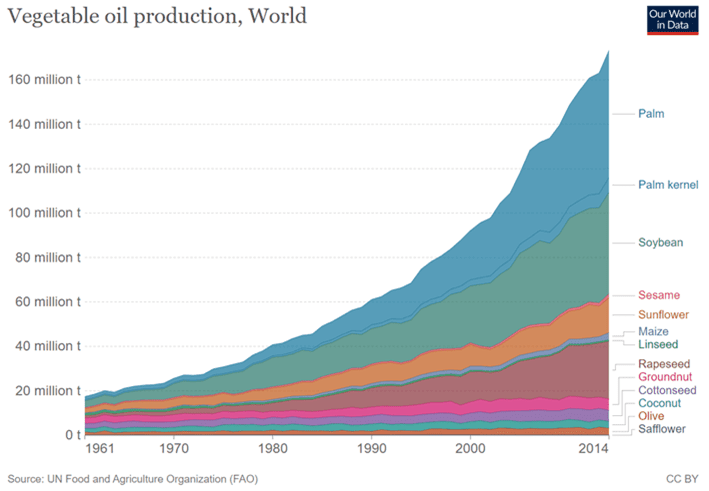
While some people argue that these seed oils are ‘plastic’ fats that are one of the leading causes of metabolic syndrome, the research supporting these claims is sparse. However, we can agree that the large amount of energy they provide us with little—if any—nutrients is not optimal.
The simpler explanation of why industrial seed oils are less than optimal is that they provide cheap energy in ultra-processed foods that we love to overeat.
For more, see:
- Monounsaturated Fat: Is It So ‘Good; After All?
- Carbs Make You Fat and 9 Other Nutrition Myths That Need To Die
- How the Biggest Trends in Nutrition Influence How We Currently Eat
Minimally Processed Foods are Less Efficient
When we consume nutrient-dense, minimally-processed whole foods full of protein and fibre, some of the energy we get from them is lost through digestion and increased dietary-induced thermogenesis.
We extract much more energy from our food as the level of processing has increased, and more of our food consists of refined sugar, refined grains, and (especially) industrial seed oils. Additionally, less of this energy is ‘wasted’ on digestion and muscle protein synthesis, meaning there is more for us to store.
But this is a problem within our control, and we can reverse it by avoiding these hedonic foods designed for maximum bliss point.
If you focus on foods that provide more of the nutrients you need instead of pure energy from various sources, you’re likely to avoid foods that require sweeteners or fortification. While this may seem like a complicated journey to get started on, we’ve included a few resources to get you going.
How to Avoid High-Hedonic Factor Foods
The best way to avoid feeling “addicted” to highly hedonic foods optimised for maximum bliss points is to prioritise foods and meals that provide the nutrients your body requires.
To help you navigate the world of manufactured franken foods, the chart shows the calculated satiety index (using the hedonics discussed above) vs. nutrient density (per serving). The colour coding is based on nutrient density per calorie.
You can dive into the details of this chart in the interactive Tableau version here or download our simple food lists optimised for various goals here.
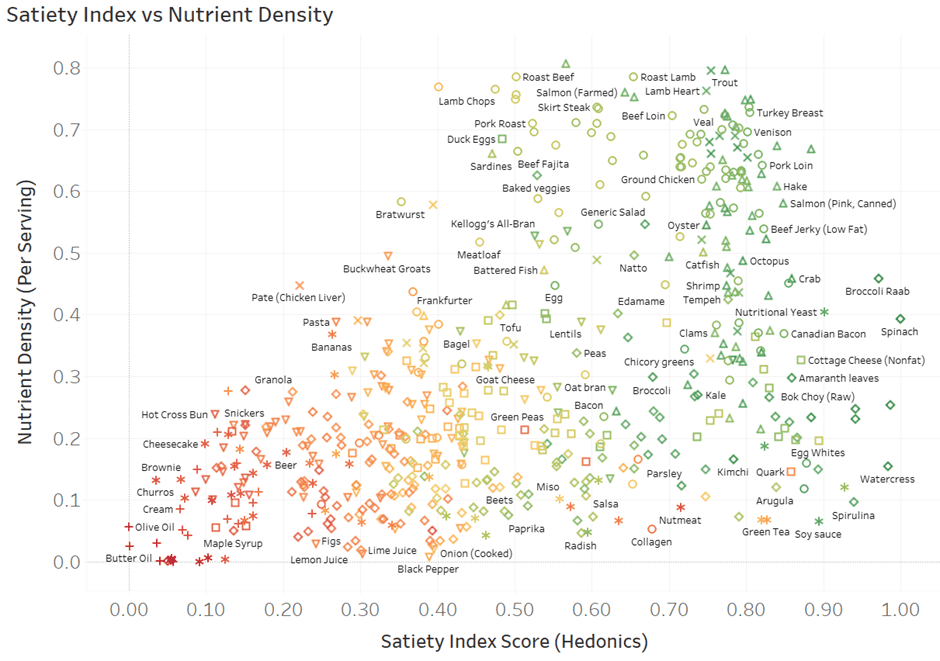
Foods towards the right will help you maximise satiety per calorie. However, foods like spinach and watercress are pretty hard to eat a lot of. So, you may want to start with the foods towards the top that can form the foundation of your diet and then use the foods towards the right to fill in the remaining nutritional gaps in your diet.
Summary
- In addition to protein % and fibre, we can use starch, sugar and monounsaturated fat to model the ‘hedonic response’ to ultra-processed carb-and-fat combo foods.
- Fibre is a useful proxy for whether or not a food is processed.
- Other micronutrients, like potassium, sodium, selenium, B2, and B5, increase the model’s accuracy and help us decipher nutrient-dense whole foods from processed ones.
- We can use the results of the multivariate analysis to create a satiety index score for any food and meal. This enables us to prioritise foods that give our bodies what they need instead of high-hedonic bliss point foods.
- Ultra-processed foods tend to rely on a combination of starch, sugar and monounsaturated fat (from seed oils). We can consider these factors in our satiety index, but it doesn’t make a big difference either way.