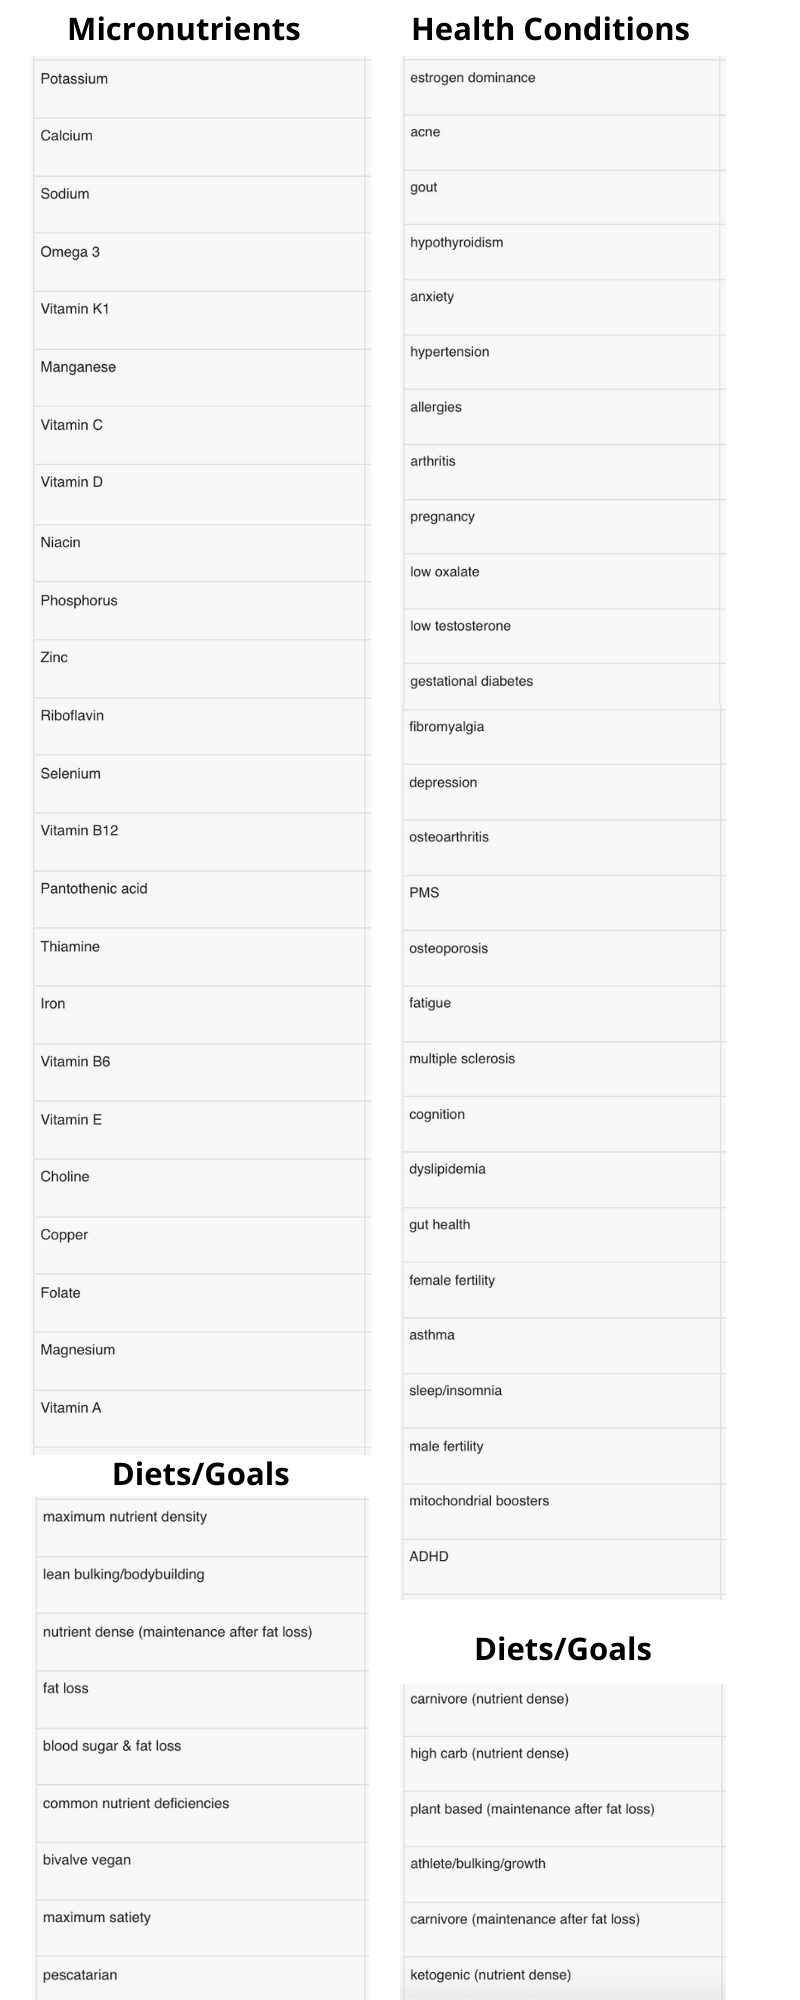
These foods will help you maximise nutrient density and sustain health with adequate energy for weight maintenance.
“A nourishing, balanced diet that provides all the required nutrients in the right proportions is the key to minimising appetite and eliminating hunger at minimal caloric intake.”
Paul Jaminet
The downside of the most nutrient dense foods is that they have such a low energy density that it can be hard to maintain your body weight. The chart below shows that these foods still rank at #4 of the 13 approaches analysed in terms of nutrient density despite containing a little more fat!
These foods still have a fairly low energy density (#4 of 13), but not as much as the more aggressive weight loss approach. The addition of some nuts and dairy brings means it will be easier to maintain body weight and satiety, especially if you are active.
The chart below shows that the nutrients provided by these foods is well above the average of all the foods in the USDA database.
The tables below show the
- nutrient density score,
- percentage of insulinogenic calories,
- insulin load (per 100g),
- energy density (per 100g), and
- the multicriteria analysis score (MCA) that combines all these factors.
vegetables and spices
food | ND | % insulinogenic | insulin load (g/100g) | calories/100g | MCA |
endive | 14 | 23% | 1 | 17 | 2.7 |
coriander | 14 | 30% | 2 | 23 | 2.6 |
chicory greens | 13 | 23% | 2 | 23 | 2.5 |
asparagus | 15 | 50% | 3 | 22 | 2.4 |
brown mushrooms | 17 | 73% | 5 | 22 | 2.3 |
escarole | 11 | 24% | 1 | 19 | 2.2 |
spinach | 14 | 49% | 4 | 23 | 2.2 |
watercress | 16 | 65% | 2 | 11 | 2.2 |
alfalfa | 10 | 19% | 1 | 23 | 2.2 |
basil | 13 | 47% | 3 | 23 | 2.1 |
beet greens | 11 | 35% | 2 | 22 | 2.0 |
portabella mushrooms | 13 | 55% | 5 | 29 | 2.0 |
zucchini | 11 | 40% | 2 | 17 | 2.0 |
arugula | 11 | 45% | 3 | 25 | 1.9 |
chard | 12 | 51% | 3 | 19 | 1.9 |
white mushroom | 14 | 65% | 5 | 22 | 1.9 |
mustard greens | 10 | 36% | 3 | 27 | 1.9 |
parsley | 11 | 48% | 5 | 36 | 1.8 |
lettuce | 11 | 50% | 2 | 15 | 1.8 |
paprika | 8 | 27% | 26 | 282 | 1.8 |
shiitake mushroom | 12 | 58% | 7 | 39 | 1.8 |
Chinese cabbage | 11 | 54% | 2 | 12 | 1.7 |
okra | 11 | 50% | 3 | 22 | 1.7 |
dandelion greens | 11 | 54% | 7 | 45 | 1.7 |
broccoli | 10 | 50% | 5 | 35 | 1.6 |
curry powder | 6 | 13% | 14 | 325 | 1.6 |
summer squash | 9 | 45% | 2 | 19 | 1.6 |
yeast extract spread | 11 | 59% | 27 | 185 | 1.6 |
banana pepper | 8 | 36% | 3 | 27 | 1.6 |
pickles | 8 | 39% | 1 | 12 | 1.5 |
cucumber | 8 | 39% | 1 | 12 | 1.5 |
celery | 9 | 50% | 3 | 18 | 1.5 |
collards | 7 | 37% | 4 | 33 | 1.4 |
chives | 8 | 48% | 4 | 30 | 1.4 |
cauliflower | 8 | 50% | 4 | 25 | 1.4 |
turnip greens | 7 | 44% | 4 | 29 | 1.3 |
sage | 5 | 26% | 26 | 315 | 1.3 |
cloves | 6 | 35% | 35 | 274 | 1.3 |
artichokes | 7 | 49% | 7 | 47 | 1.2 |
thyme | 5 | 34% | 31 | 276 | 1.2 |
eggplant | 5 | 35% | 3 | 25 | 1.2 |
mustard seed | 4 | 27% | 37 | 508 | 1.2 |
seaweed (wakame) | 10 | 79% | 11 | 45 | 1.2 |
jalapeno peppers | 5 | 37% | 3 | 27 | 1.1 |
sauerkraut | 5 | 39% | 2 | 19 | 1.1 |
cabbage | 7 | 55% | 4 | 23 | 1.1 |
marjoram | 4 | 31% | 27 | 271 | 1.1 |
radishes | 5 | 43% | 2 | 16 | 1.1 |
chayote | 5 | 40% | 3 | 24 | 1.1 |
bamboo shoots | 7 | 60% | 5 | 27 | 1.1 |
radicchio | 8 | 67% | 4 | 23 | 1.1 |
red peppers | 5 | 40% | 3 | 31 | 1.1 |
dill | 7 | 59% | 8 | 43 | 1.1 |
edamame | 5 | 41% | 13 | 121 | 1.0 |
seaweed (kelp) | 9 | 77% | 10 | 43 | 1.0 |
poppy seeds | 2 | 17% | 23 | 525 | 1.0 |
caraway seed | 3 | 27% | 28 | 333 | 1.0 |
turnips | 6 | 51% | 3 | 21 | 1.0 |
snap beans | 6 | 58% | 3 | 15 | 0.9 |
seafood
food | ND | % insulinogenic | insulin load (g/100g) | calories/100g | MCA |
fish roe | 11 | 47% | 18 | 143 | 1.9 |
crab | 13 | 71% | 14 | 83 | 1.8 |
salmon | 11 | 52% | 20 | 156 | 1.7 |
caviar | 9 | 33% | 23 | 264 | 1.7 |
oyster | 12 | 59% | 14 | 102 | 1.7 |
trout | 9 | 45% | 18 | 168 | 1.6 |
anchovy | 9 | 44% | 22 | 210 | 1.6 |
lobster | 12 | 71% | 15 | 89 | 1.6 |
halibut | 12 | 66% | 17 | 111 | 1.6 |
crayfish | 11 | 67% | 13 | 82 | 1.5 |
sturgeon | 9 | 49% | 16 | 135 | 1.5 |
mackerel | 4 | 14% | 10 | 305 | 1.4 |
sardine | 7 | 37% | 19 | 208 | 1.4 |
cod | 11 | 71% | 48 | 290 | 1.4 |
flounder | 9 | 57% | 12 | 86 | 1.3 |
pollock | 10 | 69% | 18 | 111 | 1.3 |
rockfish | 9 | 66% | 17 | 109 | 1.2 |
herring | 5 | 36% | 19 | 217 | 1.2 |
perch | 8 | 62% | 14 | 96 | 1.2 |
shrimp | 9 | 69% | 19 | 119 | 1.1 |
haddock | 9 | 71% | 19 | 116 | 1.1 |
cisco | 4 | 29% | 13 | 177 | 1.1 |
whiting | 7 | 66% | 18 | 116 | 1.0 |
octopus | 8 | 71% | 28 | 164 | 0.9 |
tuna | 6 | 52% | 23 | 184 | 0.9 |
animal products
food | ND | % insulinogenic | insulin load (g/100g) | calories/100g | MCA |
lamb kidney | 11 | 52% | 15 | 112 | 1.8 |
lamb liver | 10 | 48% | 20 | 168 | 1.7 |
turkey liver | 10 | 47% | 21 | 189 | 1.7 |
chicken liver | 9 | 50% | 20 | 172 | 1.6 |
beef brains | 6 | 22% | 8 | 151 | 1.5 |
ham (lean only) | 10 | 59% | 17 | 113 | 1.5 |
veal liver | 8 | 55% | 26 | 192 | 1.3 |
beef kidney | 8 | 52% | 20 | 157 | 1.3 |
beef liver | 9 | 59% | 25 | 175 | 1.3 |
chicken breast | 8 | 60% | 22 | 148 | 1.1 |
turkey heart | 6 | 47% | 20 | 174 | 1.1 |
lamb brains | 4 | 27% | 10 | 154 | 1.1 |
turkey ham | 6 | 45% | 14 | 124 | 1.1 |
pork chop | 7 | 57% | 23 | 172 | 1.1 |
pork liver | 7 | 59% | 23 | 165 | 1.1 |
beef heart | 5 | 41% | 16 | 165 | 1.0 |
chicken liver pate | 4 | 34% | 17 | 201 | 1.0 |
ground turkey | 3 | 30% | 19 | 258 | 1.0 |
roast pork | 5 | 41% | 20 | 199 | 1.0 |
turkey drumstick | 6 | 52% | 21 | 158 | 1.0 |
turkey meat | 6 | 52% | 21 | 158 | 1.0 |
turkey (skinless) | 4 | 40% | 16 | 170 | 1.0 |
ground pork | 6 | 54% | 25 | 185 | 0.9 |
pork shoulder | 6 | 56% | 22 | 162 | 0.9 |
pork loin | 4 | 41% | 19 | 193 | 0.9 |
pork ribs | 4 | 39% | 21 | 216 | 0.9 |
roast ham | 4 | 41% | 18 | 178 | 0.9 |
ham | 2 | 29% | 11 | 149 | 0.9 |
leg ham | 5 | 56% | 22 | 165 | 0.8 |
lamb sweetbread | 4 | 43% | 15 | 144 | 0.8 |
lamb heart | 4 | 48% | 19 | 161 | 0.8 |
lean beef | 6 | 61% | 23 | 149 | 0.8 |
pork | 4 | 44% | 22 | 209 | 0.8 |
chicken (leg with skin) | 3 | 42% | 18 | 184 | 0.8 |
dairy and egg
food | ND | % insulinogenic | insulin load (g/100g) | calories/100g | MCA |
egg yolk | 6 | 18% | 12 | 275 | 1.6 |
whole egg | 6 | 30% | 10 | 143 | 1.4 |
whey powder | 10 | 95% | 82 | 339 | 0.8 |
kefir | 6 | 64% | 7 | 41 | 0.7 |
cheddar cheese | -2 | 20% | 20 | 410 | 0.4 |
feta cheese | -2 | 22% | 15 | 264 | 0.4 |
Swiss cheese | -2 | 22% | 22 | 393 | 0.4 |
mozzarella | -1 | 34% | 26 | 304 | 0.4 |
gruyere cheese | -2 | 22% | 23 | 413 | 0.4 |
limburger cheese | -2 | 19% | 15 | 327 | 0.4 |
blue cheese | -2 | 21% | 19 | 353 | 0.4 |
sour cream | -3 | 13% | 6 | 198 | 0.4 |
camembert | -2 | 21% | 16 | 300 | 0.4 |
cream | -4 | 6% | 5 | 340 | 0.3 |
legumes, nuts and seeds
food | ND | % insulinogenic | insulin load (g/100g) | calories/100g | MCA |
sunflower seeds | 4 | 15% | 22 | 546 | 1.3 |
brazil nuts | 1 | 9% | 16 | 659 | 1.0 |
flax seed | 1 | 11% | 16 | 534 | 1.0 |
pumpkin seeds | 1 | 19% | 29 | 559 | 0.9 |
almond butter | -0 | 16% | 26 | 614 | 0.7 |
almonds | -0 | 15% | 25 | 607 | 0.7 |
walnuts | -1 | 13% | 22 | 619 | 0.7 |
sesame seeds | -1 | 10% | 17 | 631 | 0.7 |
post last updated April 2017
Nice to have you back!
Thanks. It’s good to be back.
Why are the ND numbers different in different lists on your site? For example, celery has a ND of 1.27 in this list and 2.63 here: https://optimisingnutrition.com/2016/05/16/building-a-better-nutrient-density-index/
Can you walk through a few examples of how something like paprika can rate well in one category and poorly in another yet still be on the list of preferred foods. How do we know which category is most important and which takes priority with a large discrepancy?