

Many people experience almost magical benefits when they switch to a lower-carb diet, with a reduction in hunger and almost effortless weight loss.
But is the ‘magic’ due to the reduction of carbs, more fats, more protein, or more micronutrients?
This article looks at what really happens when you reduce the processed carbs in your diet. This will empower you to continue to pull the right lever to get the results you want over the long term.
I find this stuff absolutely fascinating! But it’s rarely discussed or studied. I don’t understand why everyone isn’t talking about this (yet).
- What you will learn
- The data
- Carbs vs protein
- Fat vs protein
- Nutrient density and macronutrients
- Nutrient density at macro extremes
- Maximum vs minimum fat
- Maximum vs minimum carbs
- Maximum vs minimum protein
- Maximum vs minimum nutrient density
- Nutritional comparison of dietary extremes
- Protein vs nutrient density
- It’s not more protein, but a higher % protein!
- Fat vs nutrient density
- Carbs vs nutrient density
- Macros and micros together
- Our NutriBooster Recipe books
- How Can I Calculate My Nutrient Intake?
- Level Up Your Nutrient Density
- Learn more
What you will learn
This article dives into the data to demonstrate how this works, but the application is pretty simple (as summarised in the table below).
| Goal | What to do | How to do it |
| Stabilise blood sugars | Reduce carbs a little | Reduce refined carbs until blood sugars after meals are in the healthy range (i.e. rise after meals < 30 mg/dL or 1.6 mmol/L). |
| Fat loss | Increase protein % a little | Dial back energy from dietary fat and/or carbs. Continue until waist:height ratio < 0.5 and waking glucose < 100 mg/dL or 5.6 mmol/L). |
| Maintain weight | Focus on nutrients | Add more nutrient-dense foods and meals. |
| Gain weight or support activity | Decrease protein % a little | Increase energy from fat and/or carbs. |
The data
The data used in this analysis is from the 1800 recipes that we have analysed to incorporate into Nutrient Optimiser and develop our series of NutriBooster recipe books. Each point on these charts represents a recipe (which is how we usually eat).
Carbs vs protein
Meals with a higher percentage of carbs have a lower percentage of protein and vice versa. Protein percentage is strongly correlated with nutrient density and satiety.
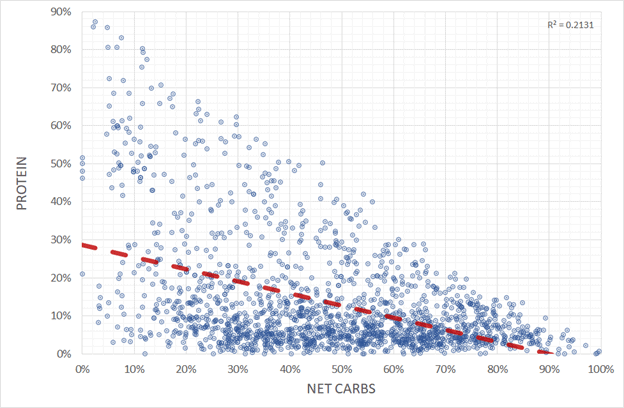
While often attribute the benefits of a lower-carb diet to the fat or the ketones or the added fat, the more straightforward and accurate explanation is that a lower-carb diet tends to increase protein %, leading to greater satiety which allows us to eat less without conscious control and feeling deprived.
If your blood sugars are elevated after meals (i.e. they rise by more than 30 mg/dL or 1.6 mmol/L), it’s wise to cut back your intake of refined carbs to stabilise your blood sugars (i.e. move towards the left of this chart) to achieve normal healthy blood sugar levels.
Large swings in blood sugars can drive appetite and hunger. When our blood sugars drop significantly below what is normal for us, we tend to get hungry and eat more. However, there is no need to swing to the other extreme with a super high-fat diet.
As detailed in Want to lose fat? DON’T aim for stable blood sugars! (Why your CGM could be making you fat), we see no correlation between blood sugar stability and waking glucose or waist-to-height ratio (i.e. the markers you really want to manage).
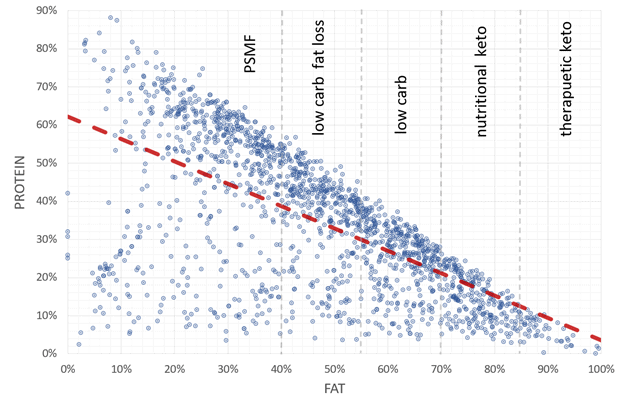
Fat vs protein
This following chart shows the relationship between fat and protein. As we increase the fat in our diet, protein tends to decrease.
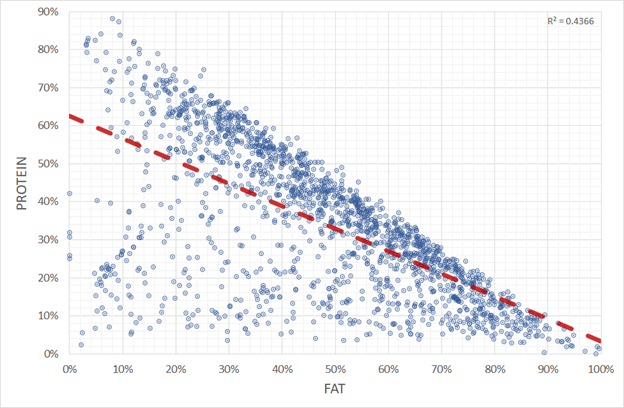
While you may have heard people advising to ‘eat fat to satiety‘, dietary fat is actually the least satiating macronutrient. This analysis was a rude awakening for me after following the keto gurus that recommended that I focus on eating more fat if I wanted to lose body fat. But it seems that as you increase fat in your diet (and decrease protein) foods, you tend to eat more.
When you separate fat from the protein that it typically comes packaged with, it is energy-dense and nutrient-poor and does not promote greater satiety. Many people feel that dietary fat is highly satiating. However, that could just be because you just consume a LOT of calories. In the absence of accurately tracking how much energy you are consuming, subjective satiety (i.e. how full a food makes you ‘feel’) is pretty much useless.
There is a lot of controversy in the low-carb and keto scene around finding the right balance between dietary fat and protein and body fat. In the chart below, I have shown notional divisions between diets:
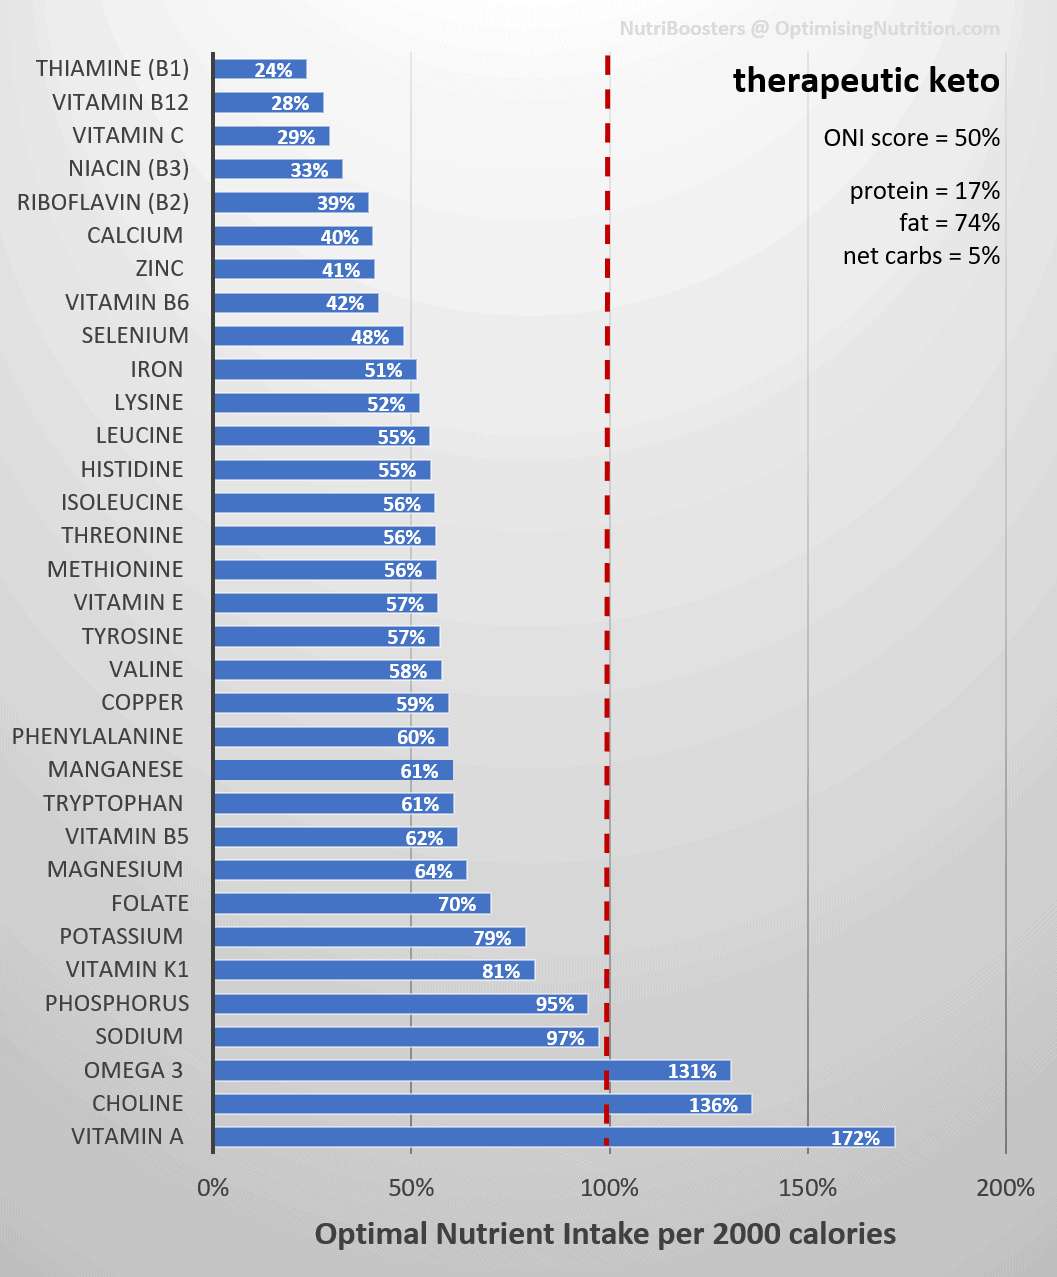
- therapeutic keto (for the management of epilepsy, Parkinson, Alzheimer’s, dementia, etc.),
- nutritional keto (for the active, lean person who enjoys a low-carb diet with some extra fat),
- low carb (for people who are at their goal weight but not as active),
- low carb and fat loss (to allow fat to come from your body, rather than your diet), and
- Protein Sparing Modified Fast (very high protein for maximum satiety and rapid fat loss over the short term).
If you want to use more fat from your body, you need to lower the fat in your diet. You will also get more nutrients per calorie, so you will still be able to thrive on fewer calories. Unless you require therapeutic levels of ketones, it’s about lower fat, not low fat or avoiding fat. The nuance here is crucial and often missed.
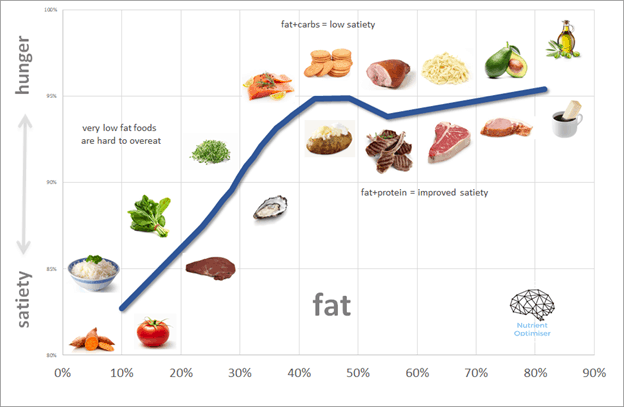
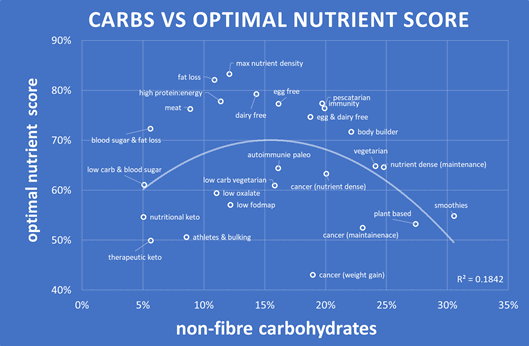
Finally, for macros, let’s look at fat vs carbs. The chart below shows that a low-carb diet tends to have more fat (and vice versa).

Before large-scale agriculture and processed foods, plenty of people were thriving on low-carb or low-fat diets. Mother Nature rarely provides foods that are an even mixture of fat and carbs at the same time and place, other than sometimes in autumn, to help us get fat for winter when food is expected to be scarce.
The ‘danger zone’ is when we eat foods composed of a similar amount of fat and carbs with low protein. These foods are super yummy and easy to overeat. We get a double dopamine hit from the fat and carbs together, so our lizard brain can’t get enough of them!
These are the foods that many people consider to be ‘bad carbs’ (e.g. doughnuts, chips, cookies, croissants, milk chocolate), but the reality is, most of the ‘bad foods’ are a similar mixture of fat and carbs together. Food manufacturers like to give us what we want to buy, so modern processed foods lie in this danger zone of fat+carb with less protein.
Nutrient density and macronutrients
Next, let’s look at the relationship between nutrient density and each of the macros. I think it’s much more helpful to think in terms of micronutrient rather than macronutrients, but it’s something that most people take a while to get their head around.
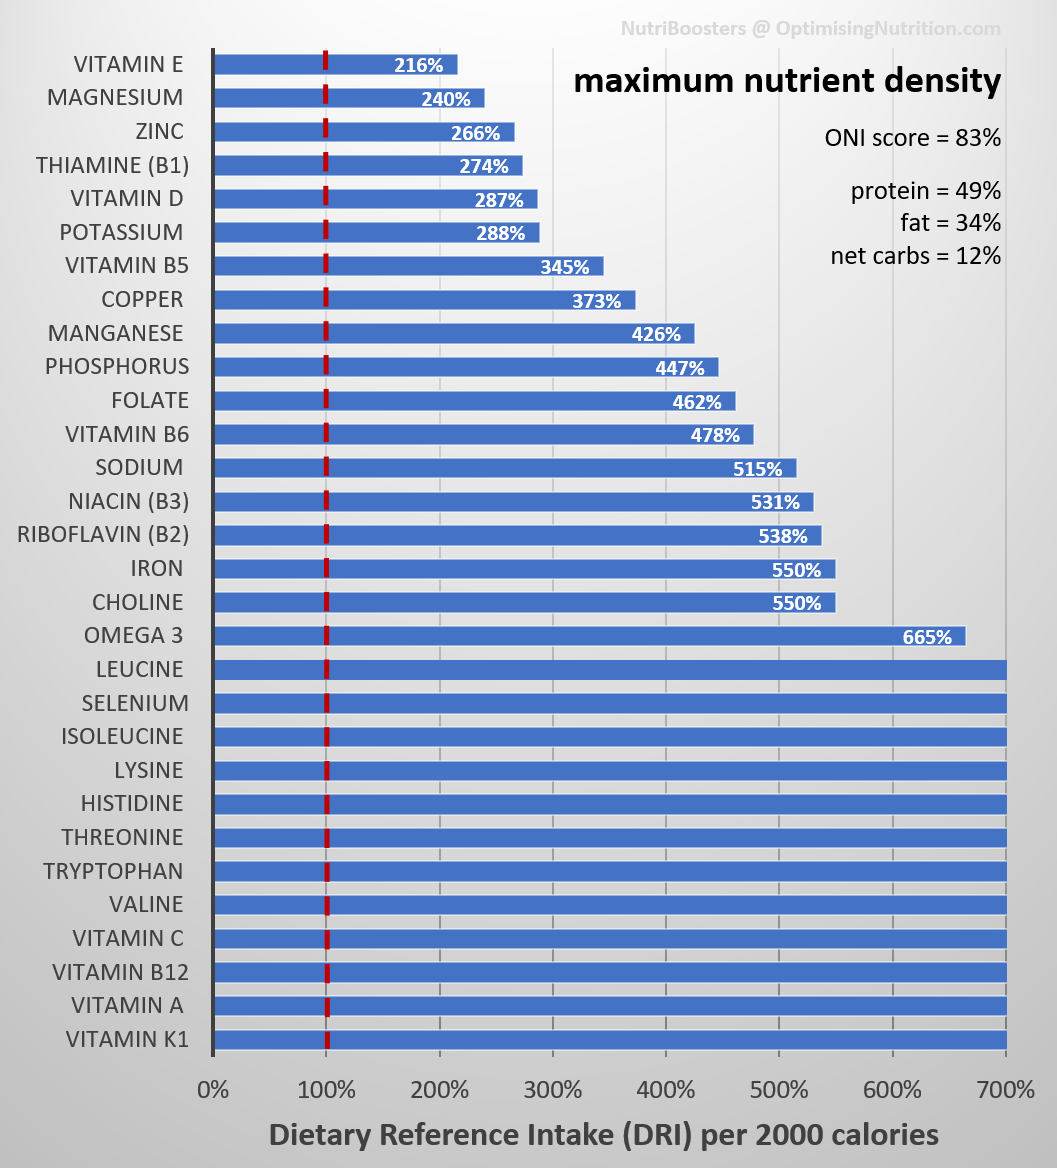
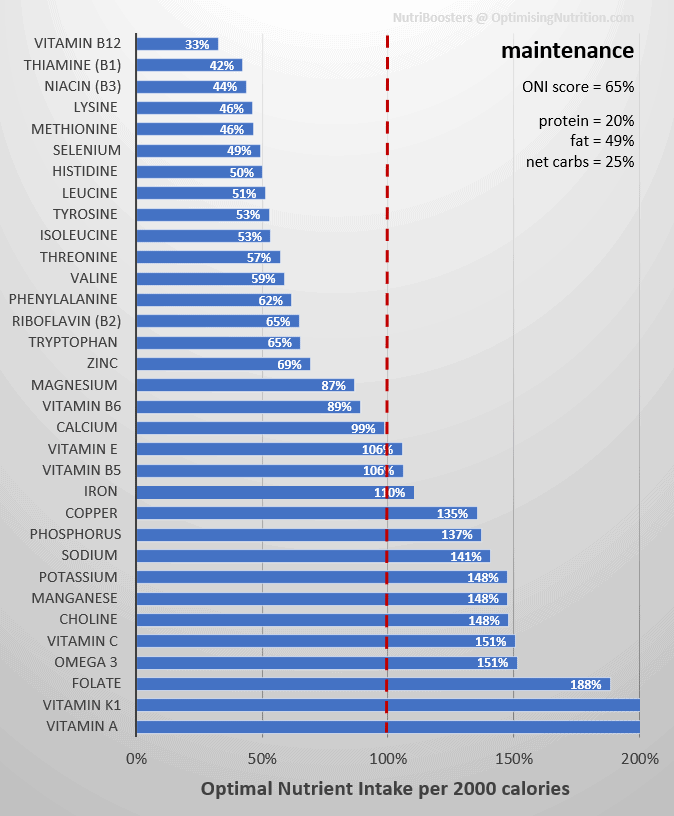
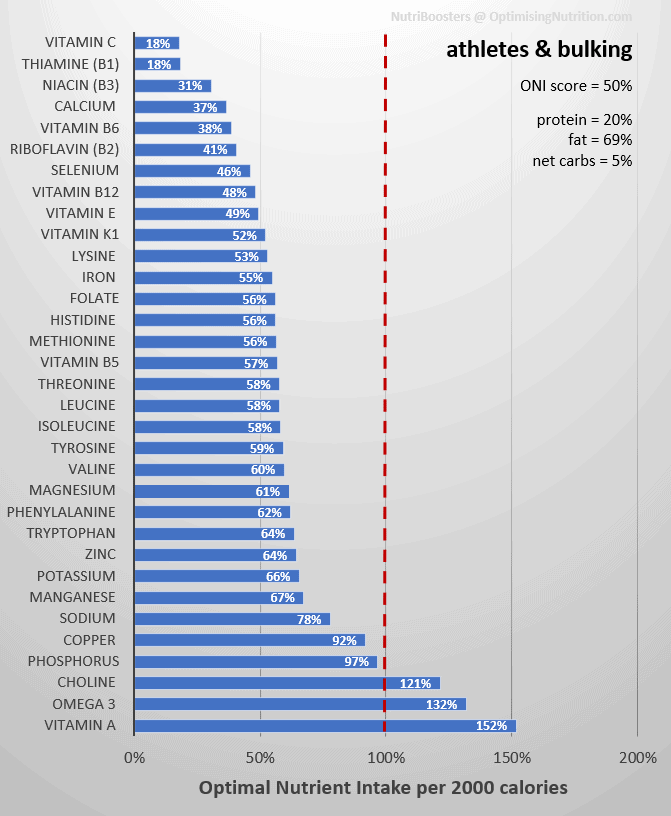
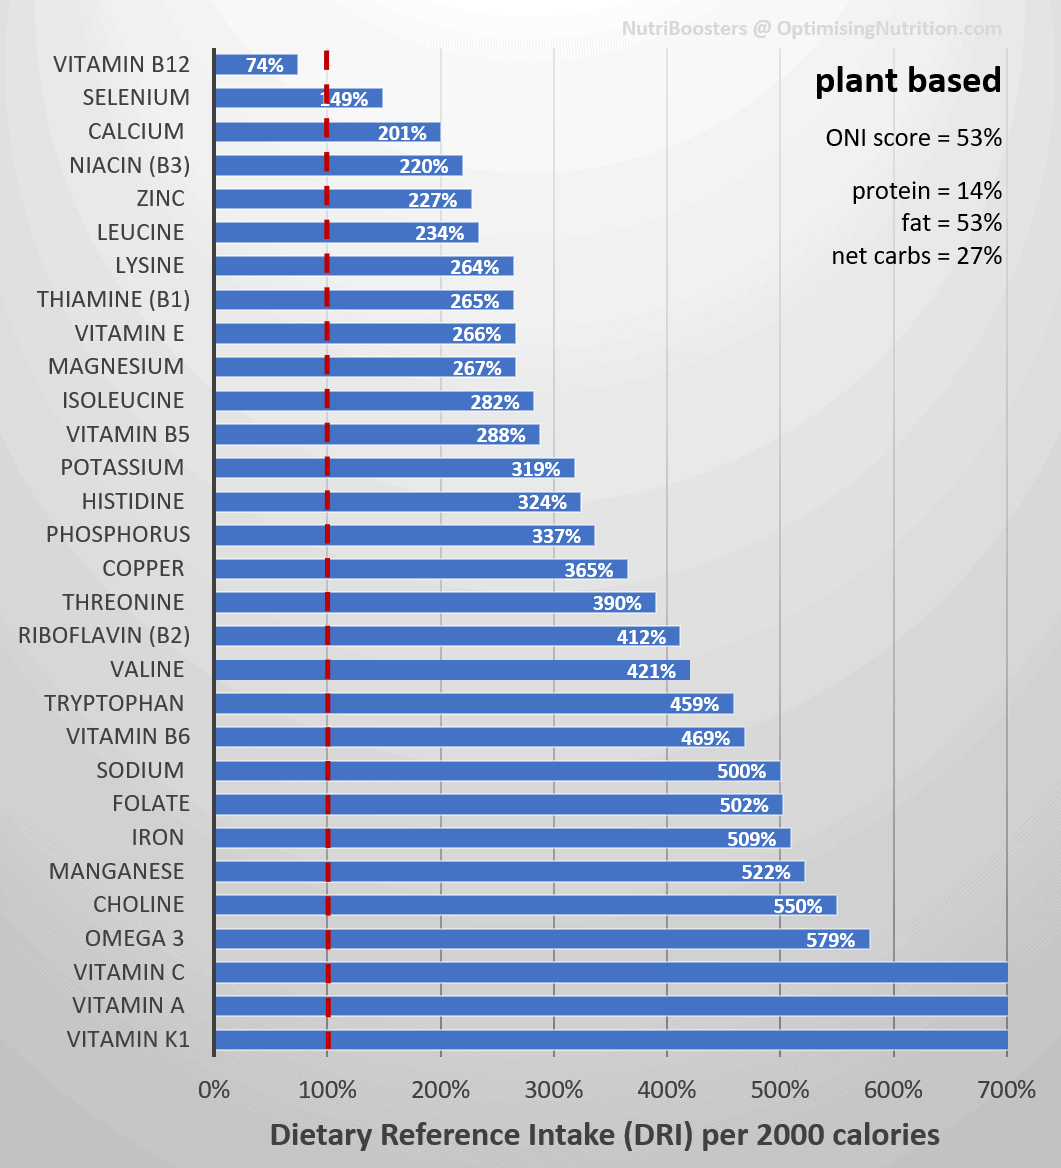
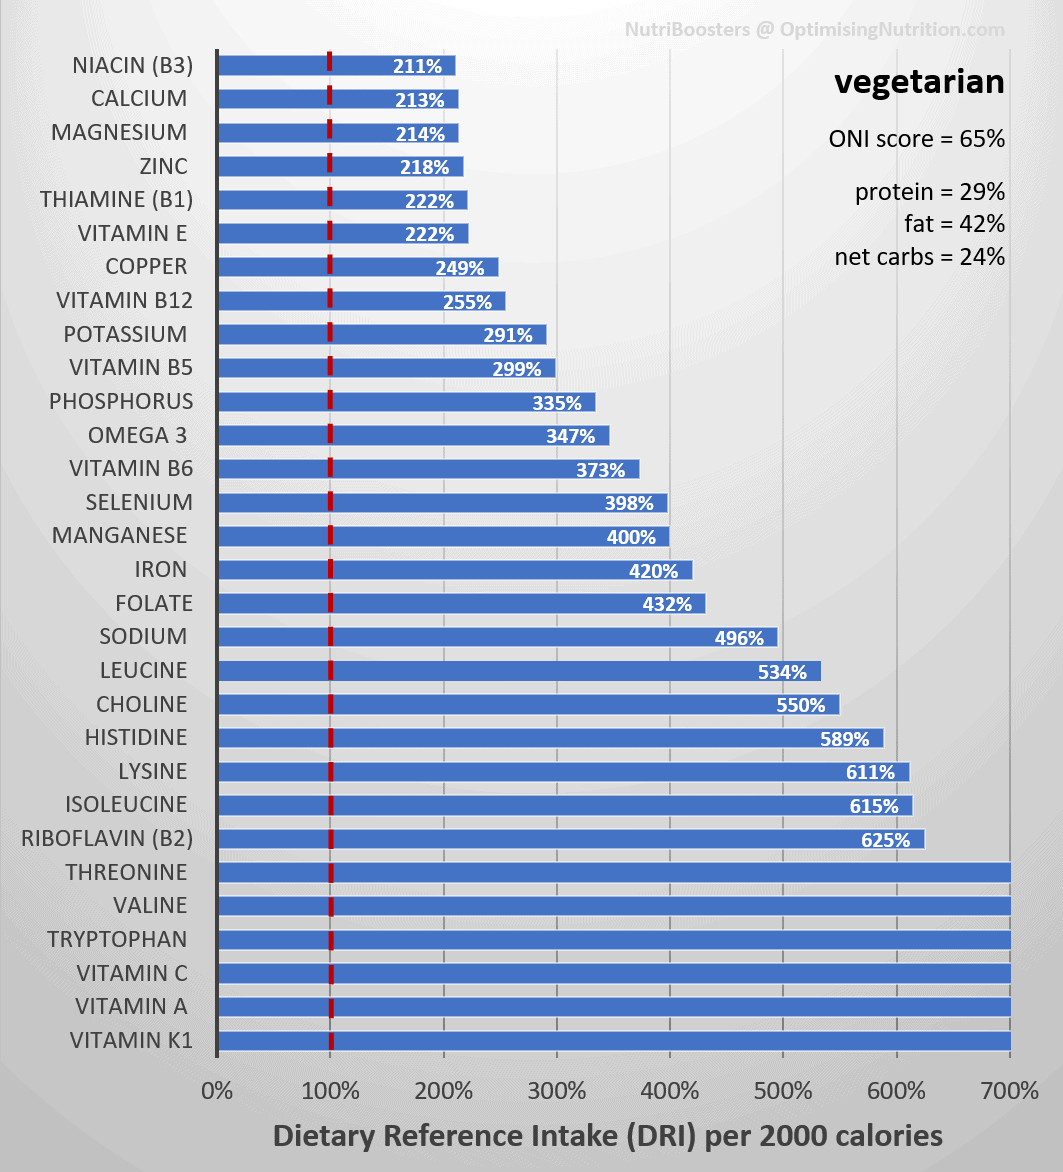
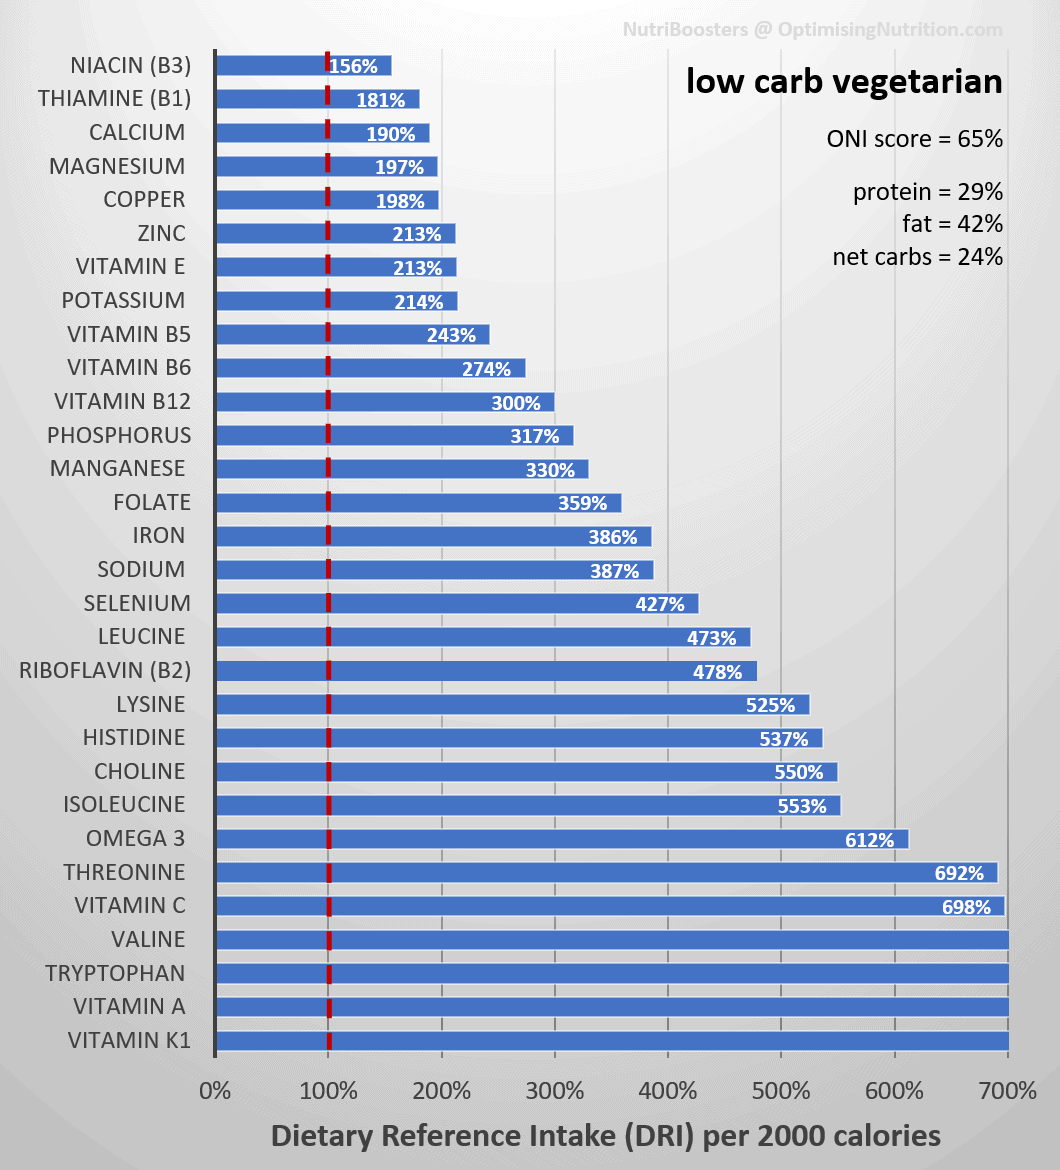
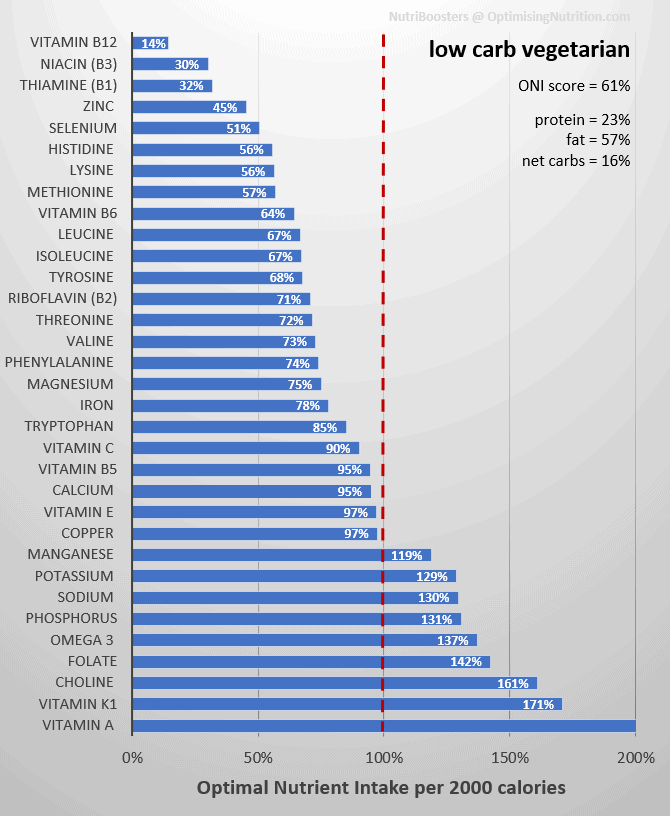
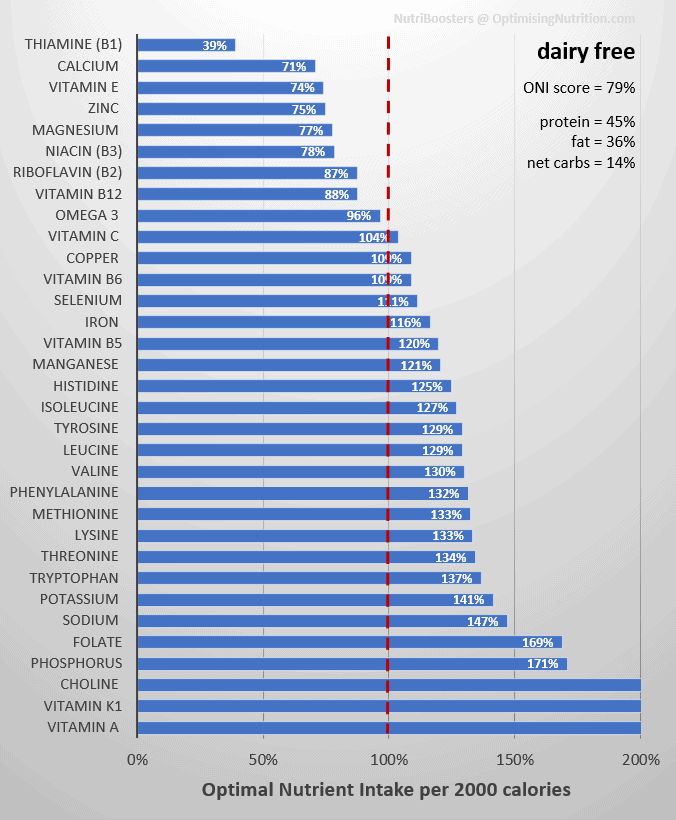
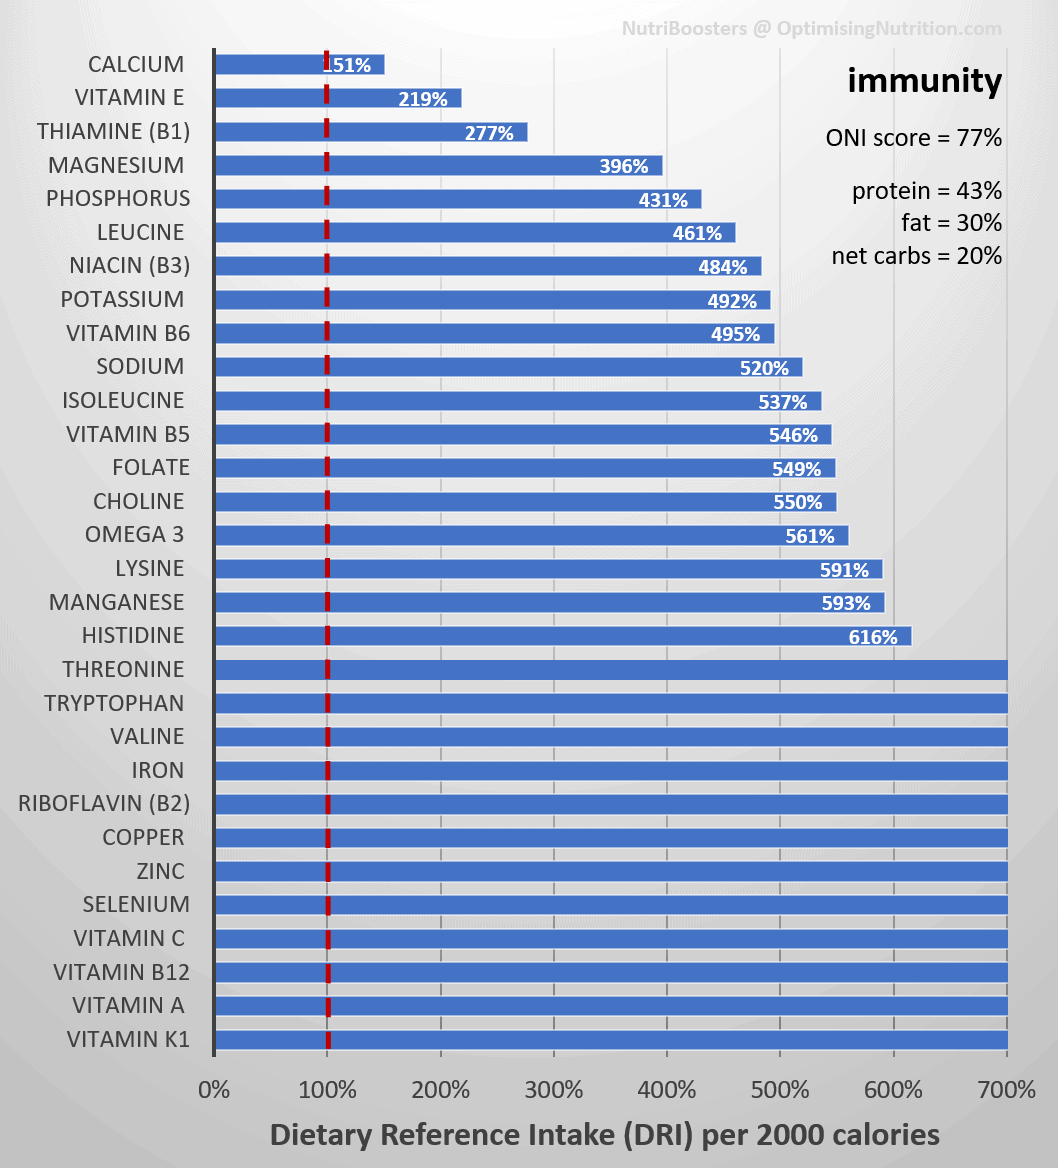
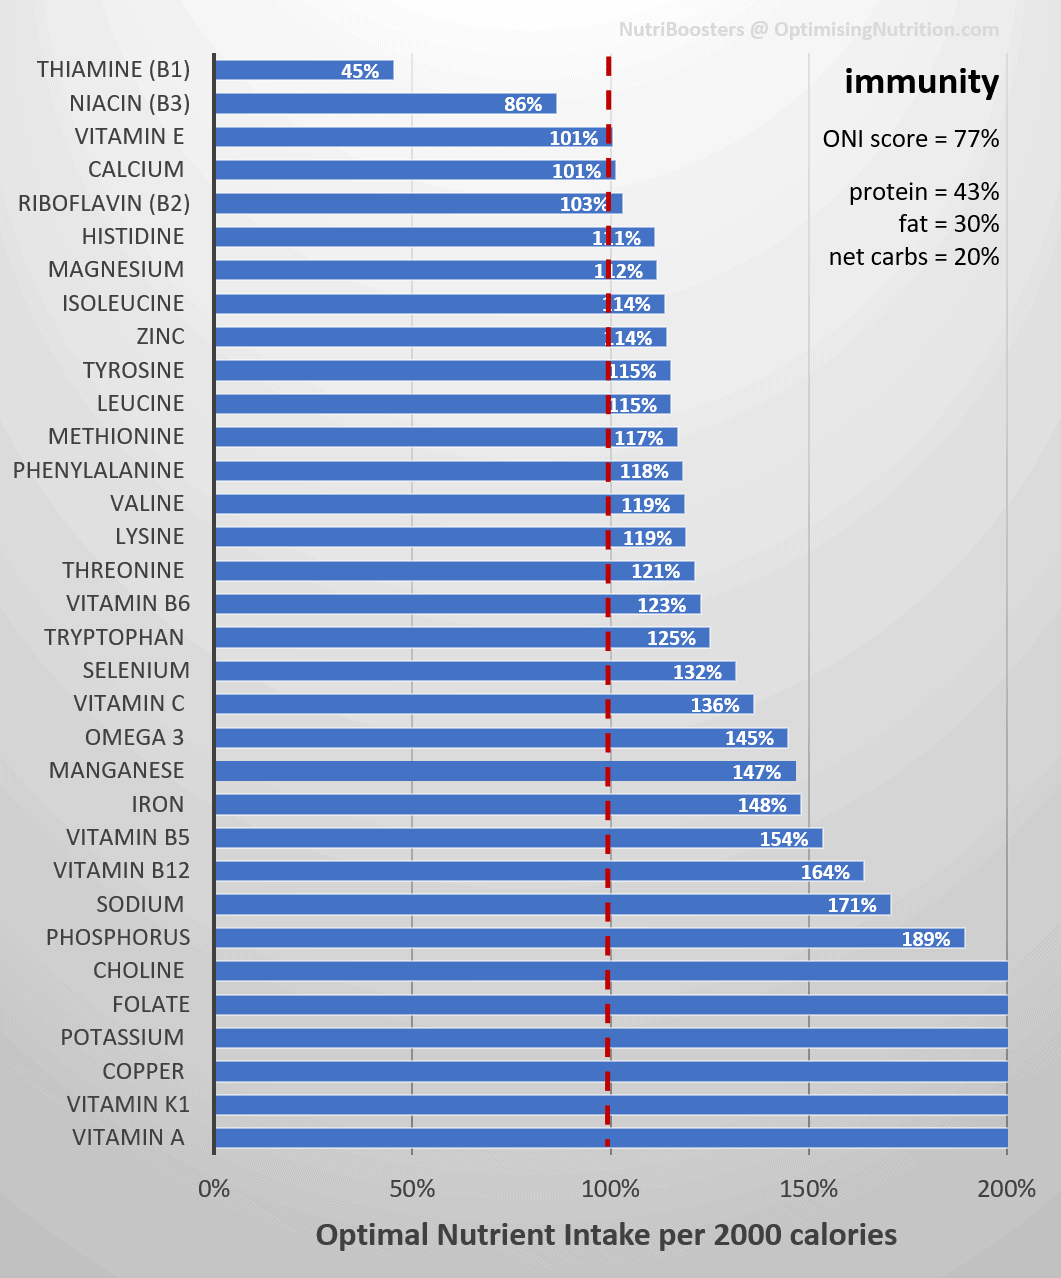
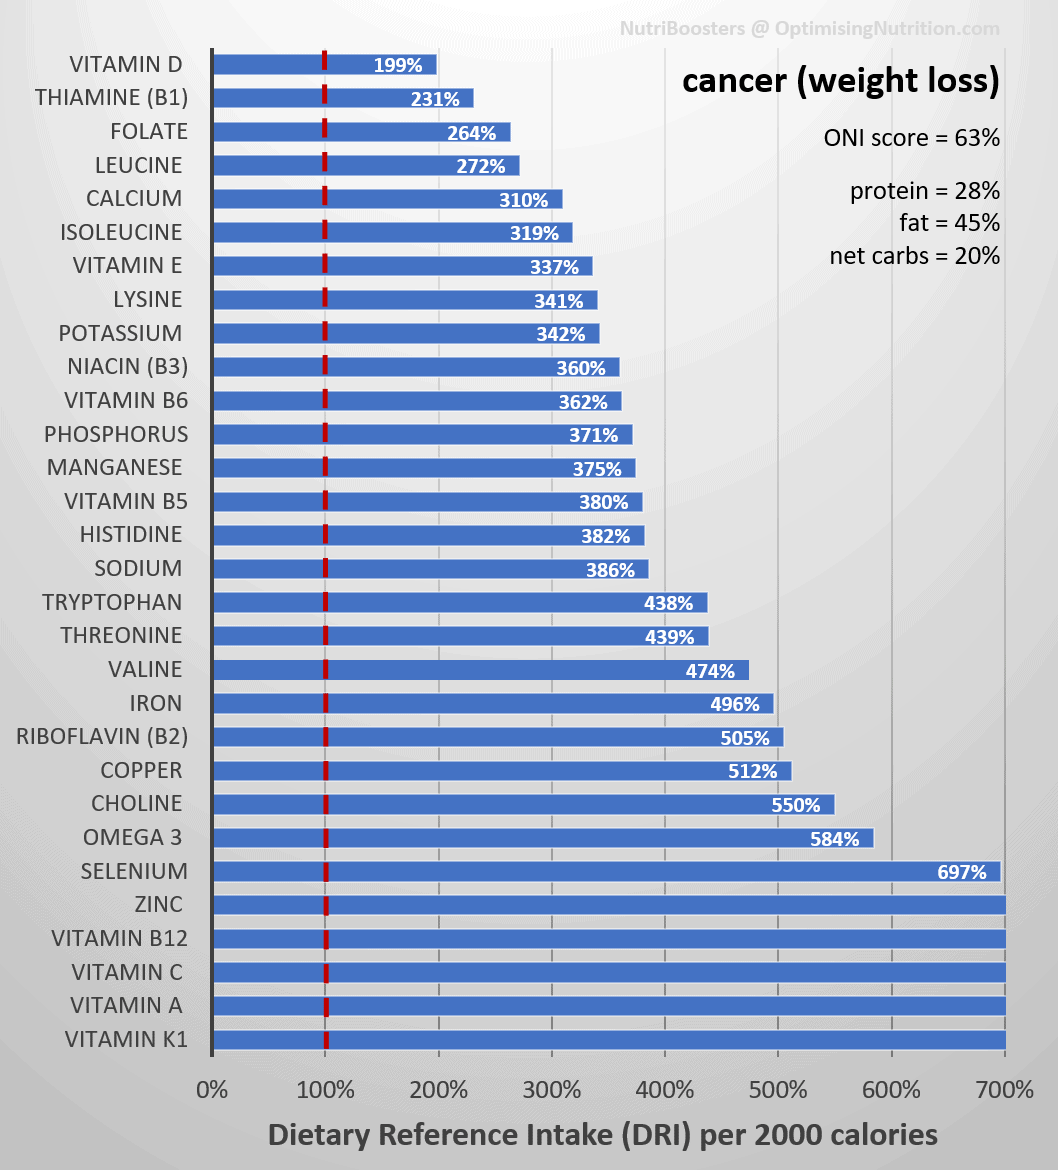
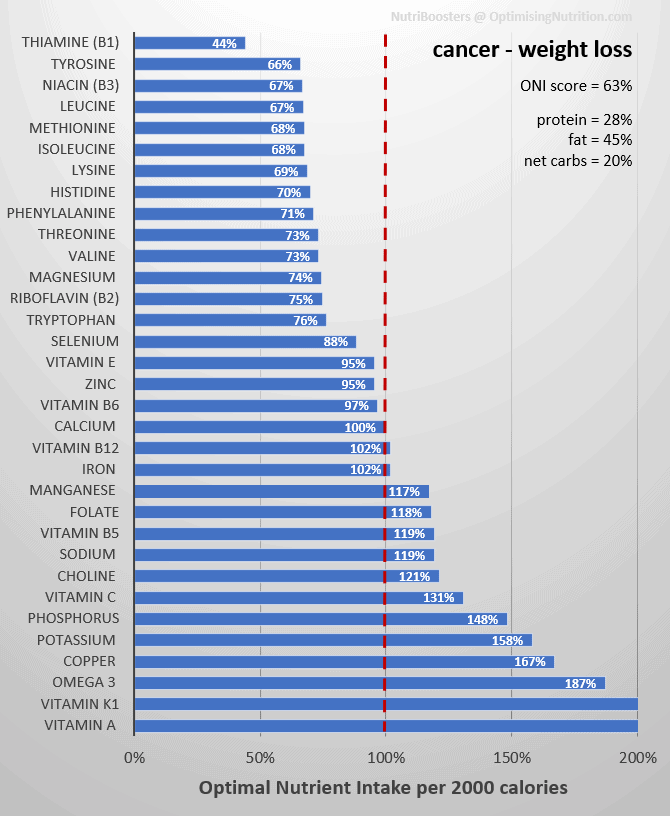
To explain what nutrient density looks like, the chart on the left below shows the micronutrient fingerprint of all foods in the USDA database. You can see that towards the top, it is harder to get nutrients like omega 3, vitamin A from the commonly available foods. Meanwhile, at the bottom of the chart, we can see that sodium, phosphorus and iron are much easier to get plenty of.
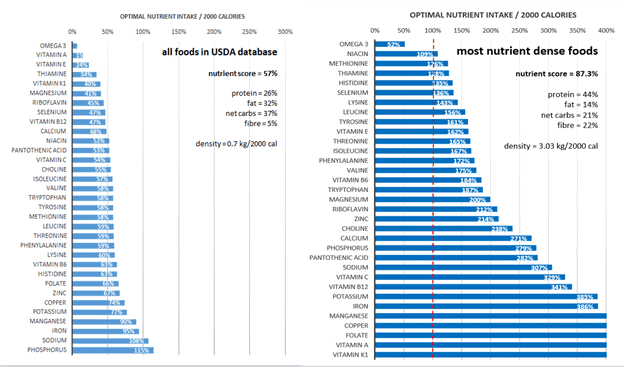
Note: The x-axis on these nutrient fingerprint charts represents the Optimal Nutrient Intake for each of the nutrients. The Optimal Nutrient Score is the area to the left of the 100% line that is filled.
By prioritising foods that contain more of the harder-to-find nutrients, we can get a much better nutrient profile. This means we don’t need to eat as many calories to get the nutrients we need to thrive. Nutrient-dense foods are also more satiating and nutritious.
If you were to ask me if there was just ONE thing you should prioritise to improve your food quality, nutrient density would be it! As you will see below, focusing on the protein % of your diet (by dialling back fat and carbs) gets you most of the way there. But chasing nutrients is the proverbial icing on the nutritional cake.
Nutrient density at macro extremes
People often think in terms of ‘high vs low’ or ‘maximum vs minimum’ to judge ‘good vs bad’. To show you what the nutrient profile looks like at extremes, I have created a few charts from our database of 1800 recipes.
Maximum vs minimum fat
The charts below show the nutrients that you would get if you prioritised minimum (on the right) vs maximum fat (on the left).

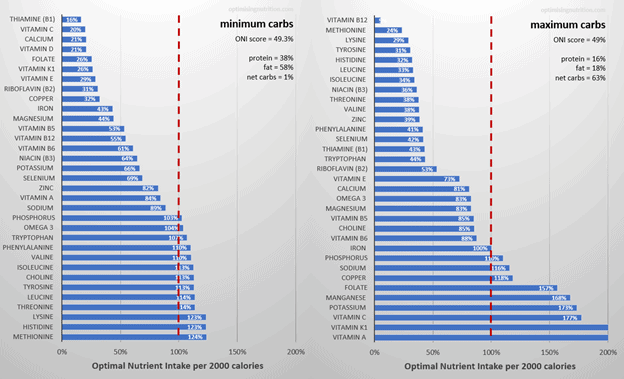
Maximum vs minimum carbs
This next pair of charts shows the difference in nutrient profile if you were to think in terms of low carb versus high carb.
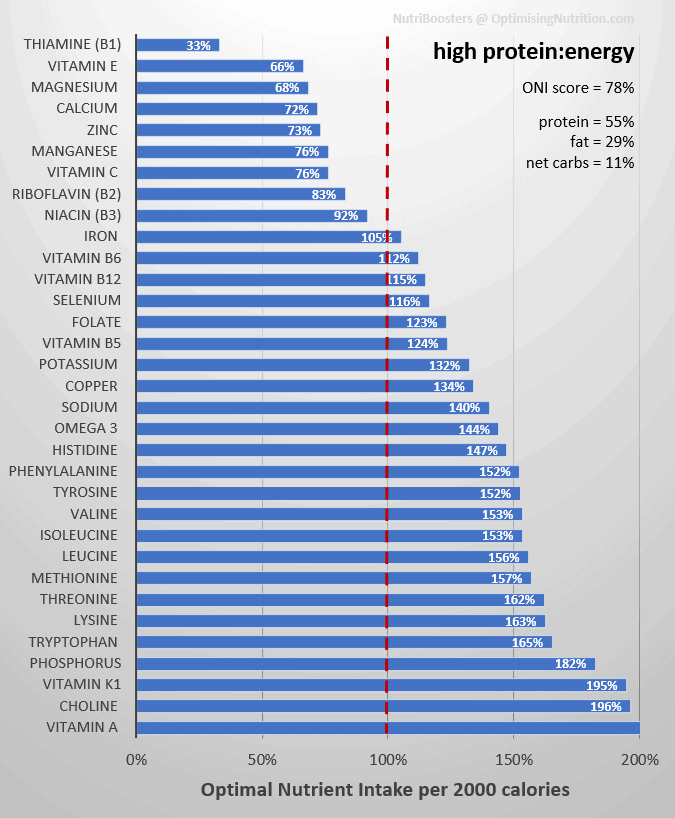
Maximum vs minimum protein
Then we have high vs low protein.

Maximum vs minimum nutrient density
Of all the options, thinking in terms of higher protein gives you the best nutrient profile. But it still is not as good as simply prioritising maximum nutrient density. To illustrate, the two charts below show the comparison of minimum vs maximum nutrient density.

Nutritional comparison of dietary extremes
By eating the meals with maximum nutrient density, you will get the best micronutrient profile of all the options.
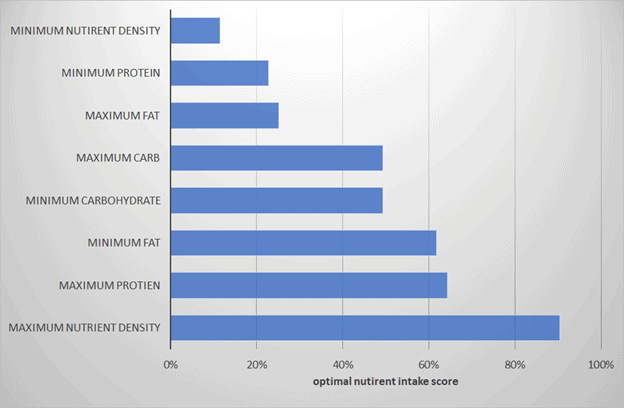
Once you’ve got the nutrients you need, you can add in energy from nutritious foods that contain more fat and/or carbs.
Protein vs nutrient density
To dig further into the detail of the relationship between nutrient density and macros, the following chart shows protein % vs Optimal Nutrient Intake Score.
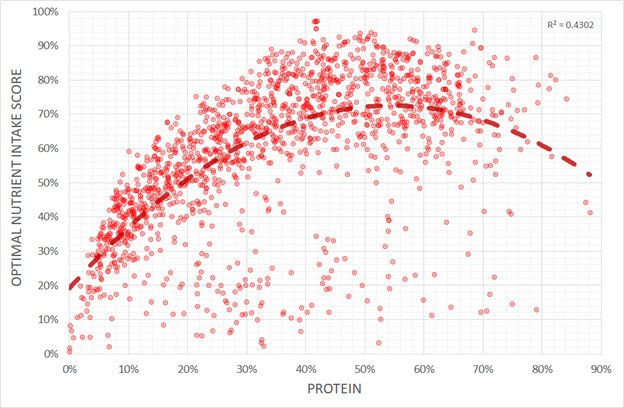
Up to about 50% protein, foods and meals with a higher percentage of protein provide more nutrients per calorie. Because our bodies crave a balance between nutrients and energy (from carbs and fat), not many people maintain a diet with 50% protein.
If you want to maintain your body weight or fuel a significant amount of exercise, then a 50% protein diet will not necessarily be optimal for you. However, if you have heaps of excess energy (glucose and/or fat) stored on your body, then dialling up the protein % can help you get enough nutrients while some of your energy comes from your body (i.e. the glucose in your blood and liver and the fat on your bum and belly).
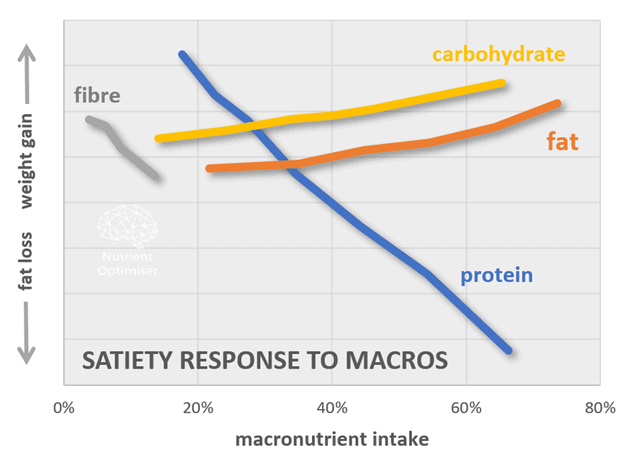
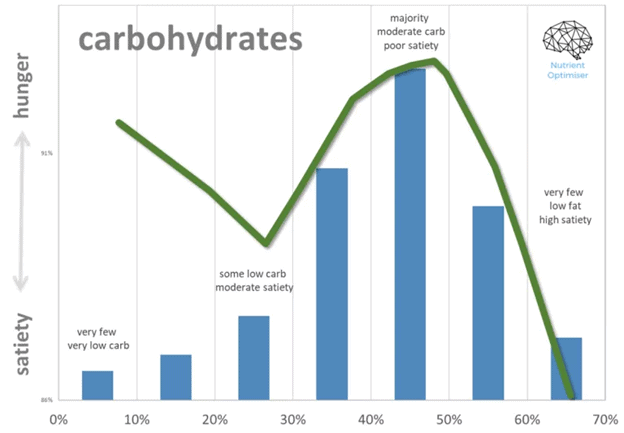
To put this in context, the average protein intake in the US (and many other places) is around 13-15%. Not only is this less nutritious, but it also leads to the lowest satiety per calorie and hence the greatest energy intake (as shown in the intake vs protein % chart below from our satiety analysis of data from Optimisers).
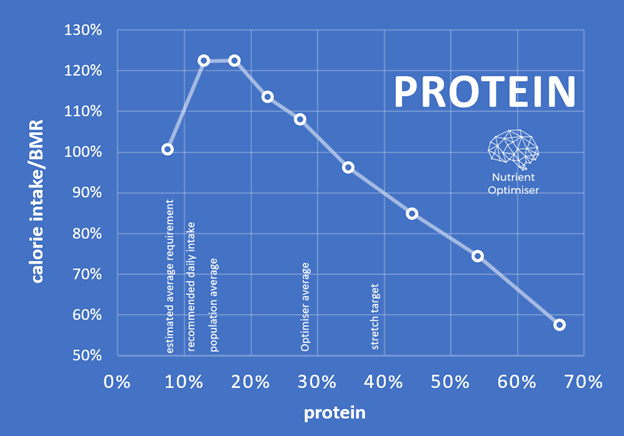
It seems we have optimised our food system for maximum energy intake. This is great if winter or famine is just around the corner, but we are perpetually stuck in autumn. Winter never comes.
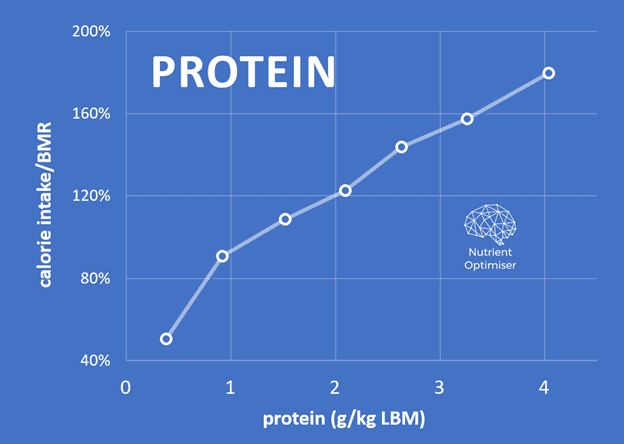
It’s not more protein, but a higher % protein!
We don’t advise you try to jump to a high protein % overnight, but rather progressively titrate up your protein %. You only need to increase your nutrient density and protein % if your progress stalls and you are no longer getting the results you want.
The key is a higher percentage of protein. As shown in the following chart from our satiety analysis, people who eat more protein (in grams) tend to eat more calories (especially from fat). The key is to focus on dialling up your protein percentage (by dialling back fat and/or carbs).
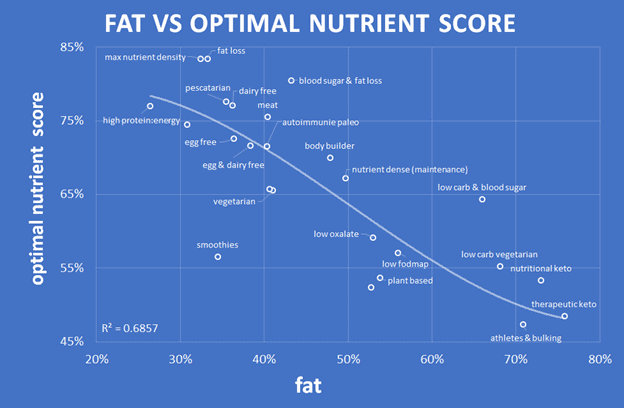
Fat vs nutrient density
The following chart shows fat vs nutrient density. Towards the right, we see that a very high-fat diet aligns with lower nutrient density (as well as lower satiety). Nutrient density appears to peak at around 35% fat.
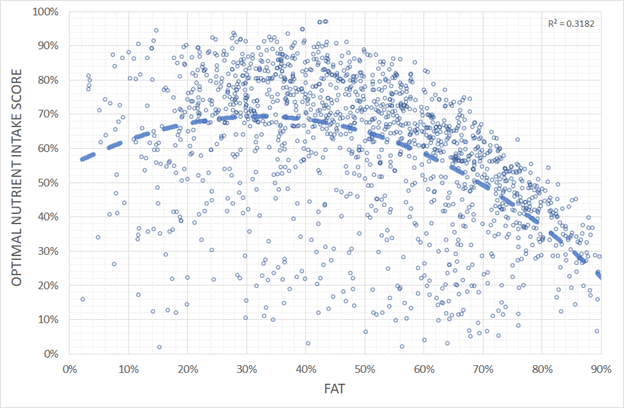
It may be hard to jump to 35% fat in your diet. But you can do it slowly and ratchet it up as required to ensure you continue to get results. We rarely live at optimal all the time, but if you know where optimal is, you can move in that direction.
Lasting and sustainable habits usually occur through gradual changes. Start by cutting back the added fats and full-fat dressings. Later, you can then start to choose leaner meats and seafood that will give you more protein and nutrients with fewer calories.
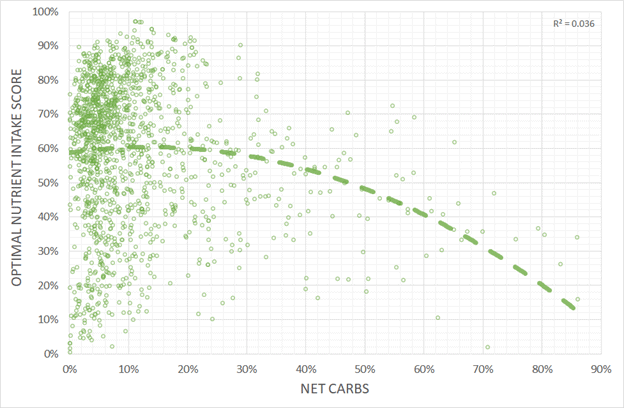
Carbs vs nutrient density
Finally, we have carbs vs nutrient density. Even though the correlation is low, you can see that higher carb foods tend to be less nutritious. Again, as you focus on more nutrient-dense foods, you will automatically reduce your intake of processed carbs.
Macros and micros together
To bring this all together, the chart below shows all three macros vs nutrient density on the one chart.
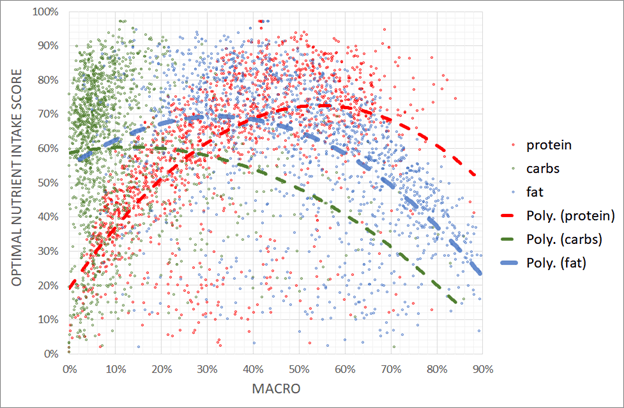
To summarise:
- Protein (red line) is the one macro that aligns with a higher nutrient density (up to about 50%).
- Higher fat foods (blue) are marginally more nutrient-dense than high carb foods (green).
- It’s the protein you want to prioritise if you want to move towards a diet with more satiety and nutrient density.
If you think in terms of maximising micronutrients, you will tend to increase protein and decrease easily accessible energy from fat and carbs.
Our NutriBooster Recipe books
Hopefully, at this point, you’re not too overwhelmed by the numbers and analysis. We understand that most people don’t like to quantify and analyse everything they eat.
To help you navigate the macro and micronutrient jungle, we have put a lot of time into developing a series of nutrient-dense recipe books.
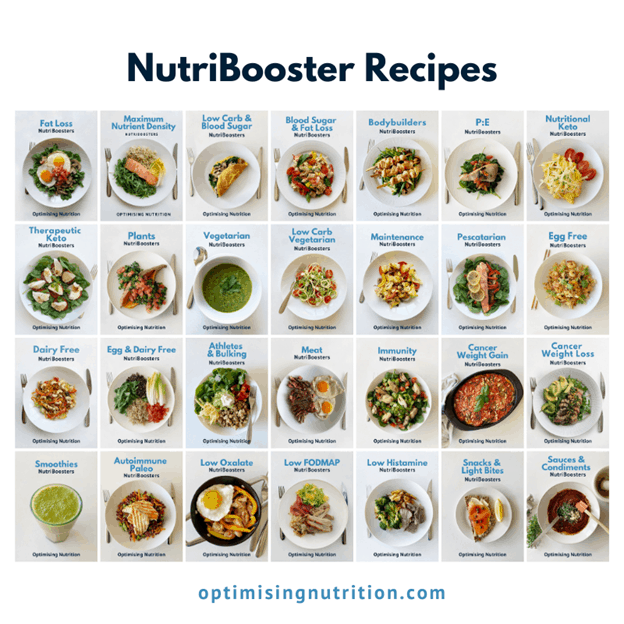
To demonstrate how each of these books is different, the charts below show the recipes included in each book in terms of macros vs nutrient density. They follow a similar trend to the individual meals, with protein being most strongly correlated with nutrient density.

Carb intake is not strongly correlated with nutrient density, but a moderate amount of carbs (e.g. 10-25%) seems to be better than aiming for zero carbs.
Finally, we have fat. While you need to get your energy from somewhere, the lower-fat approaches tend to align with more nutrient density and will allow for fat loss from your body.
The essential collection
The table below lists our most popular recipe books tailored for a range of goals, from aggressive fat loss to bulking, diabetes management, and everything in between.
- The ‘metrics’ column details the blood sugar and waist: height ratio (W: H) that aligns with each goal.
- Overfat people (with a waist: height ratio of greater than 0.5) need NutriBoosters that provide greater satiety to empower them to eat less without excessive hunger.
- People with a blood glucose rise of more than 30 mg/dL or 1.6 mmol/L an hour or two after eating require meals with a lower insulin load to assist them in stabilising blood sugars, normalising appetite, and avoiding blood sugar crashes.
- Click on the title in the left-hand column to access more details for that specific book.
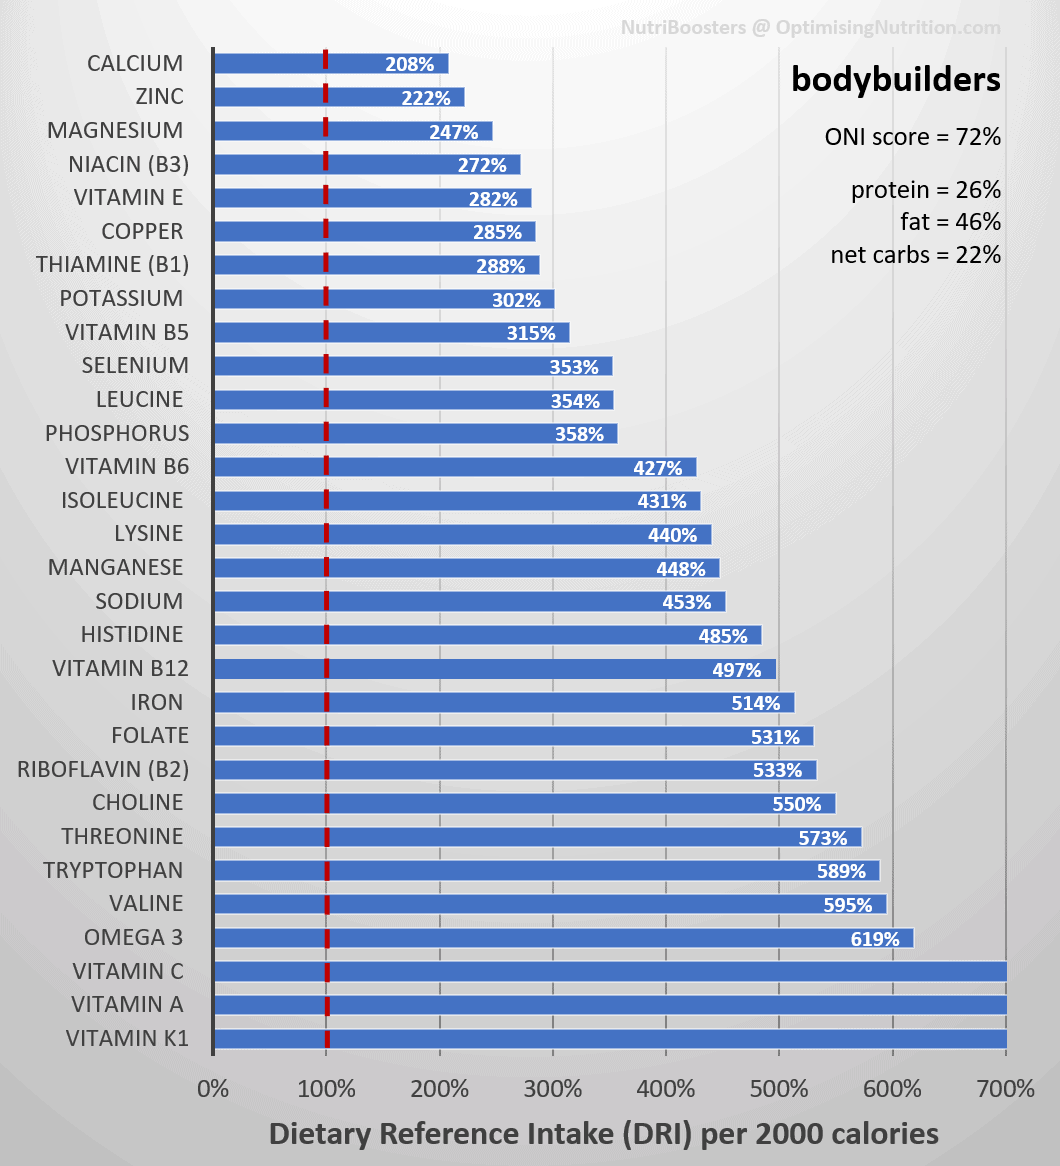
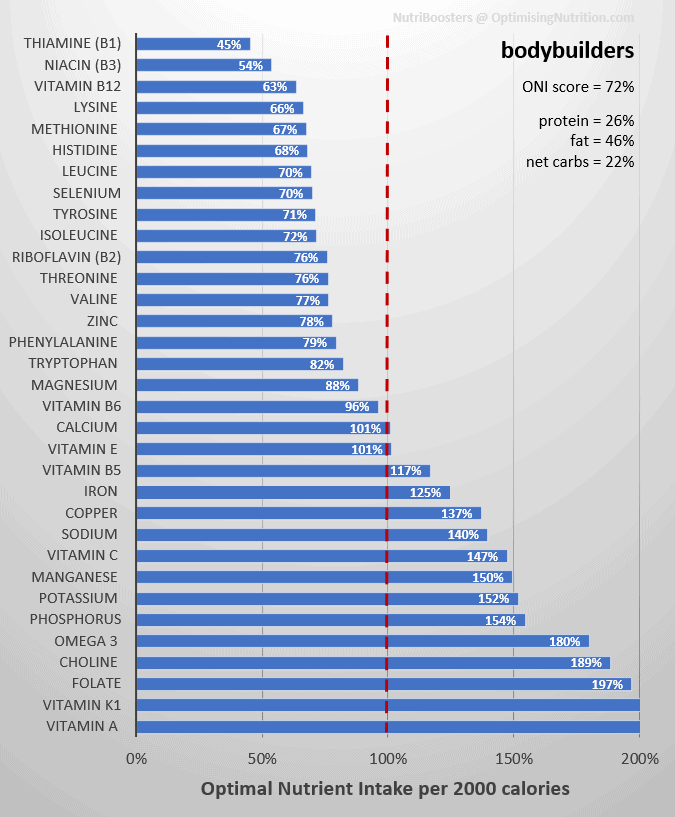
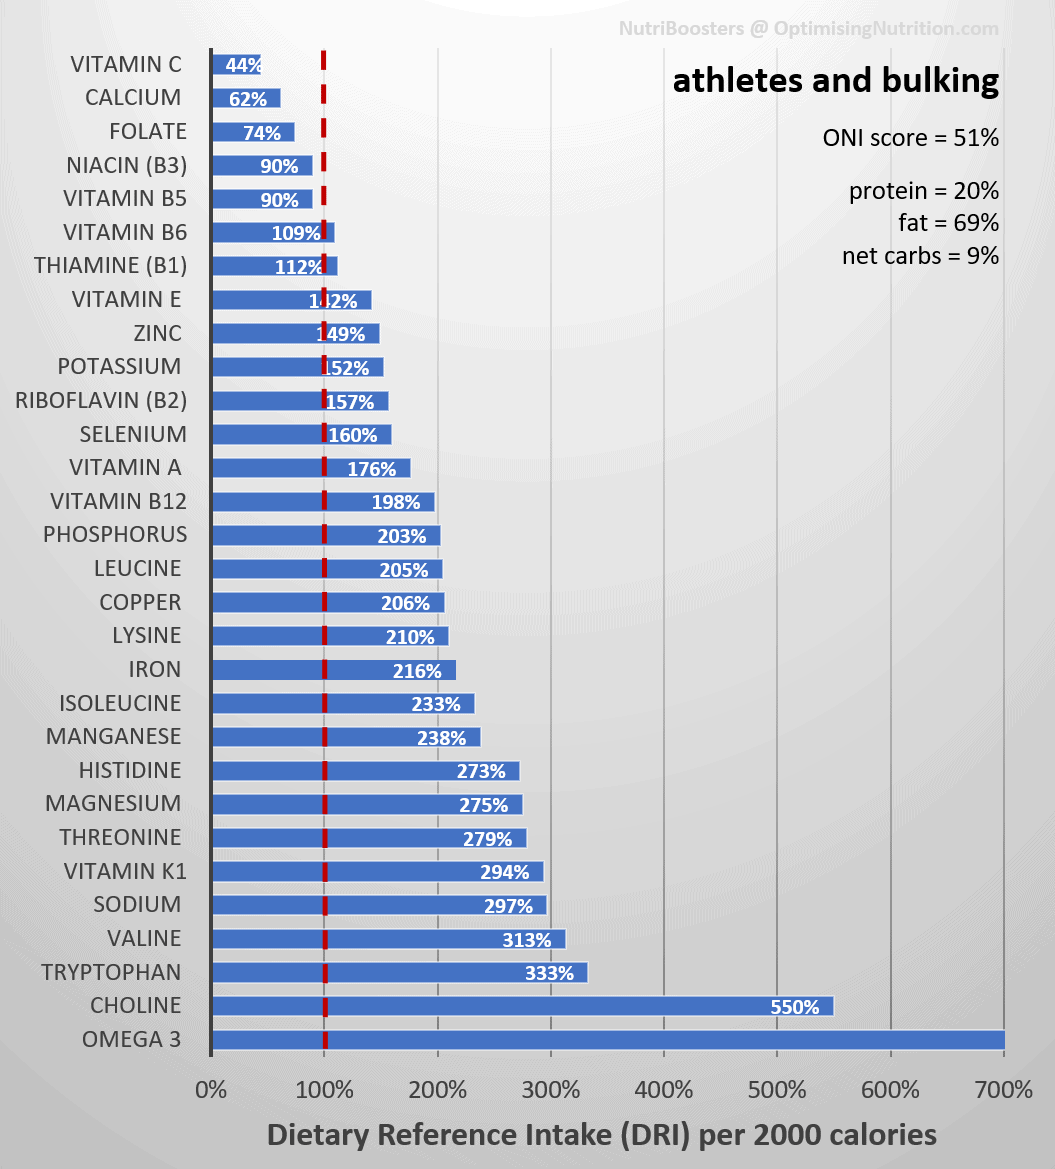
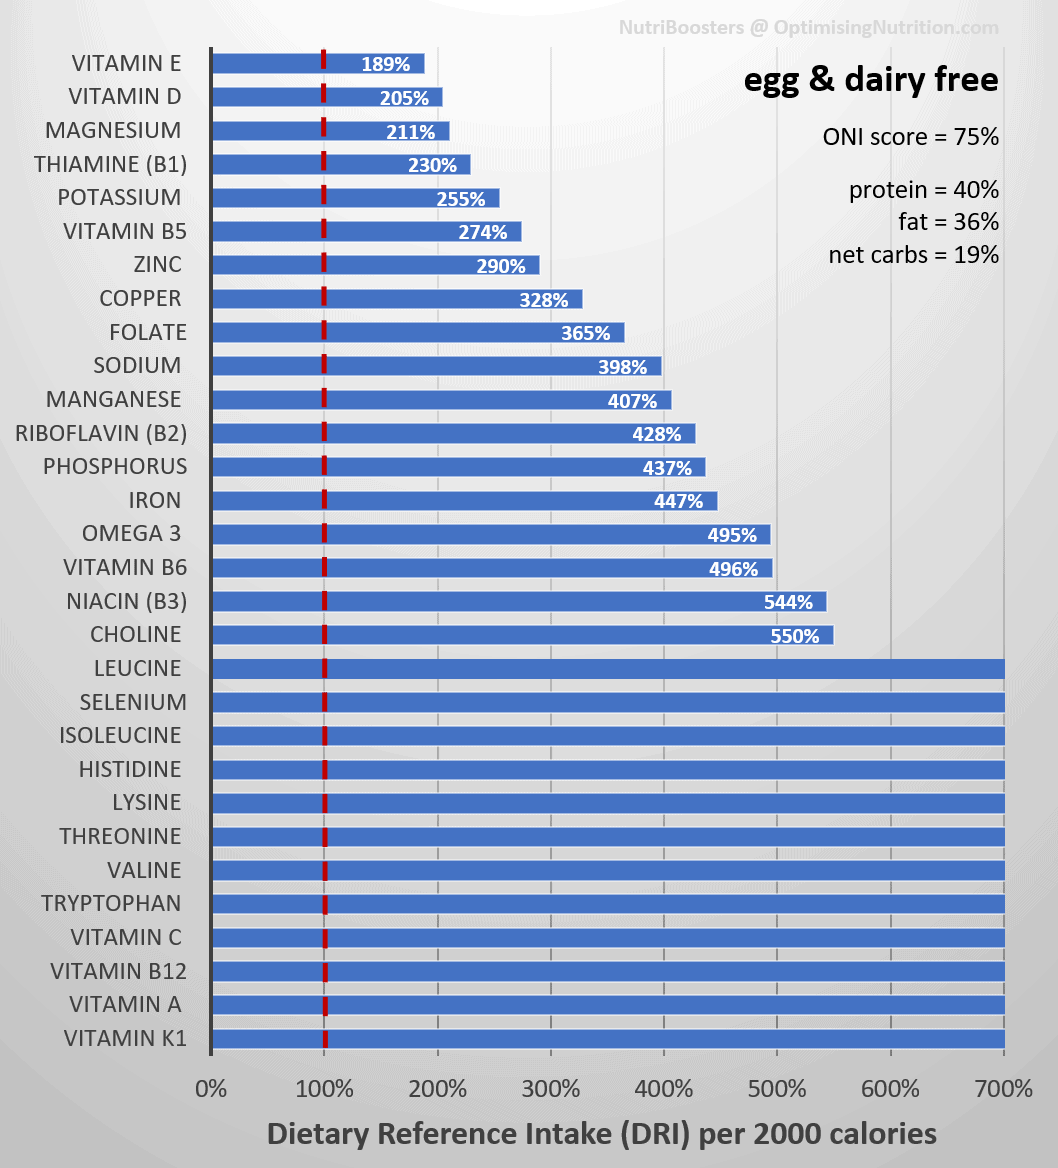
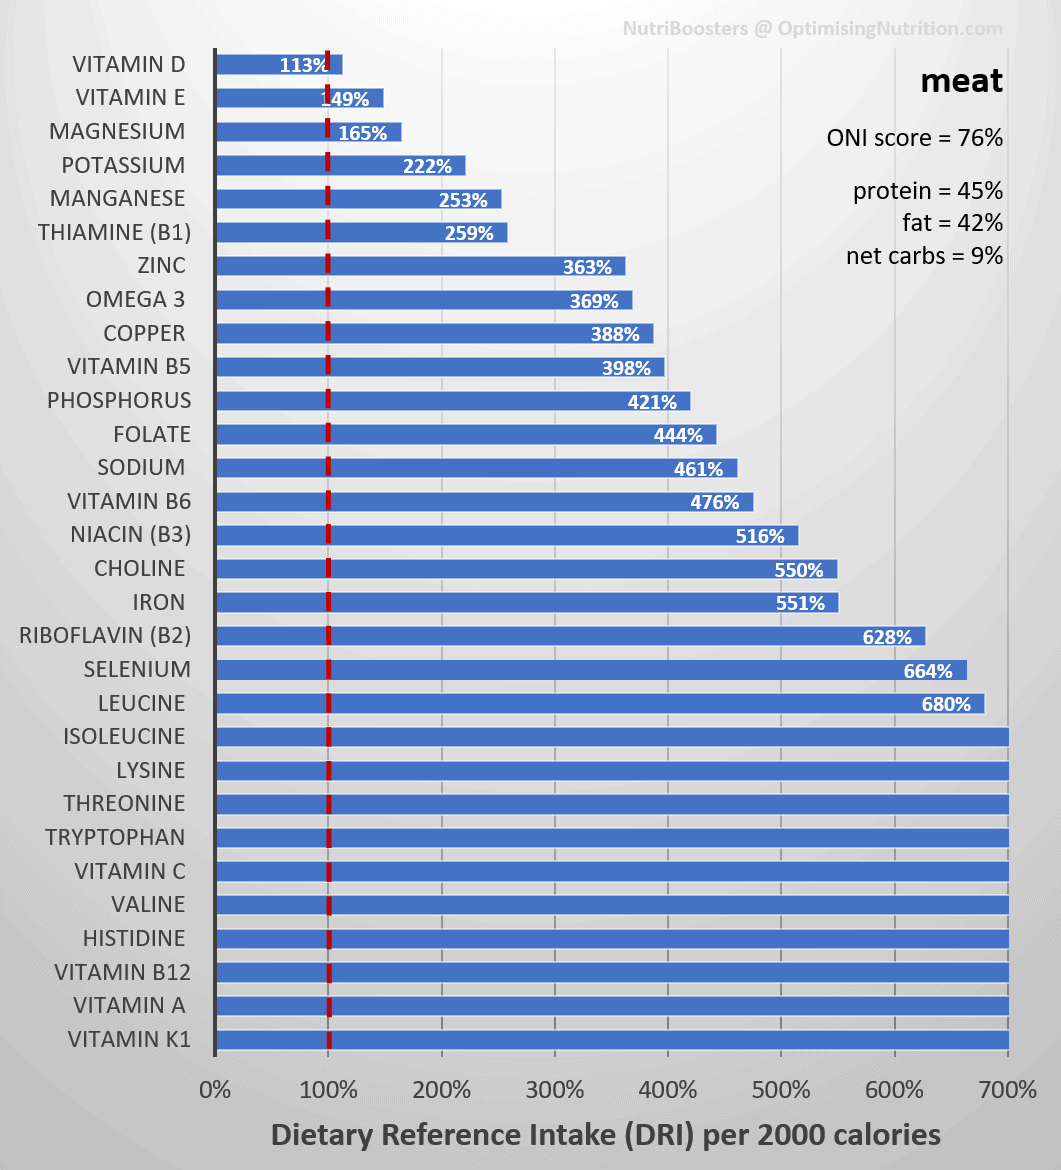
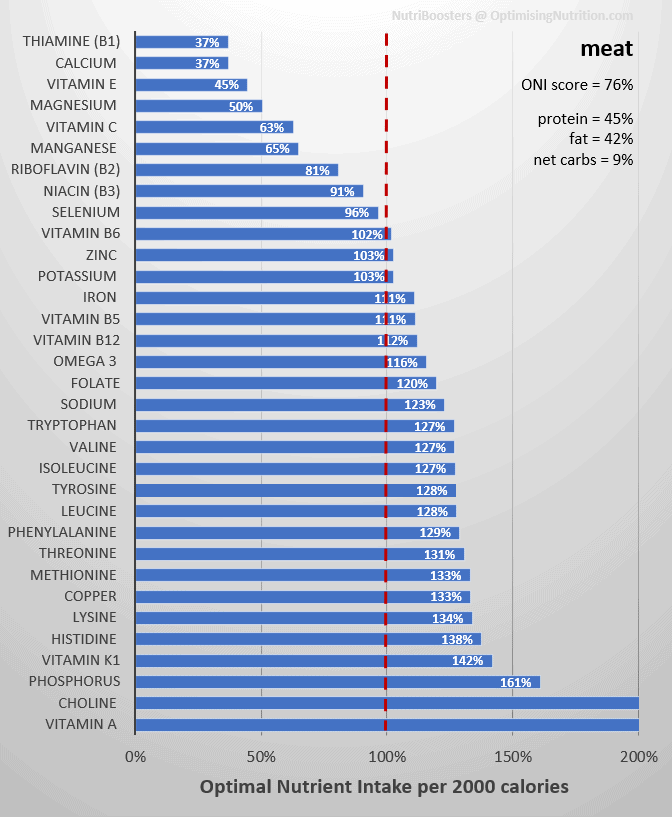
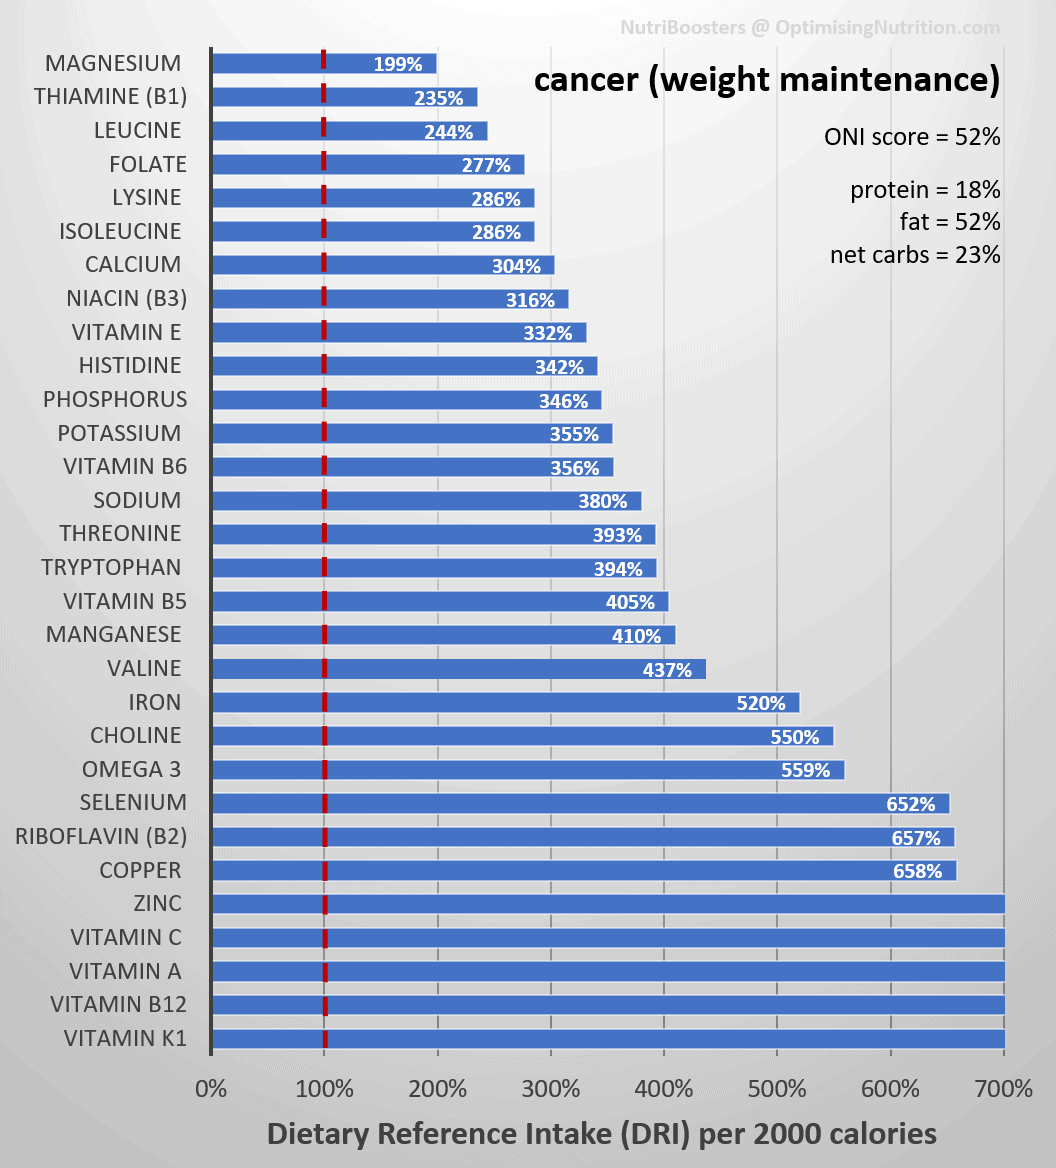
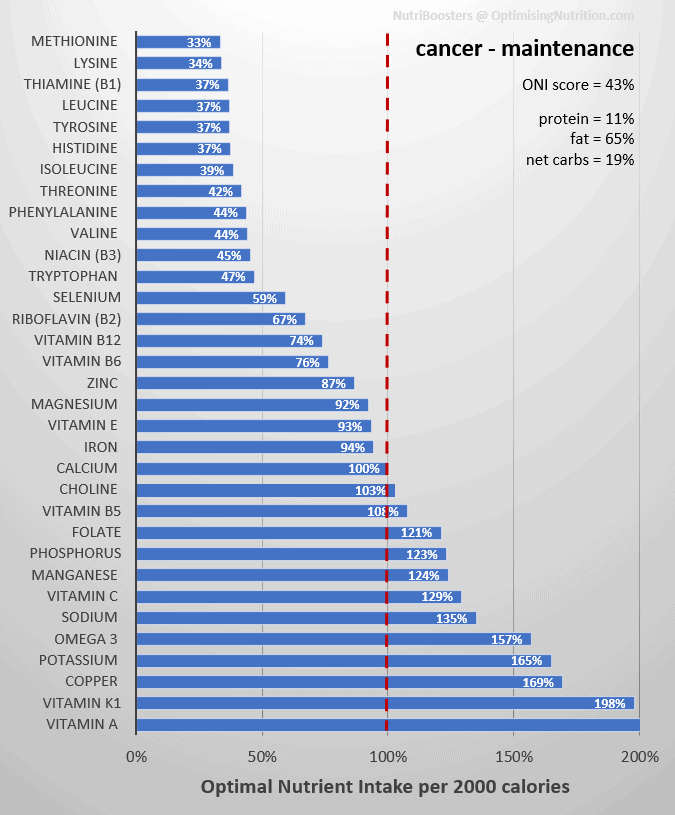
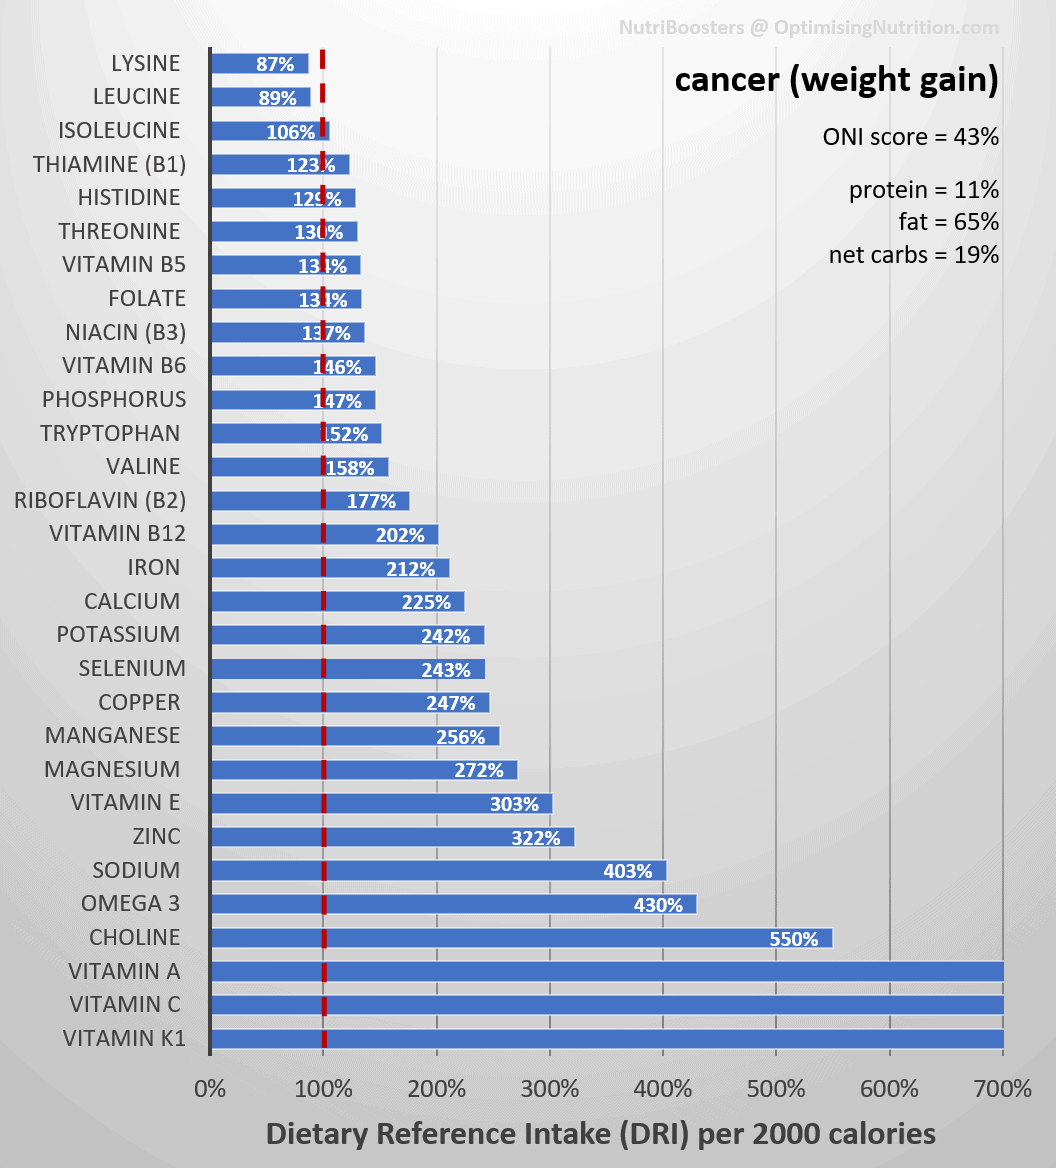
- Click on the ‘DRI’ and ‘ONI’ in the right-hand column to see the nutrient fingerprint of that recipe book (i.e., micronutrients and macronutrients) in terms of the Dietary Reference Intake and our Optimal Nutrient Intakes.
| Name | Goal | Metrics | DRI | ONI |
| Fat loss | Fat loss with greater satiety and less hunger and cravings due to nutrient deficiencies and adequate protein to prevent muscle loss | W:H > 0.5 | DRI | ONI |
| Maximum nutrient density | Maximum nutrients per calorie | NA | DRI | ONI |
| High protein: energy | High protein:energy ratio for aggressive fat loss | W:H > 0.5 | DRI | ONI |
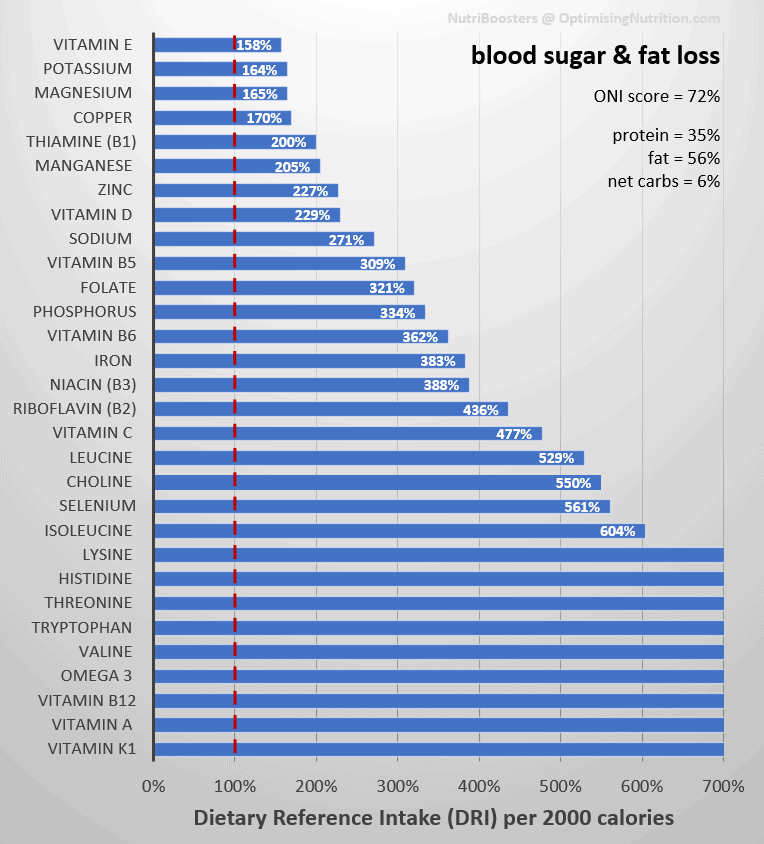
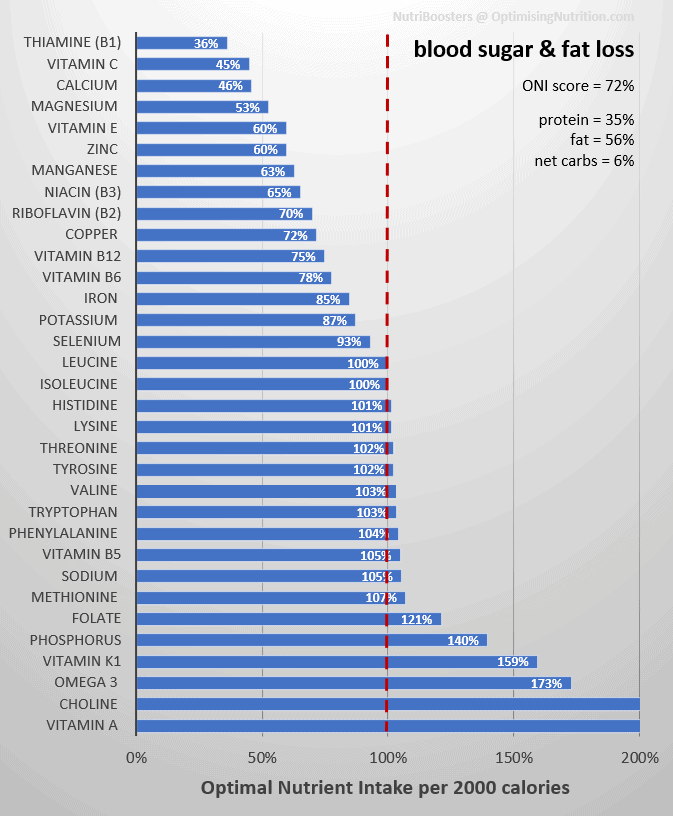
| Blood sugar & fat loss | Designed for anyone with elevated blood sugars and excess body fat | W:H > 0.5 BG rise after meals > 30 mg/dL or 1.6 mmol/L | DRI | ONI |
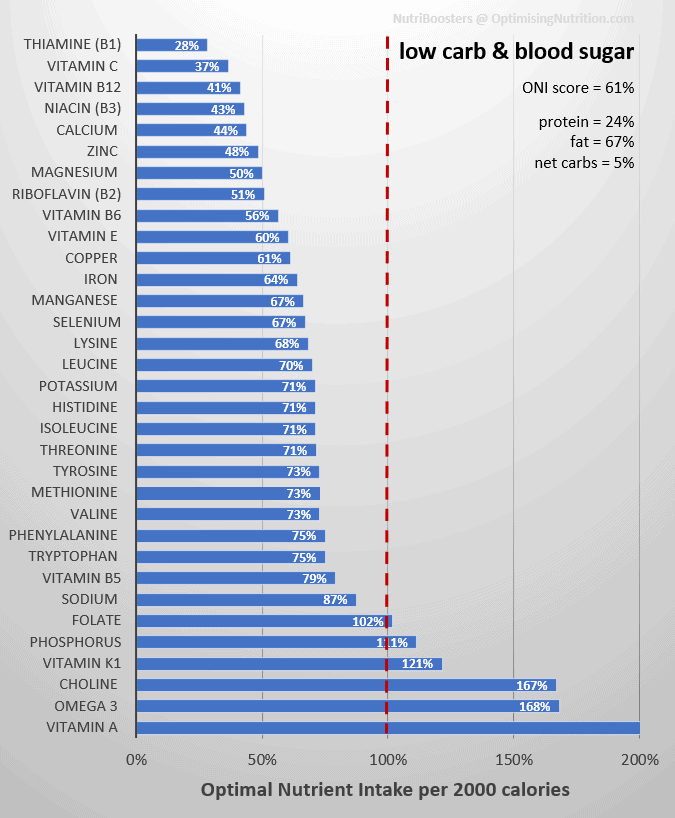
| Low carb & blood sugar | Designed for stable blood sugars and weight maintenance on a nutritious low-carb diet. Ideal for someone with diabetes or anyone who enjoys a low-carb way of eating | W:H < 0.5 BG rise after meals > 30 mg/dL or 1.6 mmol/L | DRI | ONI |
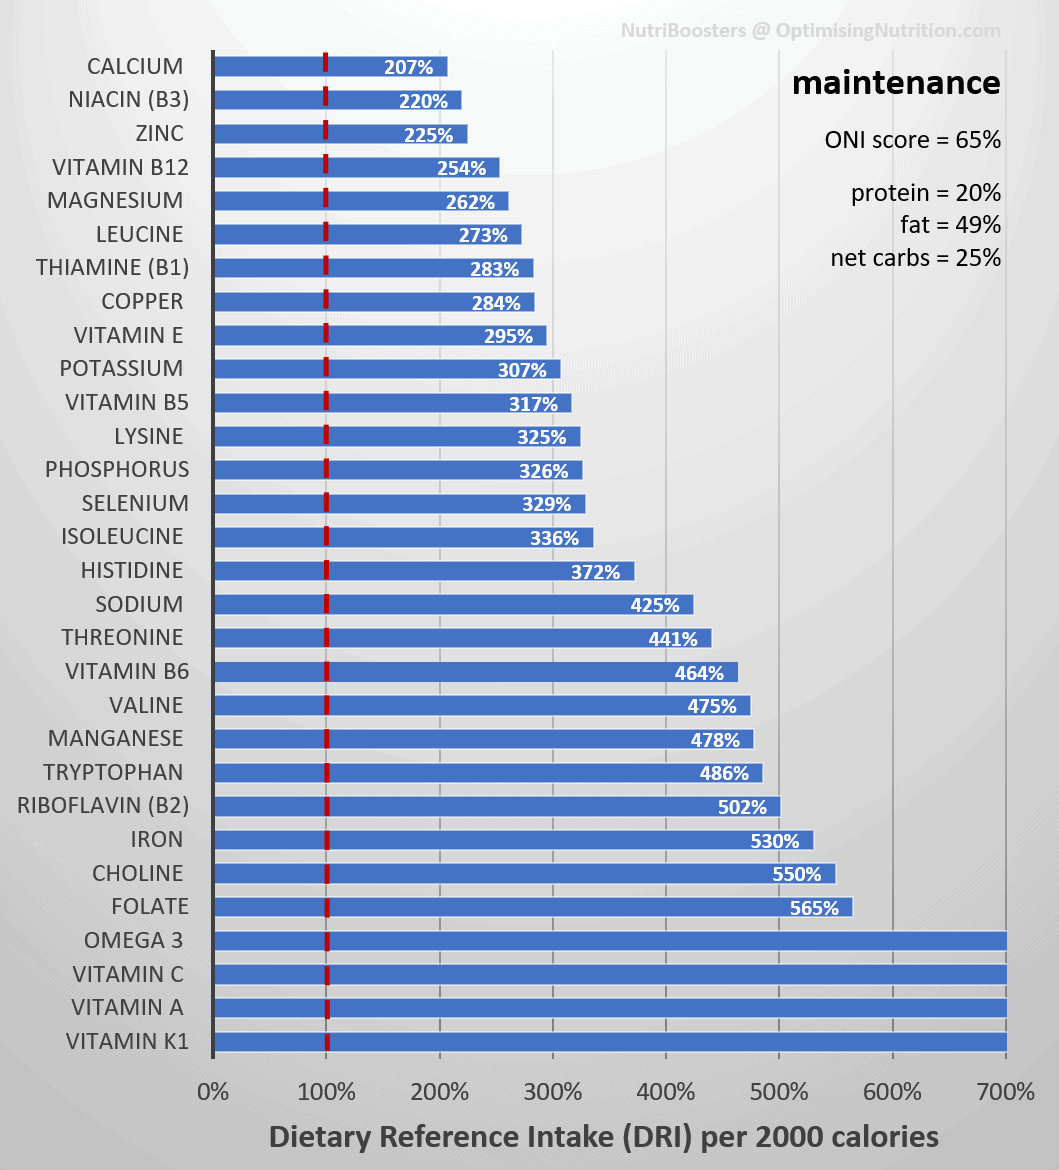
| Maintenance | Designed to help you maintain your body weight and provide plenty of nutrients to live a healthy and energised life | W:H < 0.5 | DRI | ONI |
| Bodybuilders | Gain muscle without excess body fat | W:H < 0.5 | DRI | ONI |
| Athletes & bulking | Designed to support activity or growth with an eye on nutrient density | W:H < 0.5 | DRI | ONI |
The Other Books
The table below lists the remaining books tailored for different preferences and goals. We have worked hard to create the best version of these dietary approaches based on science, preferences, and particular conditions. Each suite of recipes is optimised for nutrient density as much as possible while still aligning with each goal.
| Goal | Appropriate for | DRI | ONI |
| Nutritional keto | Ideal for someone who enjoys a ketogenic way of eating but does not require therapeutic ketone levels | DRI | ONI |
| Therapeutic keto | Designed for people who require therapeutic ketone levels (e.g., epilepsy, dementia, or Parkinson’s) | DRI | ONI |
| Plant-based | These are the most nutrient-dense plant-based recipes available. | DRI | ONI |
| Vegetarian | These are the most nutrient-dense vegetarian meals. | DRI | ONI |
| Low carb vegetarian | Nutrient-dense low-carb vegetarian meals to help stabilise blood sugars | DRI | ONI |
| Pescatarian | These are the most nutrient-dense pescatarian recipes (i.e., vegetarian plus seafood) | DRI | ONI |
| Egg-free | The most nutrient-dense egg-free meals | DRI | ONI |
| Dairy-free | The most nutrient-dense dairy-free meals | DRI | ONI |
| Egg & dairy-free | The most nutrient-dense meals without eggs or dairy | DRI | ONI |
| Meat | These are the most nutrient-dense meals that contain meat (i.e., beef, pork, chicken, etc., without seafood). | DRI | ONI |
| Immunity | These recipes prioritise the nutrients that support healthy immune function (i.e., vitamins A, C, and D, iron, selenium, zinc, and potassium). | DRI | ONI |
| Cancer (weight loss & nutrient density) | Designed for someone with cancer (i.e., less glutamic acid and methionine) while maximising nutrient density and satiety to promote fat loss | DRI | ONI |
| Cancer (weight maintenance) | Designed for someone with cancer (i.e., less glutamic acid and methionine) while providing enough energy to maintain a healthy weight | DRI | ONI |
| Cancer (weight gain) | Designed for someone with cancer (i.e., less glutamic acid and methionine) while providing plenty of energy to support weight gain after cancer treatment | DRI | ONI |
How Can I Calculate My Nutrient Intake?
If you’re interested in checking if you’re getting just enough dietary phosphorus, you can check your nutrient profile using our Free 7-Day Nutrient Clarity Challenge.
After a week of tracking your current diet in Cronometer, Nutrient Optimiser will give you a prioritised list of foods and NutriBooster recipes that will help you plug your current nutritional gaps.
Level Up Your Nutrient Density
To help you level up your nutrient density, we’ve prepared a Nutritional Optimisation Starter Pack to ensure you are getting plenty of all the essential nutrients from the food you eat every day.
The free starter pack includes:
- Maximum Nutrient Density Food List
- Sample Maximum Nutrient Density Recipe Book
- Sample Maximum Nutrient Density Meal Plan.
To get started today, all you have to do is join our new Optimising Nutrition Group here.
Once you join, you will find the Nutritional Optimisation starter pack in the discovery section here.