Dive into the transformative world of the Protein to Energy (P:E) ratio, a concept popularized by Dr. Ted Naiman, that offers a straightforward lens to view your food in terms of protein versus calories.
This guide unveils how the P:E ratio and the PE Diet can become powerful tools in your nutritional arsenal, aiding in smarter food choices and enhancing satiety.
Whether you’re on a quest for weight loss or simply aspiring for a nutrient-dense diet, understanding the dynamics of the protein to energy ratio is a step towards a more informed and healthier food regimen.
- What Is the Protein:Energy Ratio?
- What Is a Typical P:E Ratio?
- Will a Higher P:E Ratio Help Me Lose Weight?
- P:E Ratio and Diet Quality
- What is Protein %, and How Is It Different from the P:E Ratio?
- Protein % and Satiety
- Protein and Nutrient Density
- Top-Down vs Bottom-Up Nutrition
- Nutrients vs Energy: A New and Better Way
- High Protein:Energy Foods
- High Nutrients:Energy Foods
- High Nutrient:Energy Meals and Recipes
What Is the Protein:Energy Ratio?
The P:E ratio is a simple way to see how much energy your food provides relative to protein.
A food or meal’s P:E ratio is calculated by dividing its protein (in grams) by the total energy from fat and non-fibre carbs (in grams). Because it keeps everything in grams, it’s simpler than protein %, which requires additional calculation.
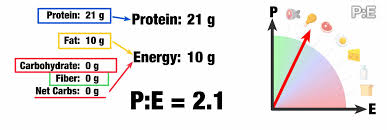
If you don’t feel like doing these calculations in your head, you can use Ted’s P:E calculator here.
Because it keeps everything in grams, it’s simpler than protein %, which requires additional calculation.
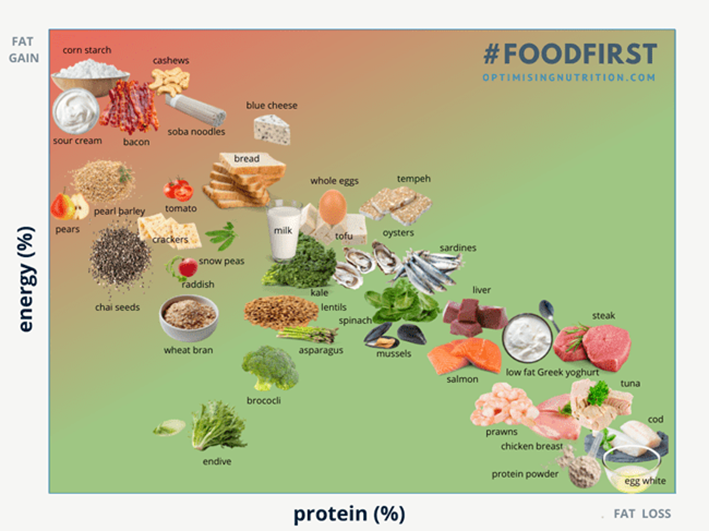
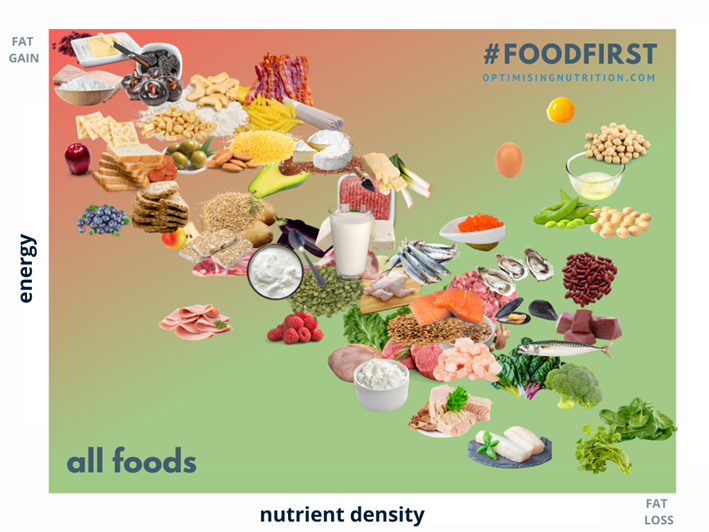
The graphic below shows that foods with a low P:E have more energy from fat and carbs and minimal protein or fibre. These foods can lead to easy fat gain because they are easy to overeat!
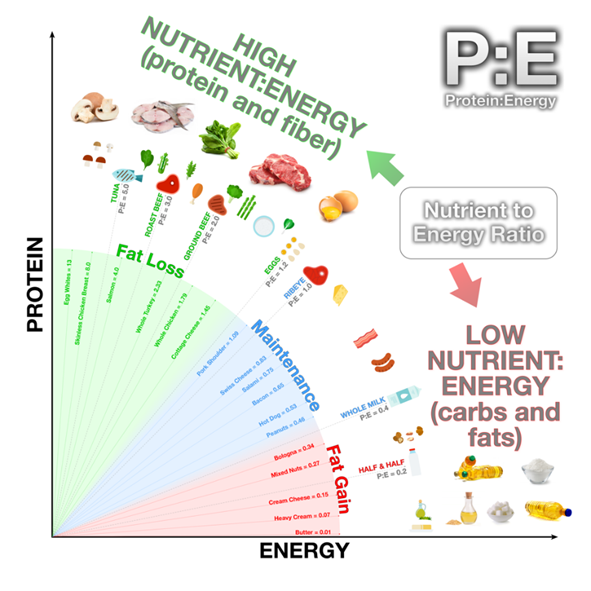
Meanwhile, foods with a higher P:E ratio provide more protein and less energy from fat and carbs. Because protein plays a role in satiety, these foods are difficult to overeat and more satiating per calorie.
The P:E ratio is ideal if you’re at the shops and want to evaluate whether or not a specific food suits your goals and preferences. You can simply whip out your phone, plug the macros into Ted’s calculator and judge whether or not the selected food aligns with your goals.
What Is a Typical P:E Ratio?
But what P:E ratio should you aim for?
To help you understand what different P:E ratios are optimal for various goals, the chart below shows the distribution of P:E from 125,761 days of data from 34,519 Nutrient Optimiser users.
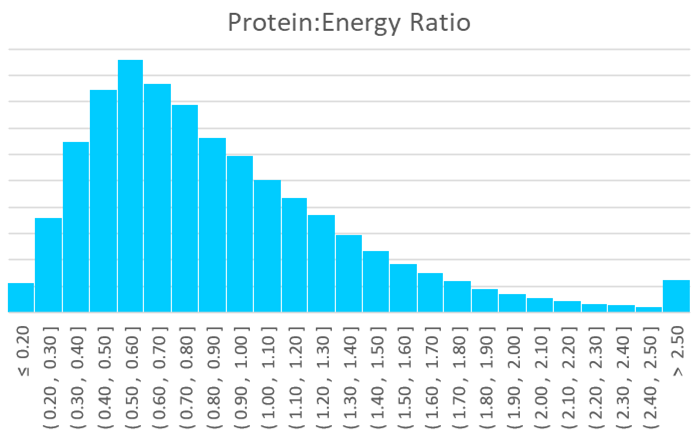
Keep in mind that our Optimisers are already more protein-centric than the general population, with an average protein percentage (protein %) of 30%. In contrast, the general population consumes around 13% of their total calories from protein.
From this chart, we can see:
- The average P:E ratio of all of our Optimisers is 0.9.
- On the far right, we see that few people manage to maintain a P:E above 2.5.
- On the far left, we see that the majority consume more than 0.2.
- The 85th percentile P:E is 1.4. Thus, you could aim for a P:E of 1.5 as a reasonable stretch target to maximise satiety so you can lose weight.
Will a Higher P:E Ratio Help Me Lose Weight?
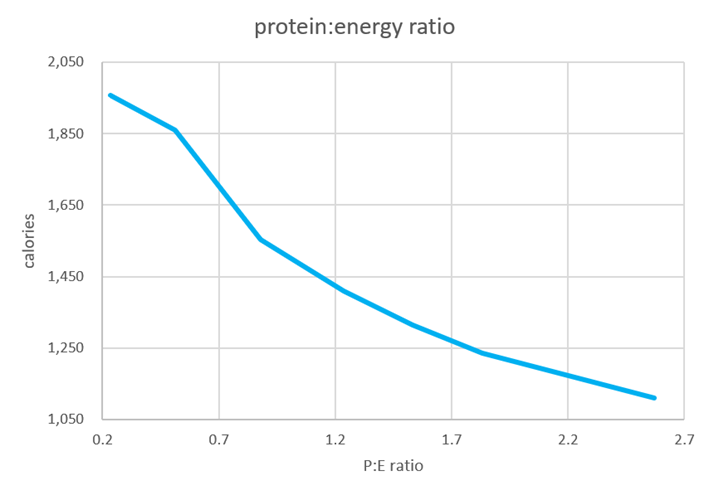
In line with the Protein Leverage Hypothesis, the chart below shows that people eating foods and meals with the highest P:E ratio consume an average of 45% fewer calories than those with the lowest P:E ratio.
P:E Ratio and Diet Quality
A higher P:E ratio aligns with a higher Diet Quality Score. The Diet Quality Score measures how well a food or meal hits all your daily essential micronutrient intakes. If your goal is diet quality, there isn’t much additional benefit in exceeding a P:E ratio of 1.9.

Aiming for a very high protein % tends to push us toward a diet centred around very high-protein foods like egg white, cod, protein powder, chicken breast, and tuna.
Meanwhile, nutrient-dense, non-starchy vegetables tend to get left out of the picture despite perfectly complementing the micronutrient profile of foods with a high protein %. These foods ‘fill in the gaps’ and provide some harder-to-find nutrients that animal-based foods and seafood tend to lack.
What is Protein %, and How Is It Different from the P:E Ratio?
Simply put, protein % is the percentage of total energy from a food or meal that comes from protein.
The significant difference between protein % and the P:E ratio is that protein % considers the energy in calories. In contrast, the P:E ratio is based on the weight of food in grams.
Fat provides nine calories per gram, while protein and carbs each provide four calories per gram. Because protein % is based on calories and not grams, protein % penalises fat a little more than the P:E ratio.
So protein % may be ideal for people who are targeting weight loss as opposed to those lowering their carb intake to stabilise blood sugars. The downside of protein % is that it takes a bit more effort to calculate. However, you can quickly extract this information from an app like Cronometer without much work.
Protein % and Satiety
But how does protein % stack up vs P:E regarding satiety and nutrient density?
The chart below shows that an increasing protein % aligns with greater satiety.
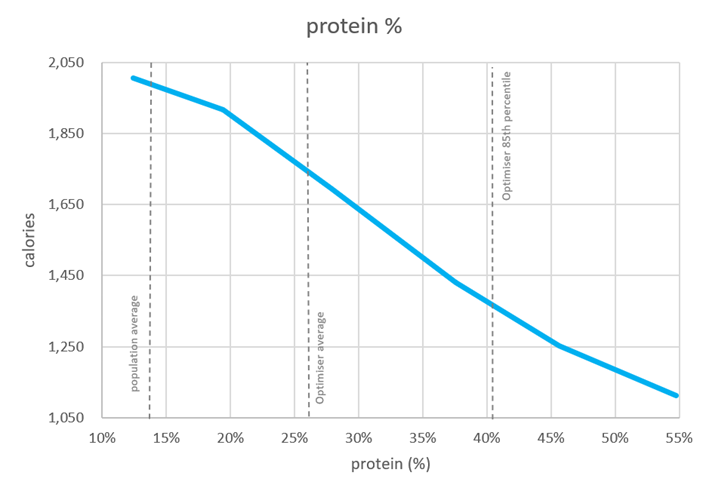
Compared to P:E, people consuming foods with the highest protein % ate 55% fewer calories than those consuming the lowest. This is more than the 45% difference in calories for P:E. Hence, protein % appears to be a better metric to maximise satiety when losing weight.
Whilst you may be tempted to reach for the stars on day one, hop into super-rapid fat loss, and jump into a maxed-out protein %, we don’t recommend this approach. Too much change too quickly can shock the body and lead to rebound binges, and we recommend gradually working your way up to a higher P:E ratio over time.
We discuss why this is in more detail in our PSMF article. Nonetheless, we have created a high P:E NutriBooster recipe book for people who want to lose fat quickly.
However, for everyone else, one of the other NutriBooster recipe books (e.g. Fat Loss or Maximum Nutrient Density) may be more appropriate for sustainable long-term fat loss.

In our Macros Masterclass, we find people experience the best results when they determine their start point and work towards 40% protein by dialling back energy from fat and non-fibre carbs.
Protein and Nutrient Density
The chart below shows protein % vs diet quality. In general, a higher protein % aligns with improved diet quality.

In terms of nutrient density, there is little benefit in exceeding 50% protein. Like satiety and calorie intake, protein % is a more accurate litmus of nutrient density.
Top-Down vs Bottom-Up Nutrition
I really like Ted Naiman’s recent image showing the various factors that affect satiety per calorie.
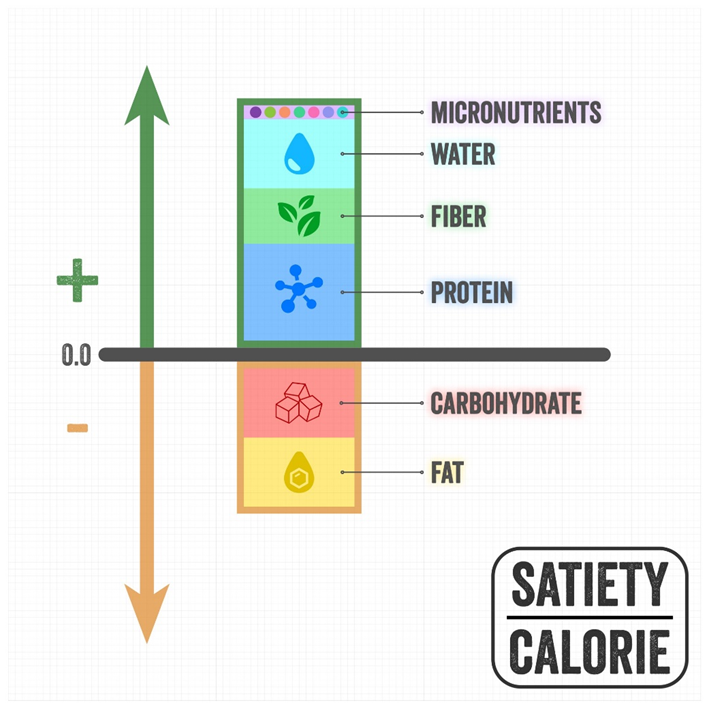
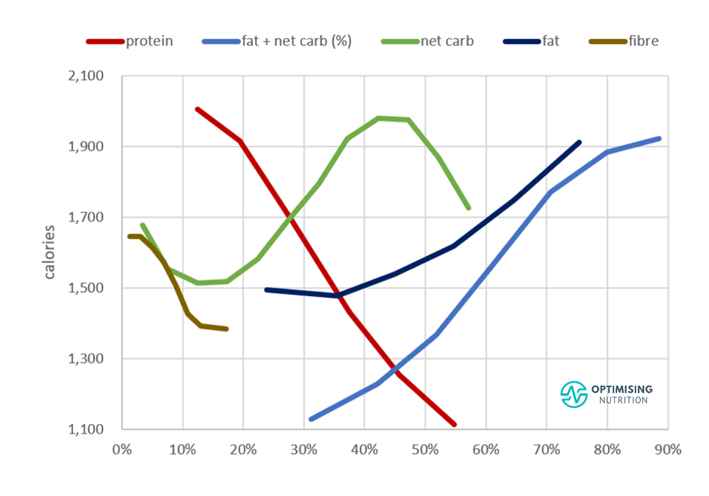
This graphic aligns with our quantitative analysis of the Optimiser data shown in the chart below. Based on our research, fat and non-fibre carbs provide energy in our diet that negatively influences satiety per calorie. In contrast, more fibre and a higher protein % positively impact satiety.
If you want to take a simple, bottom-to-top approach to optimise your diet, you can start by focusing on your macronutrients (i.e. fat, protein, and carbs). This approach gets people to consume more protein, which typically comes packaged with other micronutrients. We take a similar approach in our Macros Masterclass.
While macros are foundational, micronutrients—or vitamins, minerals, essential fatty acids, and amino acids—can be seen as the ‘icing on the cake’ to fine-tuning your diet and smashing your cravings. If you take a top-down approach to your nutrition and start with micronutrients as we do in our Micros Masterclass, you end up at a similar place.
As the chart below shows, foods providing the most nutrients per calorie also have a macro profile that aligns with maximum satiety.
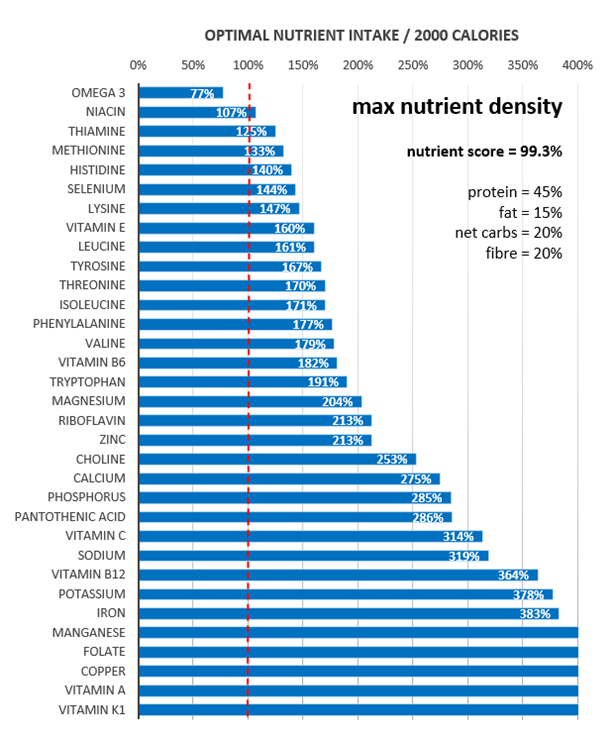
Isn’t it nice when everything aligns into one big, cohesive whole?
Nutrients vs Energy: A New and Better Way
Ted Naiman would be the first to admit that P:E is just a simple, shorthand way to get people started consuming more nutrients per calorie.
If we start by prioritising all the micronutrients per calorie—and not just the amino acids that make up protein—we end up with a very satiating macronutrient profile. The chart below shows that non-starchy vegetables move towards the front of the pack when our focus is on nutrients per calorie.
While you may not be able to consume (or want!) many of these plant-based foods, they are very nutritious and satiating on a calorie-for-calorie basis. Once you’ve had your fill of these nutritious plant-based foods, you can fill up on seafood and animal-based foods to get the protein and calories you need to survive.
High Protein:Energy Foods
If you’re looking for foods with a higher protein %, check out the illustration below or our interactive Tableau version of the same chart here. Foods with a higher nutrient density are shown in green, and those in red are less nutrient-dense.
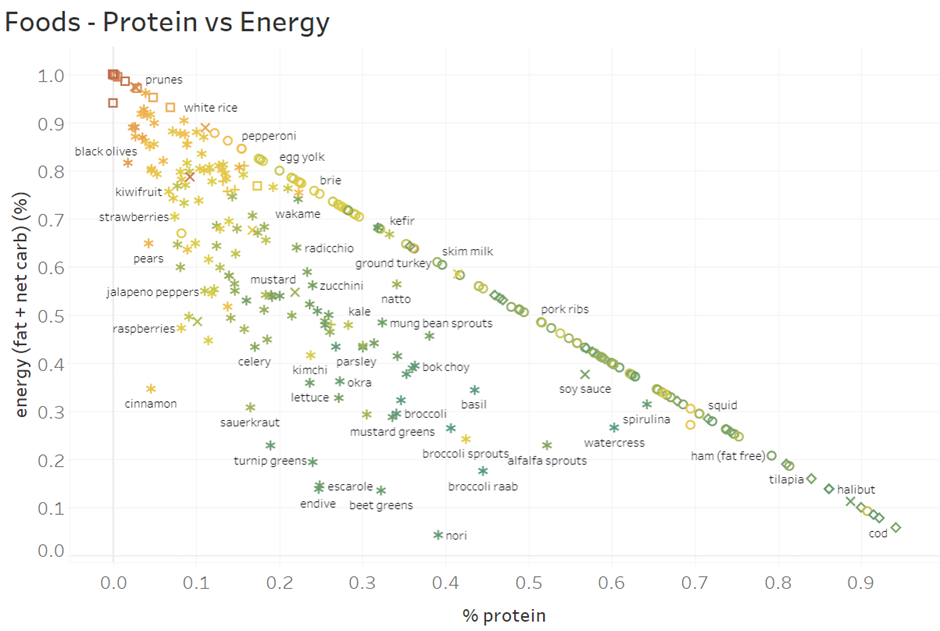
While many foods lie on the diagonal axis, the ones sitting below it contain some fibre. This means less energy is available.
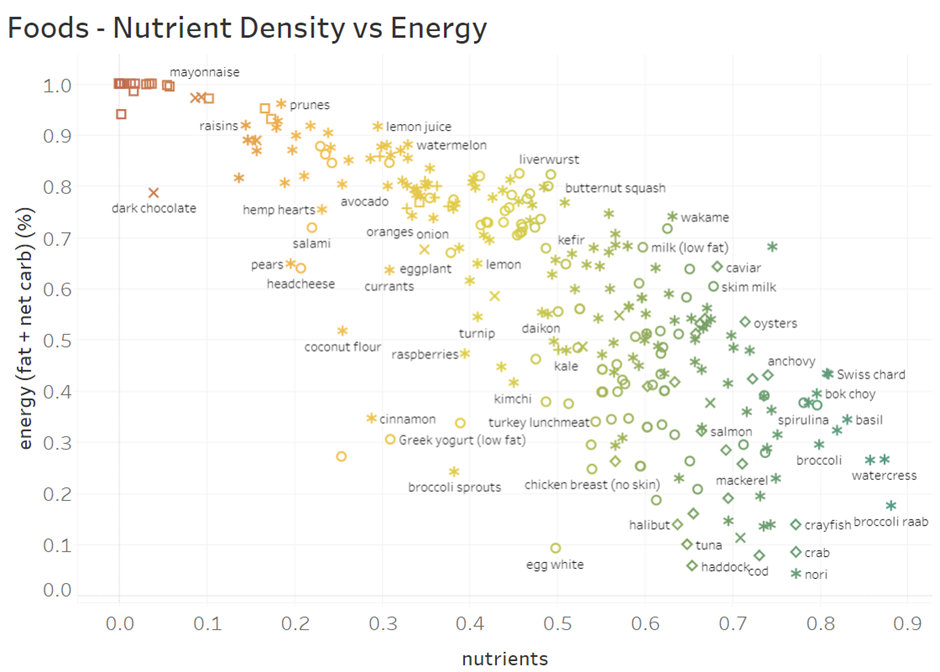
High Nutrients:Energy Foods
To take things to the next level, the following chart shows popular foods plotted on the landscape of nutrients vs energy. You can check out the interactive Tableau version of this chart here to see the details a bit more clearly.
We’ll be the first to admit that maximum nutrient density isn’t ideal for everyone, and you need to consider your context and goals. To help you with that, we developed a wide range of nutrient-focussed food lists tailored to different goals and preferences.

No matter where you’re at on your journey to Nutritional Optimisation, you must determine where you’re starting from. You can find out which nutrients your current diet lacks using our free 7-day Nutrient Clarity Challenge. Once you’ve logged your current diet for a week, it will recommend some foods and meals that will ‘fill in the gaps’ and provide you with the nutrients you’re not getting enough of.
High Nutrient:Energy Meals and Recipes
We also have our NutriBooster recipes, which we created to provide you with the complete spectrum of nutrients you require in one place.

If you prefer thinking in terms of P:E ratios, the chart below shows how each of our 600 NutriBooster recipes sits on the protein vs energy landscape. Again, you can explore all the details of this same chart for yourself in the interactive Tableau version here.

To help you level up your nutrition, you can see the recipes displayed on the nutrients vs energy landscape and the interactive Tableau version of that chart here.
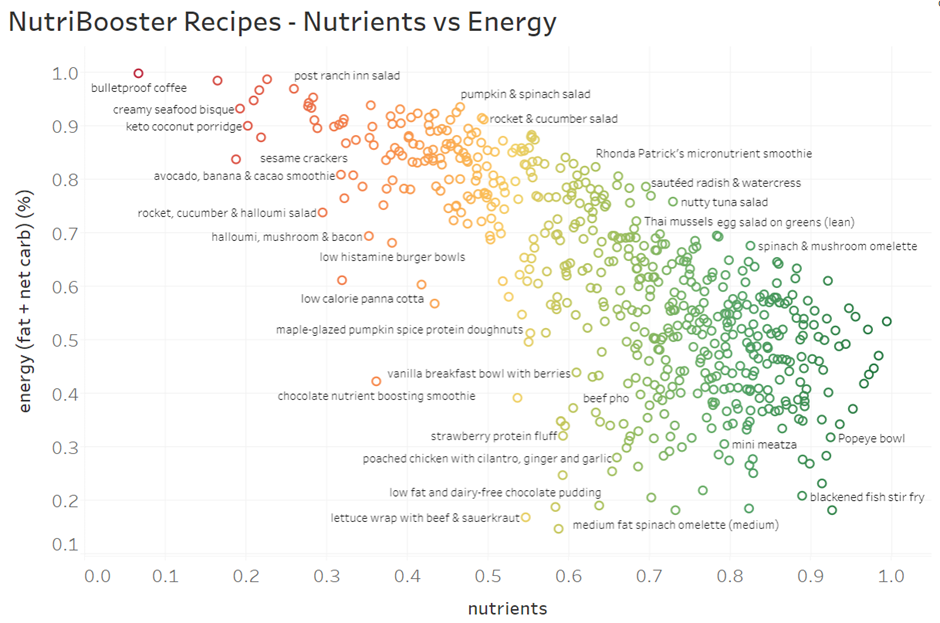
We’ve embedded all of these NutriBooster recipes into Nutrient Optimiser so the software can recommend them when you’re lacking some of the micronutrients it provides. Thus. These recipes have been invaluable in our Macros Masterclass and Micros Masterclass to move their nutrition game to the next level.
For more details on these recipes, check out Nutrient-Dense Meals and Recipes.
If you see a recipe you might like in the charts above, you can search for it on Google. Just add ‘Optimising Nutrition’ + recipe name.
Summary
To summarise the pros and cons of P:E vs protein %:
Protein:Energy
Pros
- P:E uses grams rather than calories to make it easier.
Cons
- P:E doesn’t align with satiety and nutrient density as well as protein % does.
Protein %
Pros
- Protein % considers energy from fat more accurately.
- Protein % aligns better with nutrient density and satiety.
Cons
- Protein % requires a slightly more complex calculation.
While P:E or protein % are exciting, simply thinking about your diet in terms of nutrients can help you maximise satiety while getting all the nutrients you need to thrive simultaneously.