

Q: Why do we eat?
A: To get the balance of nutrients and energy we require.
Q: What nutrients do we crave?
A: Protein and minerals like sodium, potassium and calcium.
Q: How can we reverse-engineer our food choices to satisfy our cravings without overeating?
A: By ensuring we get enough of the protein and nutrients we require in our daily energy budget.
Nutrition is fascinating and multidimensional. Various groups have their favourite good/bad things that they like to prioritise/avoid in food, like:
- carbs,
- fat,
- sugar,
- fructose,
- saturated fat,
- polyunsaturated fats,
- plant-based foods, or
- animal-based foods, etc.
But we can’t prioritise everything at the same time. If everything is a priority, nothing is a priority. Meanwhile, if we avoided everything that someone online said was ‘bad’ there would be nothing left to eat!
So, to optimise our nutrition to reach our goal, we need to identify the most critical factors in our complex food matrix.
Previously we have used multivariate analysis (MVA) to identify the most statistically significant parameters that align with eating less vs eating more. You can learn more about this in our mega article, The Food Satiety Index Score.
To build on this, in this article, we use Principal Component Analysis (PCA) to analyse forty thousand days of food logging data from forty thousand Optimiser to identify the most important parameters in the food you eat and understand how they are clustered in the food we eat.
What is Principal Component Analysis?
Principal Component Analysis (PCA) is a statistical analysis technique often used in machine learning and artificial intelligence to reduce complex datasets to the most significant variables.
We can also use PCA to:
- identify the critical nutrients in our food that align with satiety and eating less vs eating more,
- see how various nutrients are clustered together in various foods and eating patterns, and
- weed out the less important factors that we don’t need to worry as much about.
Special thanks to Julia Kreye for running the PCA analysis. Julia is an evolutionary biologist at the Max Planck Institute and an active member of our Optimising Nutrition Community.
Macronutrients
The best way to explain how principal component analysis (PCA) works is to dive into some results.
Ready?
To start at the highest level, the figure below shows the PCA results when we only consider the macronutrients (i.e., protein, carbs, fat and fibre).
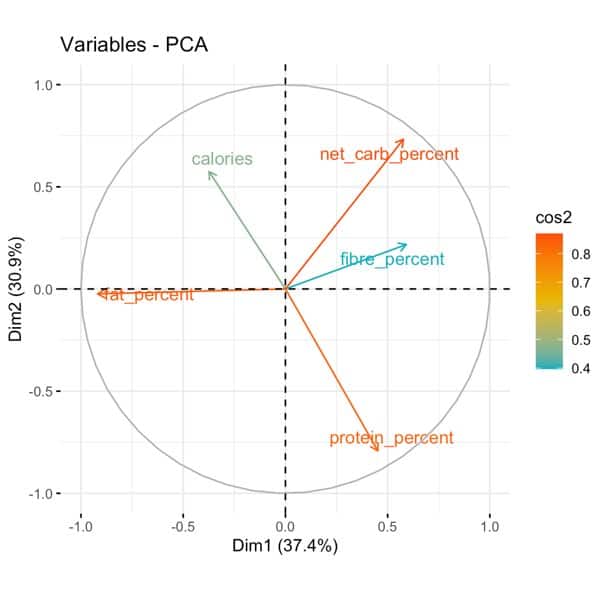
- Each vector represents a macronutrient.
- The longer lines explain more of the variability in the data. Protein % is the most dominant factor that is diametrically opposed to calories. This aligns with our understanding of protein leverage (i.e. a higher protein % aligns with a lower calorie intake).
- Fibre is aligned with carbohydrates but has a shorter vector suggesting that it explains less of the variability in the dataset.
The table below shows the results from our multivariate analysis of the same dataset. We see that protein and fibre align with consuming fewer calories, with protein being dominant. Because a higher fat % and net carb % both align with eating more, they’ve been eliminated from the MVA.
| Nutrient | Low | High | % |
| Protein (%) | 19% | 44% | -35% |
| Fibre (g/2000 cal) | 11 | 44 | -8% |
To explain the analysis:
- moving from low (19%) to high protein (44%) aligns with a 35% reduction in calories, while
- increasing fibre aligns with a smaller 8% reduction in energy intake.
So, if we only consider the macronutrients, ensuring your diet has a higher protein % is the most crucial factor, with fibre coming in second. Meanwhile, increasing fat and carbs aligns with eating more, particularly when combined.
This high-level analysis also suggests that plant-based foods (which contain more fibre) complement meat and seafood (which tend to contain more protein).
Note: This analysis represents 137,967 days of data from our Optimisers, so it is the simplest and most robust way of looking at the data. Unfortunately, we don’t have complete data for all the nutrients of interest, so we have used subsets of data in the other analysis scenarios below.
Dominant Satiety Factors (with Cholesterol)
If we want to move beyond the macronutrients, the PCA and MVA allow us to dig deeper to understand the other statistically significant parameters in the satiety equation.
Our previous multivariate analysis showed that, beyond the macronutrients, we also appear to have statistically significant cravings for other essential nutrients. Or at least getting more of each of them from our food (per calorie) aligns with eating less.
The table below shows the results of the multivariate analysis when we include cholesterol (n = 38,556 days of data) along with other nutrients that have a statistically significant relationship with eating less.
| Nutrient | Low | High | % |
| Protein (%) | 19% | 44% | -21% |
| Cholesterol (g/2000 cal) | 0.2 | 1.1 | -12% |
| Fibre (g/2000 cal) | 11 | 44 | -9% |
| Potassium (g/2000 cal) | 1.9 | 5.9 | -6% |
| Sodium (g/2000 cal) | 1.5 | 5.1 | -5% |
| Calcium (g/2000 cal) | 0.5 | 1.9 | -4% |
While protein % still dominates the satiety equation, getting more cholesterol, fibre, potassium, sodium and calcium per calorie, all align with eating less. To dig into the results of the MVA, the PCA plot of this dataset is shown below.

The PCA analysis aligns with the MVA but provides more detail to help us understand how the nutrients are clustered.
While protein remains dominant, its satiety impact diminished (i.e., shorter line than in the figure above) when we consider the other nutrients.
The sodium vector aligns with protein, meaning protein and sodium tend to be clustered in the same foods and dietary patterns. So, if you’re getting adequate protein, you’ll typically get plenty of sodium.
Towards the right of the PCA chart, we see cholesterol as a separate vector with a similar length to fibre. Besides protein leverage, it seems we may have cravings for dietary cholesterol. So, while you may not necessarily want to go out of your way to prioritise cholesterol, intentionally avoiding cholesterol in otherwise nutrient-dense foods, like liver and eggs, may not be wise.
Like potassium and calcium, the foods and recipes containing more cholesterol don’t necessarily have the highest protein %. For more on cholesterol, see Dietary Cholesterol and Blood Cholesterol: Are They Related? and Cholesterol: When to Worry and What to Do About It.
Towards the top left of the PCA results, we see that calcium and potassium clustered together but separated from protein and sodium, indicating that they are contained in different foods.
Meat and seafood tend to contain more sodium and protein, while plant-based foods contain more potassium and calcium. Therefore, once you get adequate protein from meat and seafood, it appears to be helpful to prioritise foods that contain more potassium and calcium, which are more prevalent in plant-based foods.
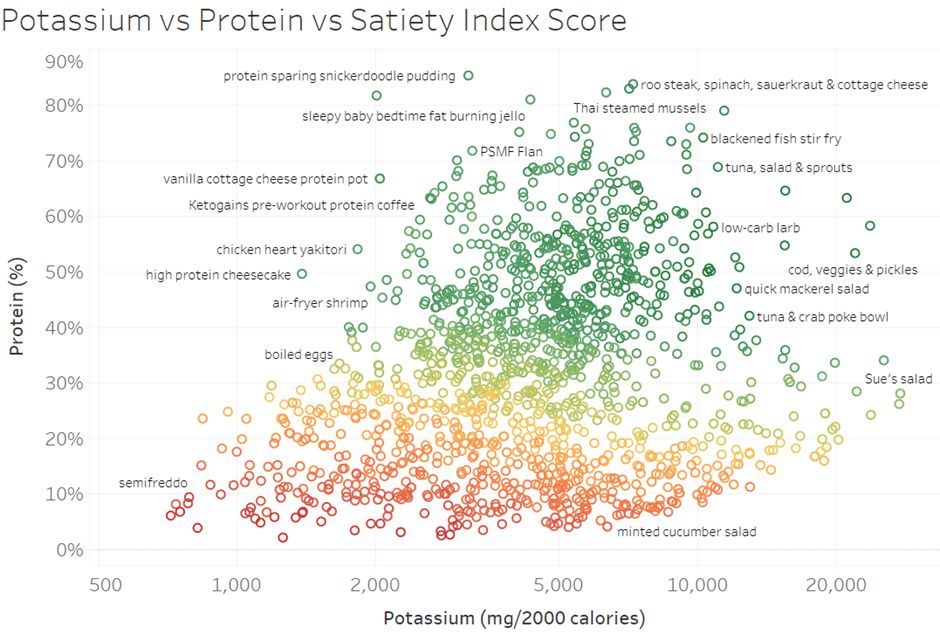
To illustrate this, the charts below show potassium and calcium vs protein % vs satiety scores for the NutriBooster recipes we use in our programs. Note how the recipes containing the most potassium and calcium per calorie (e.g., green salads) towards the far right are not necessarily the highest protein. While protein % may the dominant factor for most people, it’s not the only factor worth considering.

It’s worth noting that the PCA and MVA represent the average of one hundred and forty thousand days of data from forty thousand people who have used Nutrient Optimiser over the past five years. While this analysis will be robust for this population, the nutrients that create greater satiety at an individual level will vary depending on your baseline dietary pattern. For example, people on a plant-based diet may benefit from initially working to increase their protein %.
To illustrate, the chart below shows a range of popular foods in terms of protein (g/serve) vs protein (%). The colouring is based on our Satiety Index Score. While some plant-based foods have a high protein % (e.g., watercress, broccoli and spinach), we typically don’t eat these in large enough quantities to get a significant amount of protein. However, it’s much easier to get protein from meat and seafood in the quantities that we typically eat these foods.

Meanwhile, people on a carnivore diet may benefit from foods that provide more potassium, calcium, and other nutrients that can be harder to get from meat and seafood alone.
Energy Containing Nutrients
Depending on their preferences and beliefs about food, many people try to avoid specific energy-containing nutrients, like:
- sugar,
- starch,
- saturated fat,
- monounsaturated fat, or
- omega-6.
As shown in the table below, the MVA with only these nutrients shows that eating more sugar, starch, saturated fat, and monounsaturated fat aligns with eating more. Omega-6 polyunsaturated fats comprise a small diet component, so they’re not statistically significant in the MVA analysis.
| Nutrient | Low | High | % |
| Sugar (g/2000 cal) | 11 | 71 | 6.7% |
| Sat Fat (g/2000 cal) | 20 | 61 | 16% |
| Starch (g/2000 cal) | 0.8 | 48 | 11% |
| Mono Fat (g/2000 cal) | 16 | 53 | 13% |
The better understand the MVA results, the figure below shows the PCA results for this dataset (n = 34,611 days of data).
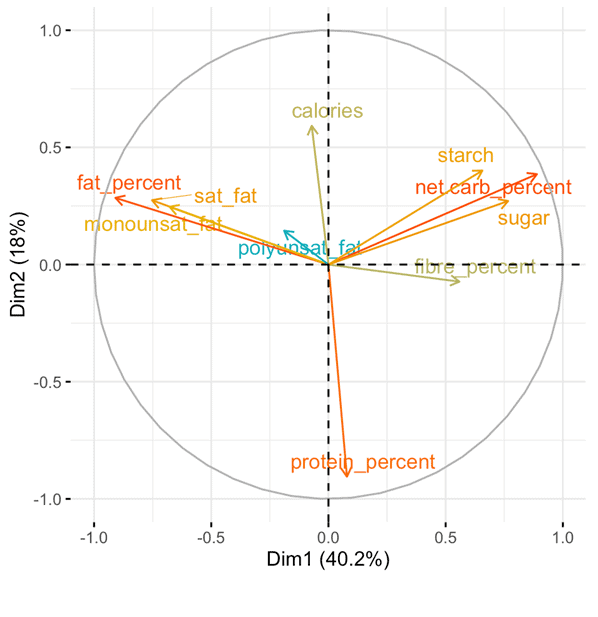
To the right of the chart, we see that sugar and starch are less dominant than net carbs. Similarly, to the right, we see that monounsaturated, saturated, polyunsaturated, and saturated fat are less dominant than fat %.
While these energy-containing nutrients are often combined to create ultra-processed foods, we don’t need to worry too much about our intake of each of them if we manage our overall energy intake from fat and carbs. For more detail, see Ultra-Processed Foods: What’s the Problem and How to Avoid Them.
In our Macros Masterclass, we guide Optimisers to dial in their balance of protein vs energy from fat and carbs. Later, when they’re ready to level up their nutrition, our Micros Masterclass, we guide Optimisers to get more of the essential nutrients while keeping within their energy budget.
With this approach, we don’t need to worry about limiting ‘bad things’ in food – they become irrelevant once you get plenty of the good things while managing your overall energy intake. Unfortunately, focusing on avoiding ‘bad things’ in food leads to a lower nutrient density and satiety outcome. Once you prioritise more optimal foods that contain the essential nutrients you need, you don’t need to worry about avoiding ‘bad’.
Micronutrients
The chart below shows the PCA results when we add some of the micronutrients that tend to have a statistically significant relationship with eating less (n = 95,184 days of data) in the MVA analysis (e.g., selenium, folate and vitamin B5).

Again, fat and non-fibre carbs align with a higher calorie intake. But things get more interesting towards the lower right. Getting more of many of the essential nutrients per calorie seems to align with consuming fewer calories.
But it’s fascinating to see that when we consider more nutrients, the leverage effect of protein diminishes, and potassium comes to the fore. Notice how the potassium line to the right is longer than all the other essential nutrients, including protein. Potassium is clustered with calcium and folate.
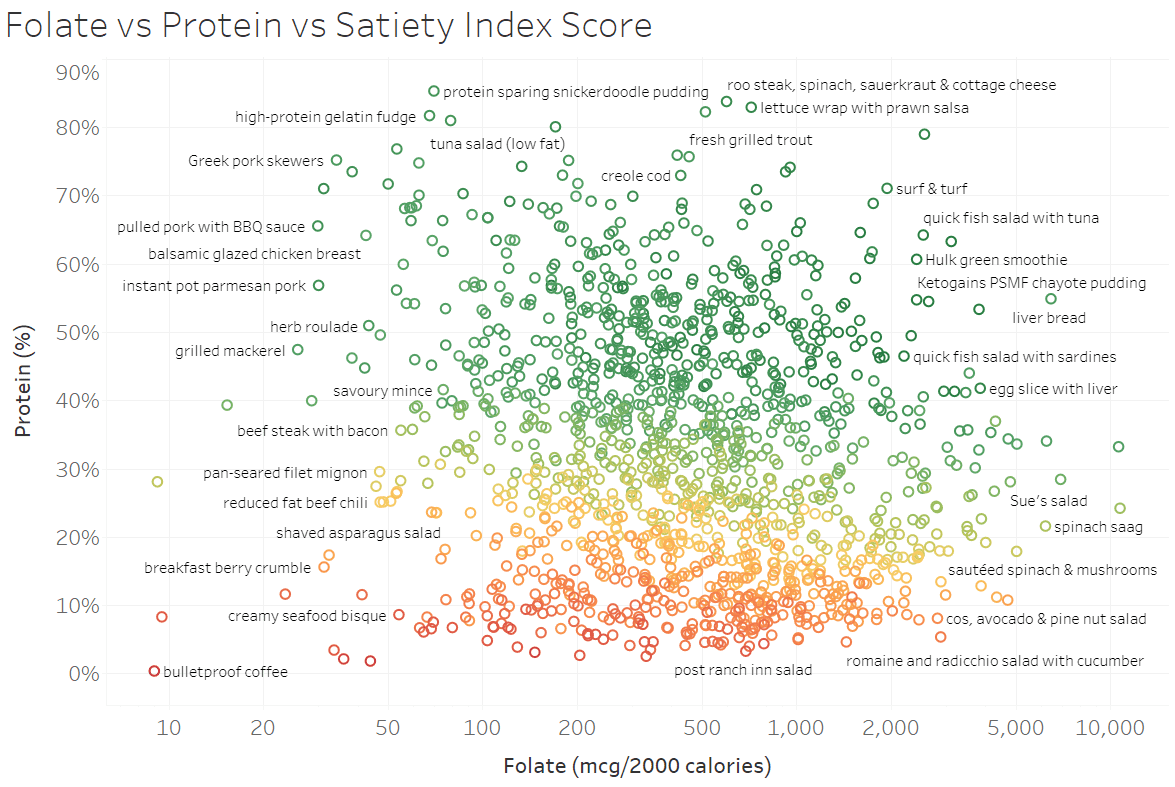
When we look at the NutriBooster recipe that contain more folate (to the right of the chart below), we see that recipes that it’s the recipes that contain either liver or non-starchy green vegetables towards the right.
We Can’t Hack Satiety with Supplements
If we look at the MVA, we may be tempted to think we can use a few supplements to hack satiety. But when we look at the PCA, we realise that eating less satiety aligns with nutrient-dense foods that naturally contain more essential nutrients, particularly the minerals that aren’t typically used in supplements or fortification.
Again, we can achieve this most efficiently with a mix of meat, seafood and non-starchy vegetables. We can start by building the foundation of our diet with foods and meals that provide protein and enough energy (shown towards the top of the chart below). We can then fill in the harder-to-find nutrients with non-starchy vegetables (e.g., the foods that provide more nutrients per calorie towards the right of the chart below).
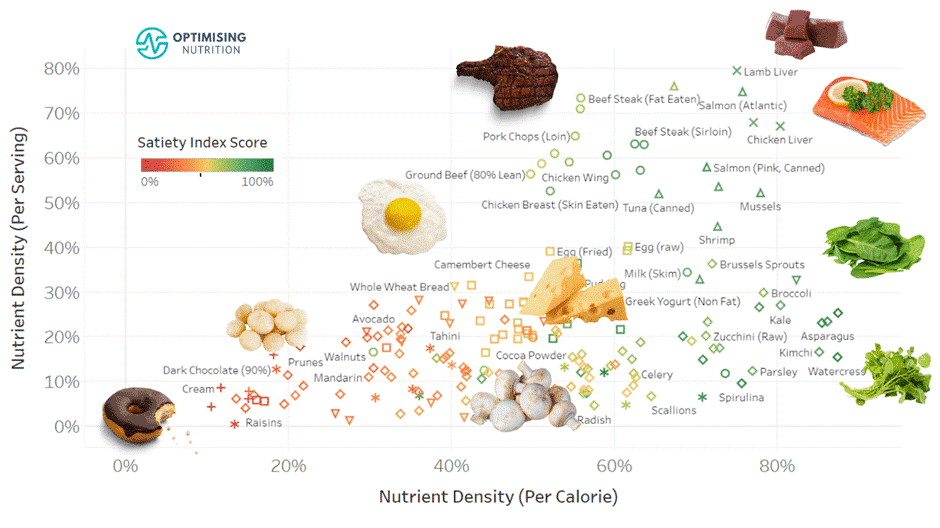
For more details on this chart, see One Nutrient Density and Satiety Chart to Rule Them All.
Why is Potassium such a Big Deal?
Along with protein and fibre, potassium continues to show up as a dominant factor in the satiety equation.
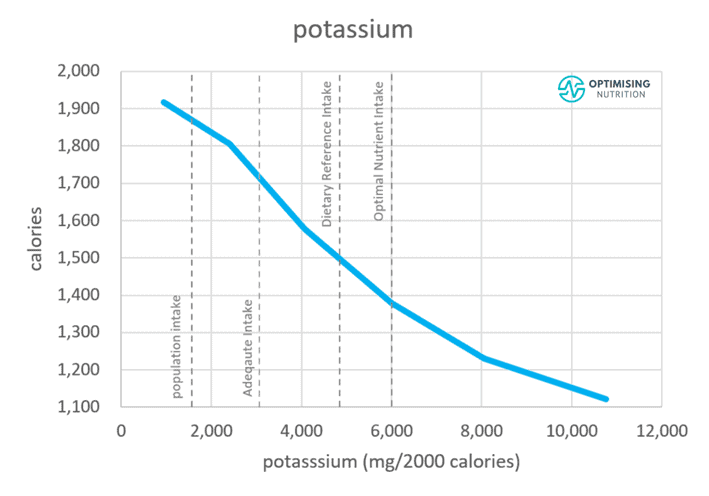
As shown in the satiety chart below, Optimisers who consume more potassium per calorie tend to eat about half as much as those who consume the least potassium. Concerningly, the average population intake aligns with pretty much the highest overall calorie intake.
But why is potassium such a big deal? The short answer is that we don’t know exactly, but there are a few possible theories that may all be at play.
Potassium has Declined in our Food System
As shown in the chart below, the potassium available in our food system has declined since we started ramping up synthetic fertiliser use in the 1940s. We now have to eat 33% more to get the same amount of potassium as in the 1940s. Unfortunately, it’s also estimated that 98% of Americans do not meet the minimum DRI for potassium. Hence, potassium is a nutrient of public health concern.

Potassium is Not Used in Supplements and Fortification
Potassium is a mineral we require in larger quantities than micro minerals and vitamins. Hence, it’s bulkier and more expensive, so it isn’t used in multivitamins and the fortification of bread and cereals.
Furthermore, because some blood pressure medications help your kidneys retain potassium, potassium supplementation can be problematic for many people on these drugs. Hence, potassium supplements are generally limited to 99 mg of potassium. You’d need to pop many pills to reach the DRI of 4800mg or our Optimal Nutrient Intake of 6000 mg/2000 calories.
The fact that potassium is rarely used in supplements also provides cleaner data for potassium, providing greater statistical significance in the MVA and PCA. If we were able to get data only from people eating foods without fortification and taking supplements, we’d likely see a higher level of statistical significance for some of the other essential nutrients.
We Have a Learned Appetite for Potassium
While we don’t have a conscious taste for appetite for potassium like we do other nutrients like sodium, calcium, protein, carbohydrates and fat, our body still needs potassium, and most of us are not getting enough.
Thus, we could have a learned appetite for potassium, associating foods containing more potassium with their benefits. Thus, we get a greater dopamine response and satisfaction from foods containing more potassium per calorie. This means we eat more of these foods when they are available, and our appetite is satisfied with fewer calories when we consume foods that provide more potassium per calorie.
Foods with More Potassium have a Lower Energy Density
It’s well-accepted that foods with a lower energy density are more satiating, especially in the short term. However, multivariate analysis tends not to show that energy density isn’t a statistically significant factor when we consider the other factors.
It’s also reasonably easy to hack energy density. Taken to its logical extreme, low-energy-density meals contain lots of added water. As a result, they are lower in protein and minerals, which satisfy our cravings and hence play a role in longer-term satiety.
So potassium may work as a surrogate for lower energy density whole foods, which is more effective than measuring energy density.
For more detail on energy density, see:
- Energy Density vs Protein % for Satiety and Weight Loss, and
- Low Energy Density Foods and Recipes: Will They Help You Feel Full with Fewer Calories?
Potassium is a Surrogate Marker for Intact Cells
In biology, potassium is often used as a surrogate marker for intact cells because it is an abundant intracellular cation predominantly located inside the cell.
When cells are disrupted, the potassium ions are released into the extracellular space, increasing the concentration in the surrounding medium. Thus, potassium levels in a sample can be measured to estimate the number of intact cells.
While potassium has declined in our food system, and we may have a learned appetite for foods that contain more, potassium may also be a surrogate marker for whole foods vs refined a-cellular ultra-processed foods.
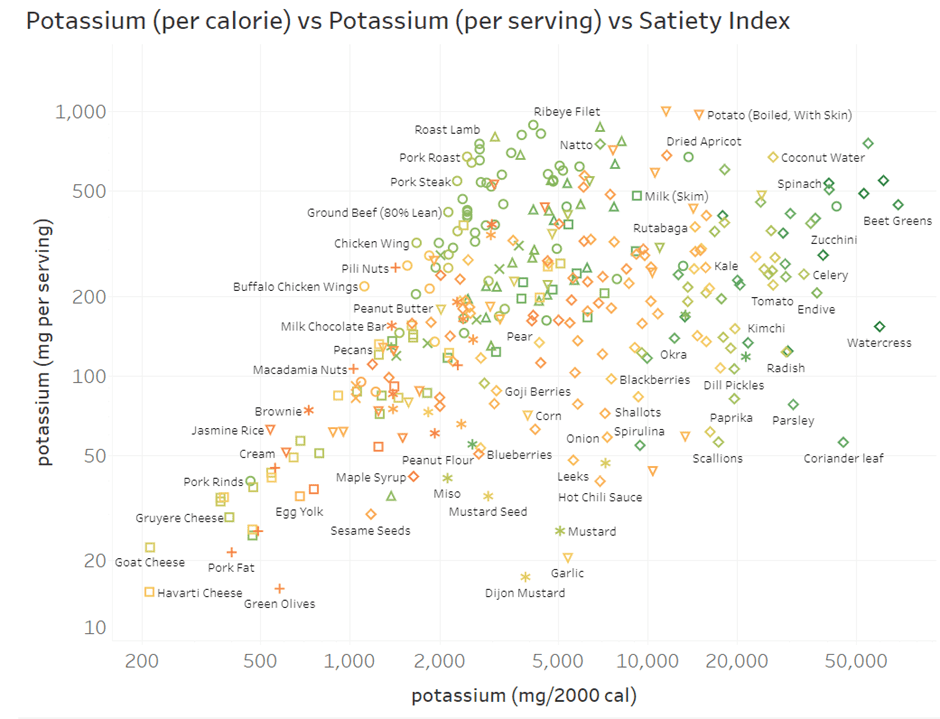
As shown towards the right of the chart below, foods that contain more potassium per calorie tend to be non-starchy green vegetables like spinach, mushrooms and watercress. However, towards the top, we see that the foods that contain more potassium per typical serving include potato, salmon, beef and turkey.
Regardless of the precise mechanism, potassium appears to be a helpful factor, along with others, to create a robust multifactorial system to identify foods that create greater satiety per calorie.
Summary
The Principal Component Analysis elucidates the Multivariate Analysis and enables us to move beyond the macronutrients to identify the nutrients that align with greater satiety. It also helps us understand how various nutrients are clustered and why some are dominant while others are not statistically significant in the multivariate analysis (shown below).
| nutrient | low | high | % |
| protein (%) | 19% | 44% | -31% |
| fibre (g/2000 cal) | 11 | 44 | -4.9% |
| potassium (mg/2000 cal) | 1931 | 5915 | -3.7% |
| sodium (mg/2000 cal) | 1480 | 5076 | -2.5% |
| calcium (mg/2000 cal) | 469 | 1869 | -2.3% |
| folate (mcg/2000 cal) | 167 | 956 | -1.4% |
At the highest level, protein % (or protein leverage) has the biggest influence on satiety and how much we eat. Protein and sodium tend to be clustered and can be easier to obtain from meat and seafood.
However, if we want to dig a little deeper, we see fibre also plays a role along with other key nutrients like potassium, sodium, calcium and folate. This cluster of nutrients tends to be easier to get from plant-based foods that complement the nutrient profile of meat and seafood.
The Principal Component Analysis also highlights that it’s not single nutrients but clusters of nutrients that are more prevalent in different foods. Hence, supplements to mimic a high-satiety nutrient profile are unlikely to help increase satiety.
We can then use this understanding to estimate how much of a particular food or meal we might eat and assign a satiety score based on its nutritional profile.