
The age-old nutrition debate often swings between reducing macronutrients – be it low-carb, low-fat, or low-protein diets. However, micronutrients, the essential vitamins and minerals our bodies need, usually take a back seat in these discussions.
The real magic unfolds when we look at what happens to our micronutrient intake at these macronutrient extremes. As it turns out, a balanced approach not only satisfies our body’s nutrient requirements but also aligns with greater satiety and controlled energy intake.
Delve into an eye-opening analysis that uncovers how intertwining our macro and micronutrient intake can pave the way to a nourished and healthier life.
Background
Much of the debate in nutrition circles revolves around limiting macronutrients, like:
- Low-carb,
- Low-fat, or
- Low-protein.
Unfortunately, micronutrients from food are rarely even an afterthought.
Q: But what happens to our micronutrients at these macronutrient extremes?
A: Micronutrients (minerals and vitamins) tend to come packaged with protein (amino acids).
- If you prioritise protein (i.e. essential amino acids), you’ll get plenty of the essential micronutrients (minerals and vitamins).
- Conversely, if you prioritise nutrient density, you’ll also get plenty of protein.
- Because you give your body all the essential nutrients it needs with less energy, a higher Diet Quality Score aligns with greater satiety and eating less.
To learn more, read on.
The Data
This analysis uses data from people using Nutrient Optimiser and NHANES Dietary Data. Altogether, we now have more than three hundred thousand days of data on how people eat in the real world, with about half from each group.
NHANES uses dietary recall surveys of people selected to represent ‘the average American’. Meanwhile, the data from Optimisers are self-recorded in Cronometer and imported into Nutrient Optimiser.
Compared to NHANES, Optimisers are more likely to be nutrition enthusiasts paying more attention to their food quality.
As you will see, combining these two datasets gives some powerful insights into the broad spectrum of macros, micro intakes, and dietary patterns.
To look at the data at the extremes, I’ve sorted the data based on macronutrient percentages to create subsets with 100,000 days of data for each category.
Macronutrients
This first chart shows the calories and macro split for each subset of the data.

- People on a low-protein diet consume, on average, 57 g of protein, while the ‘high protein’ group consume, on average, 128 g of protein.
- The low-protein group consumes 41% more calories than the high-protein group.
- Ironically, the high-fat and low-fat approaches consume about the same energy.
- The low-carb and high-protein % groups consume about the same protein; the high-protein % group consumes less fat.
Micronutrients
Next, let’s look at micronutrients.
The chart below shows the micronutrient fingerprint for the three hundred thousand days of nutrient data. The x-axis is based on our Optimal Nutrient Intakes per 2000 calories for each mineral and vitamin.

These micronutrient fingerprint charts are a handy way to identify your priority nutrients.
- At the top of the chart, we see that most people struggle to get enough vitamin K1, magnesium, vitamin C, folate, selenium and potassium.
- Meanwhile, towards the bottom of the chart, on average, most people are getting plenty of vitamin A, B12, B1 and phosphorus.
What Are the Optimal Nutrient Intakes?
The Dietary Reference Intakes are the minimum nutrient intakes to prevent diseases of deficiency. They also tend to align with the highest energy intake.
In contrast, the Optimal Nutrient Intakes are our stretch targets for each nutrient based on our satiety analysis (see the example for calcium below). While a challenge, they are achievable with whole food.

Similar to protein leverage, there appears to be a supporting nutrient leverage effect that occurs when we get more of our priority minerals and vitamins per calorie.
Diet Quality Score
Our Diet Quality Score measures food quality, irrespective of quantity.
Most approaches to micronutrients focus on eating more of food X to get nutrient Y. In contrast, the Diet Quality Score requires you to pack more of your priority nutrients into your daily energy budget. Rather than eating more, the focus is on eating better.
If you could reach all of the Optimal Nutrient Intakes (per 2000 calories), you’d get a perfect score of 100%. But you don’t get bonus points for exceeding 100% for any of the nutrients.
Normally, we include all thirty-four essential nutrients in our Diet Quality Score. But because the NHANES data doesn’t include amino acids or omega-3, I’ve used a modified diet quality score using only the essential vitamins and minerals.
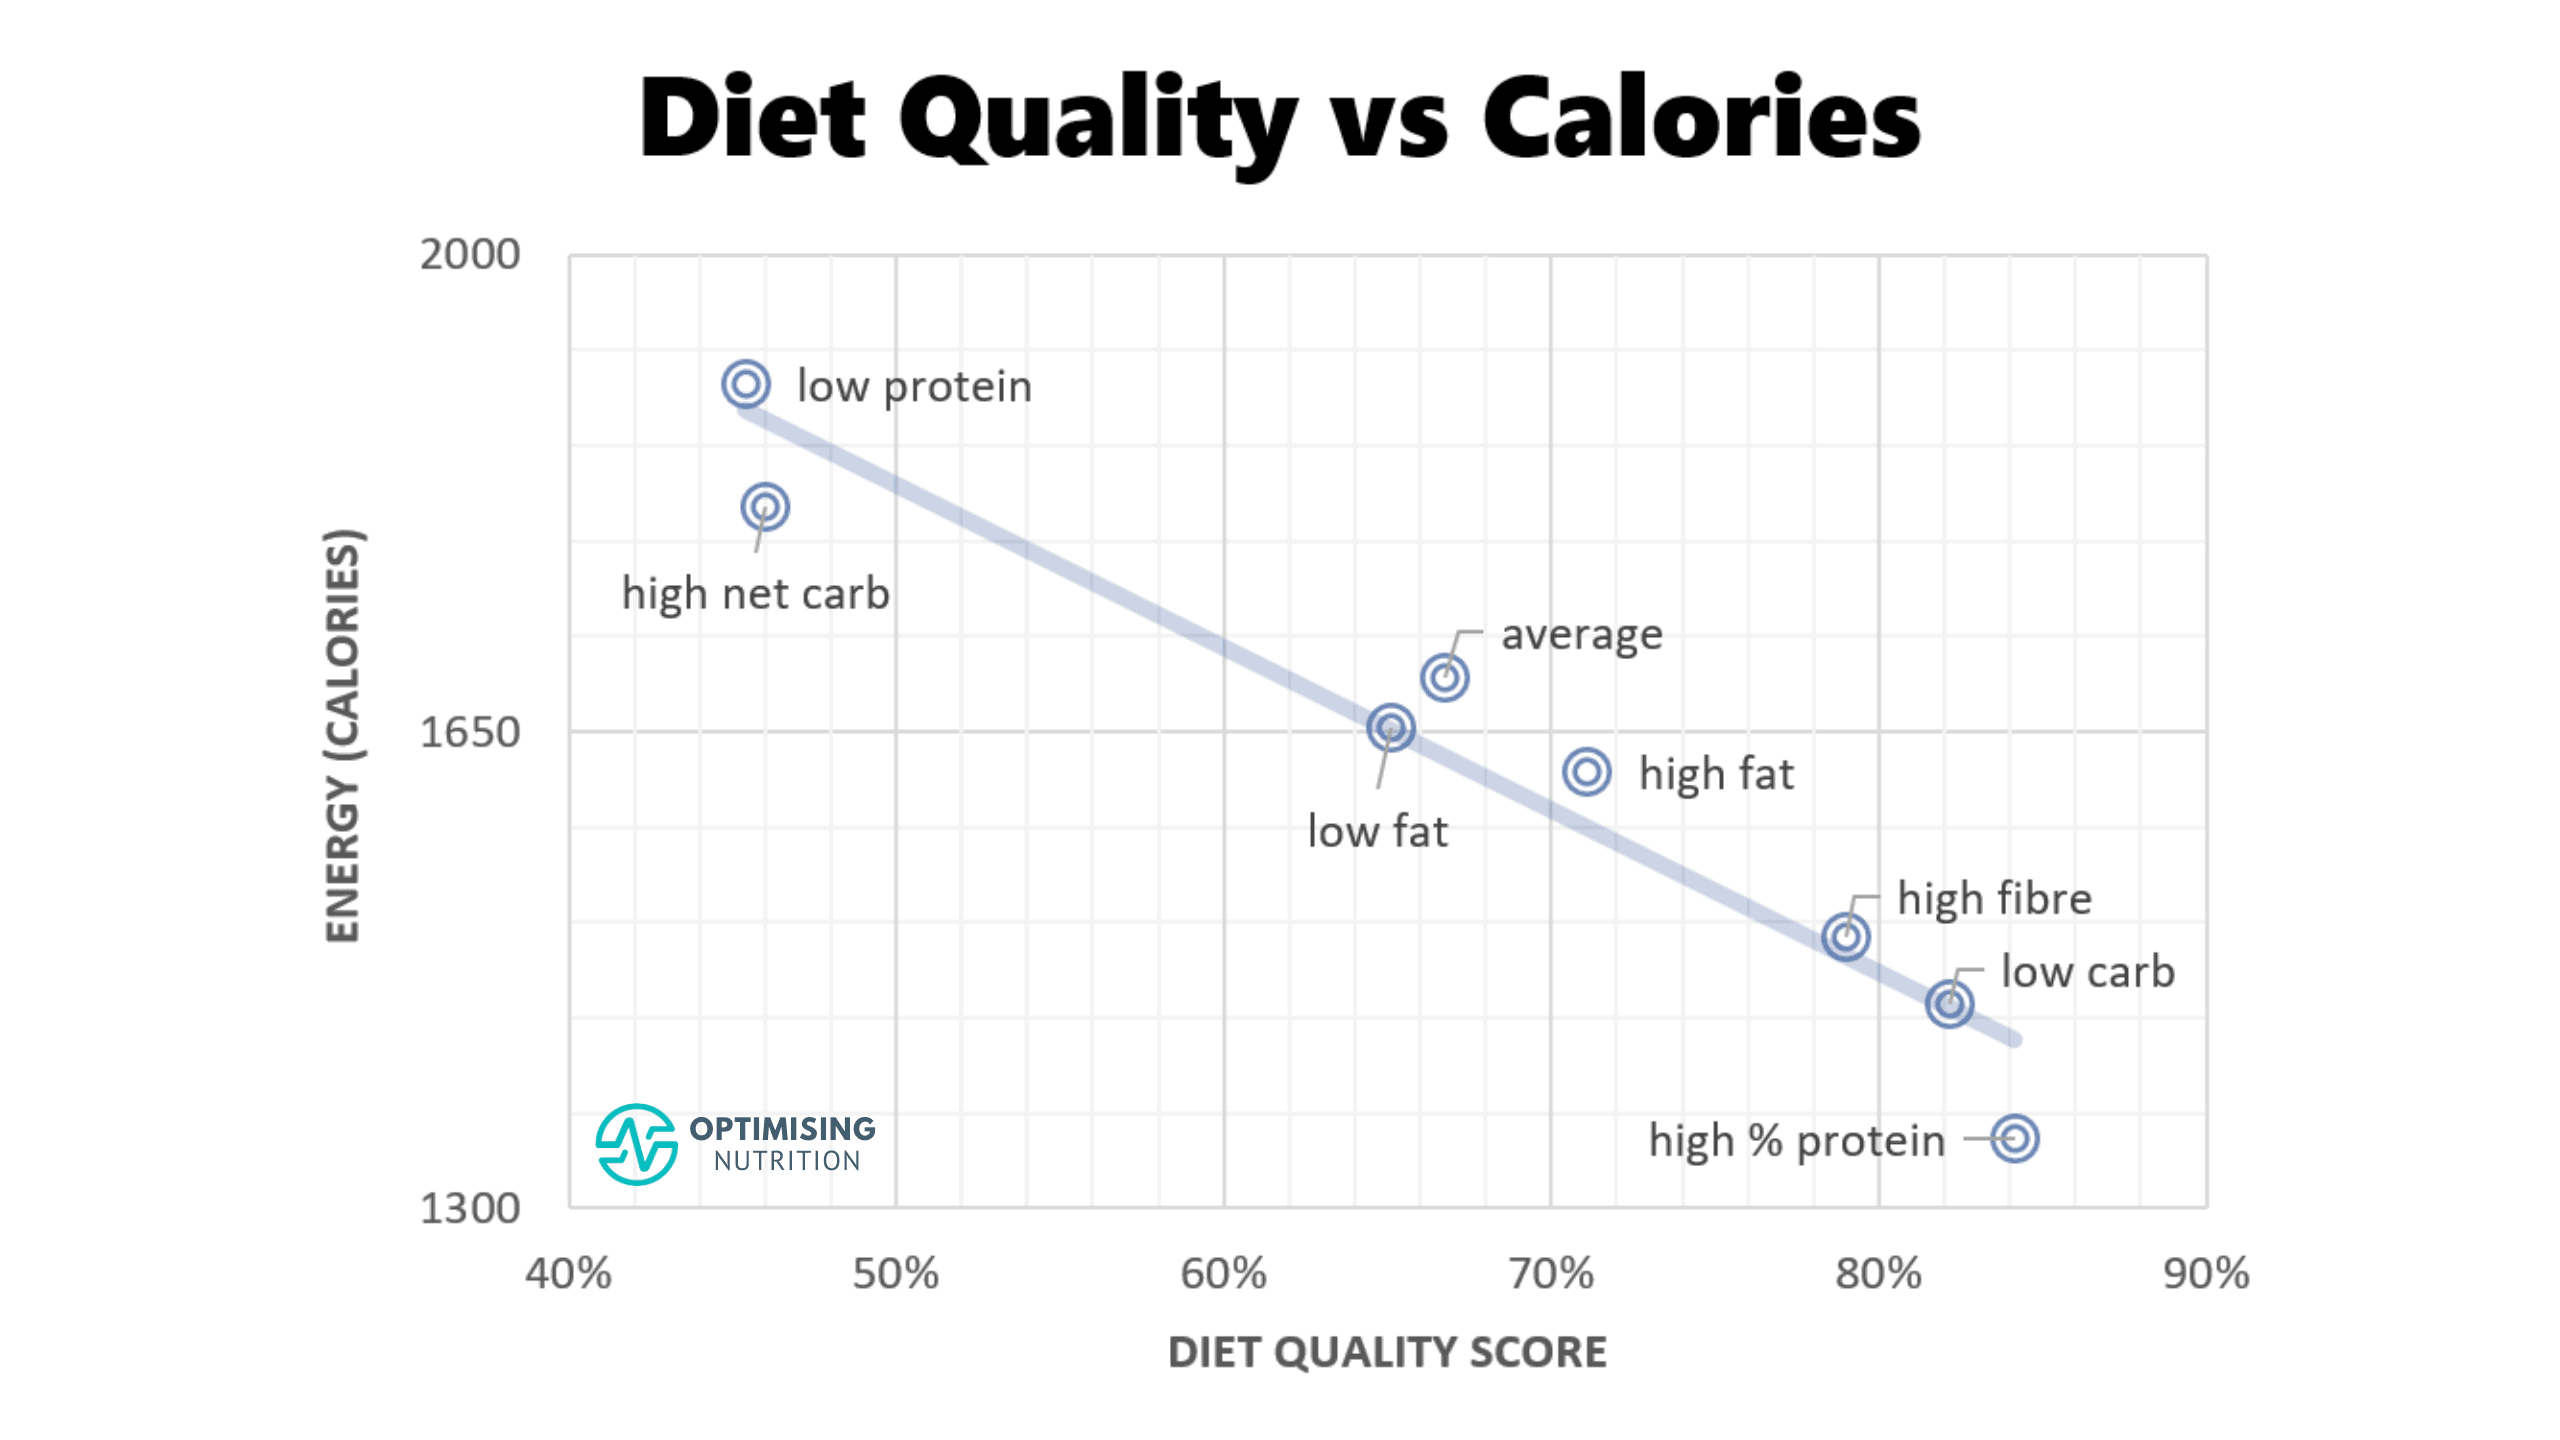
The chart below shows the summary of the analysis. If you’re eager to see which nutrients each extreme provides more and less of, you can jump to the Appendix.

Too Much Protein?
While many people seem to be concerned about ‘too much protein’, the reality is it’s hard to overconsume protein if you’re staying within your energy budget.
As you can see in the chart below, as people increase their protein %, protein (in grams) initially rises quickly, but then tapers off while total energy continues to drop.

According to the NHANES data, the average American consumes 15.4% protein. You don’t have to jump to 50% protein for greater satiety and sustainable weight loss. Because your body naturally craves energy from carbs and fat, it’s hard to consume a very high protein %.
As you can see in the distribution chart below, very few people manage to get above 50% protein — you don’t need to be concerned about accidentally consuming too much protein. For more on ‘too much protein, see Rabbit Starvation: Will “Too Much Protein” Kill You?

In our Macros Masterclass, we guide Optimisers to identify their current macros and incrementally dial back energy from fat and carbs while prioritising protein to achieve sustainable fat loss. In our Micros Masterclass, Optimisers focus on getting more of their priority minerals and vitamins within their energy budget, which also leads to a higher protein %.
Summary
- A higher diet quality score aligns with consuming fewer calories.
- Nutrient-dense foods and meals pack in more of the essential nutrients our bodies need, so our appetite is satisfied with fewer calories.
- Diets with low protein and more non-fibre carbohydrates tend to have fewer nutrients and align with a higher calorie intake.
- Diets with a higher protein %, less carbohydrate and more fibre tend to pack in more essential nutrients align with eating less.
Action Steps
We have created several tools to help you increase your protein % and nutrient density, which also leads to greater satiety per calorie.
1. Increase Your Protein %
Increasing your protein % is the simplest place to start your journey of Nutritional Optimisation. You can find a simple list of high-protein foods in our Optimising Nutrition Community space here.

If you want extra help, you can join our Macros Masterclass, where we guide Optimisers to progressively dial in their balance of protein, fat and carbs to achieve their goals using our 1400+ NutriBooster recipes.
2. Focus on Your Priority Nutrients
While adequate protein should be the foundation of your diet, dialling in your priority nutrients will provide greater satiety and increase your nutrient density.
Check out the micronutrient fingerprint charts below and identify a few nutrients you need to prioritise based on your current dietary pattern. You can then check out our nutrient focussed food lists in our Optimising Nutrition community here.

3. What’s Your Diet Quality Score?
If you’re curious about your Diet Quality Score, take our Free 7-day Nutrient Clarity Challenge to get your personalised micronutrient fingerprint and identify the foods and meals that contain your priority nutrients.

In our Micros Masterclass, we gamify the process of Nutritional Optimisation. Seeing people competing for top places on the Diet Quality Leaderboard is exciting. Rather than deprivation and restriction, the Diet Quality Score gamifies nutrition with a focus on nourishing your body with what it needs to thrive!

Appendix – Micronutrient Fingerprint Charts
The chart below shows the micronutrient fingerprint charts for low protein, low fat, low carb and high protein together.

The micronutrient fingerprint charts below show each macro extreme separately. You can use these charts to identify which nutrients you may lack if you identify with one of these macronutrient-based approaches.
Low Protein (DQS = 45%)

Low Fat (DQS = 65%)

High Fat (DQS = 71%)

Low Carb (DQS = 82%)

High Protein (DQS = 84%)

More
- What is Nutrient Density (and Why It Matters)?
- The Diet Quality Score: Your Ultimate Measure of a Balanced Diet
- Diet Quality and Weight Loss: A Deep Dive
- Level Up Your Health with Gamified Personalised Nutrition
- High Mineral Foods
- High Vitamin Foods
- Mineral Rich Foods
- Vitamin Rich Foods
- NutriBooster Recipes
- Macros Masterclass
- Micros Masterclass