

Tufts University’s Friedman School of Nutrition recently unveiled the Food Compass, and it’s not your typical research paper. It’s a system with a mission: to evaluate the healthiness of foods for practical purposes like labels, warnings, taxes, and company ratings.
In essence, it could shape food policies for decades, both in the U.S. and worldwide.
But here’s the twist: Since its release, the Tufts Food Compass has raised eyebrows. Some say it’s ranking foods in unexpected and puzzling ways, putting highly processed items ahead of minimally processed, nutrient-rich options.
And here’s another layer to the story: Some companies whose products rank high on the Food Compass have provided financial support. This has led to questions about potential conflicts of interest and whether personal beliefs may have influenced the ranking algorithm.
In this article, we’ll take a closer look at the Tufts Food Compass’s nine ranking factors to see if they genuinely help with satiety, obesity prevention, and overall health.
Let’s delve into it together!

- What Is the Tufts Food Compass Score?
- Who Created the Tufts Food Compass?
- Will The Tufts Food Compass Help You Lose Weight?
- Tufts Food Compass vs. Satiety Index Score
- The Benefits of a Nutrient Profiling System
- The Ranking Factors
- Fibre and Protein
- Minerals
- Vitamins
- Nutrient Ratios
- Food-Based Ingredients
- Specific Lipids
- Additives
- Processing
- Summary
- More
What Is the Tufts Food Compass Score?
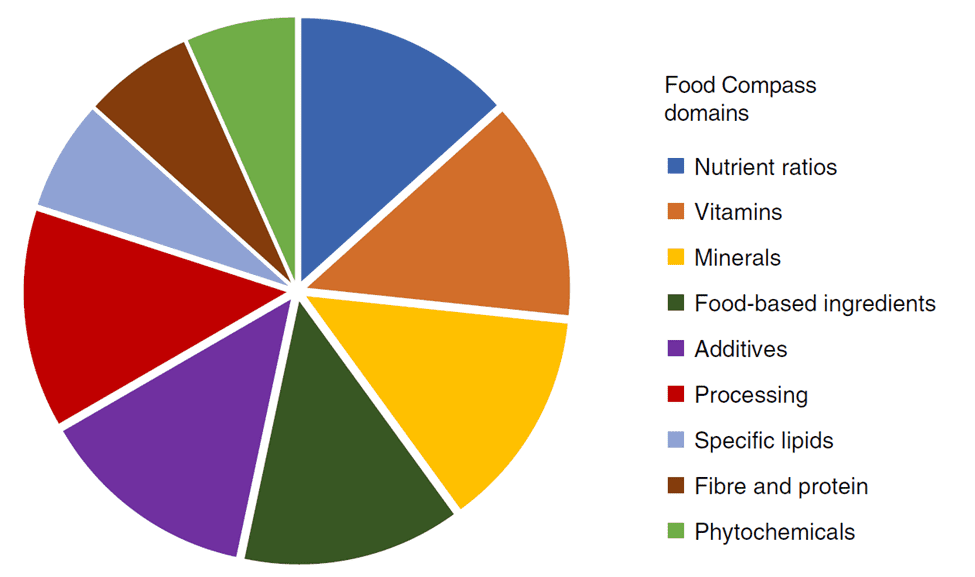
The pie chart below shows the weightings given to each of the nine domains used in Tufts’ Food Compass:
- Nutrient ratios
- Vitamins
- Minerals
- Food-based ingredients
- Additives
- Processing
- Specific lipids
- Fibre and protein
- Phytochemicals
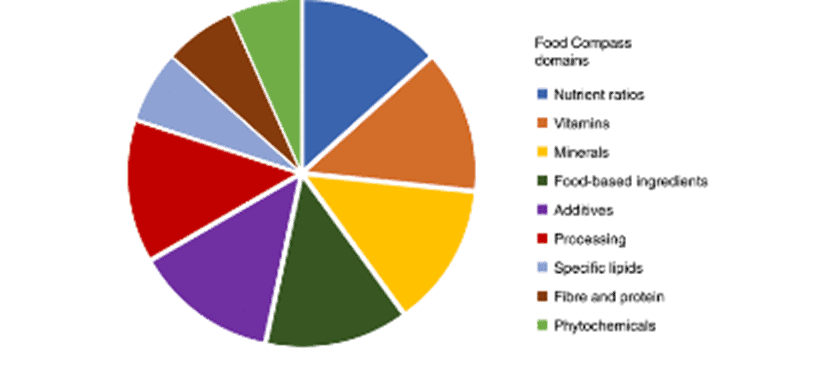
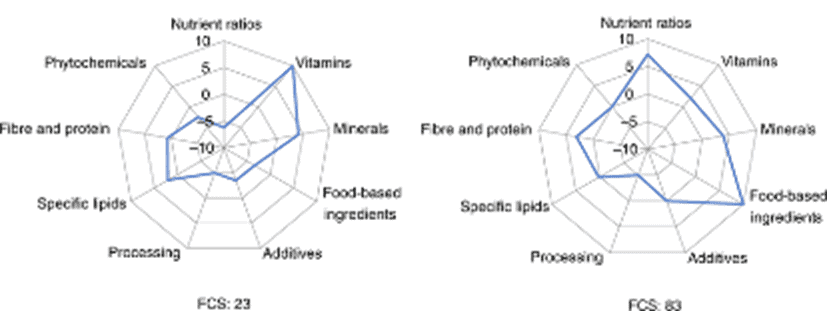
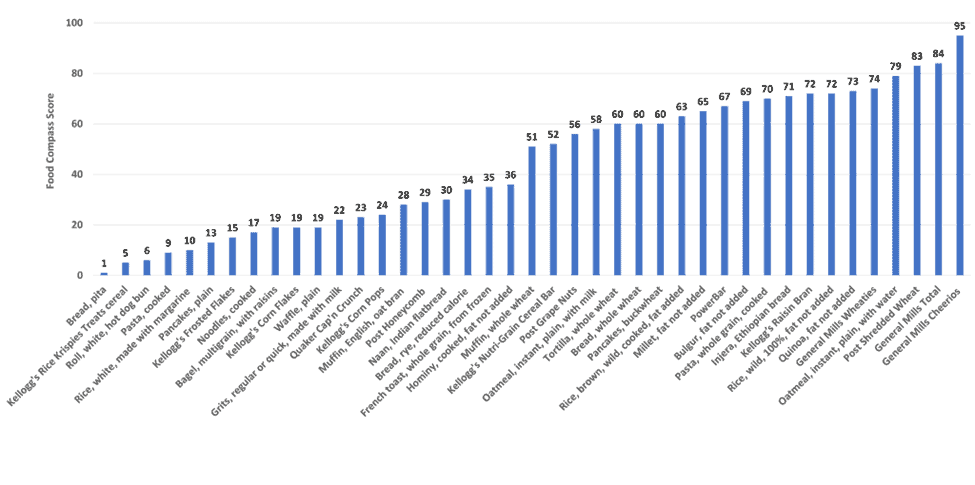
A food scores and ranks more highly if it scores well across all nine domains, and vice versa.
- The chart on the left below scores well in vitamins and minerals but poorly in the other domains, which gives it a low score of 23.
- Meanwhile, the food shown on the right scores well in food-based ingredients and several other domains, so its compass score of 83 is much higher.
Selecting these parameters and their weightings is critical to ensure they provide sensible results that align with satiety and improved metabolic health.
We’ve been on a five-year mission to design and build a data-driven system using large datasets to quantify the foods and meals that cause us to overeat. From this data, we’ve developed our own ranking system that allows us to identify ideal foods and meals that align with specific goals.
To learn more about our nutrient-focused food ranking system, see:
- How to Maximise Satiety Per Calorie
- The Most Nutrient-Dense Foods – Tailored to Your Goals and Preferences
- Nutrient-Dense Meals and Recipes
- High Satiety Index Foods: Which Ones Will Keep You Full with Fewer Calories?
- Highest Satiety Index Meals and Recipes
Who Created the Tufts Food Compass?
The Tufts Food Compass nutrient profiling system was developed by the Friedman School of Nutrition Science and Policy at Tufts University. Professor Dariush Mozaffarian led the project that has ranked 8,032 foods.

Tufts University touts Food Compass as the ‘most comprehensive and science-based nutrient profiling system to date that clears up confusion to benefit consumers and policymakers.’
Mozaffarian was co-chair of the White House Conference on Hunger, Nutrition, and Health, which was held in September 2022.
The conference is billed as ‘the most significant food policy event in over fifty years’. The previous occasion was in 1969, under the leadership of President Nixon and senators George McGovern and Bob Dole.
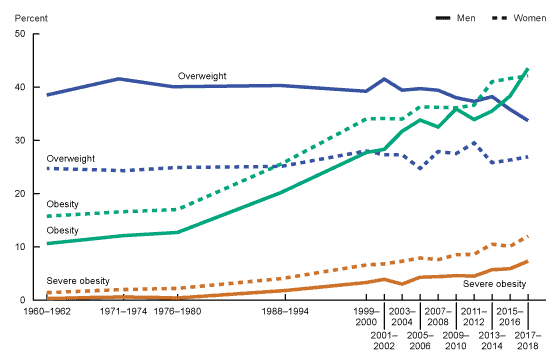
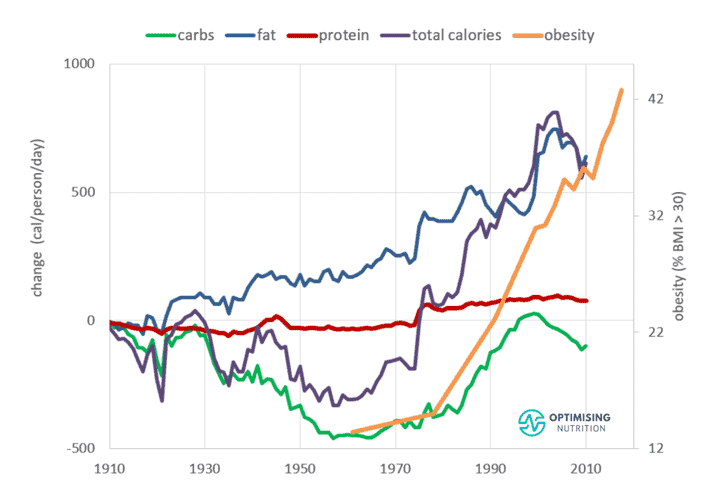
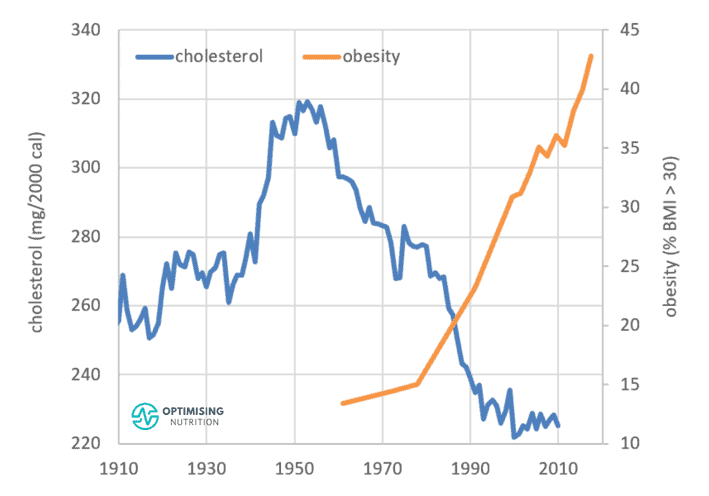
For context, the chart below shows what has happened to our food system since the historic McGovern Report, which suggested Americans eat less fat and cholesterol and more complex carbs and fibre.

As you can see, since that time, the diet of the US and the rest of the world has become a more refined conglomerate of processed carbohydrates and industrial seed oils that have fuelled our obesity epidemic.
The McGovern Commission and the Dietary Goals for Americans that followed in 1977 were based on research and beliefs about nutrition during that time. The guidelines were not tested as interventions to see if they improved satiety or health.
Unfortunately, as you will see, many of those nutritional beliefs have not changed in the last half-century and are set to be locked in for another fifty years when Food Compass becomes public policy.
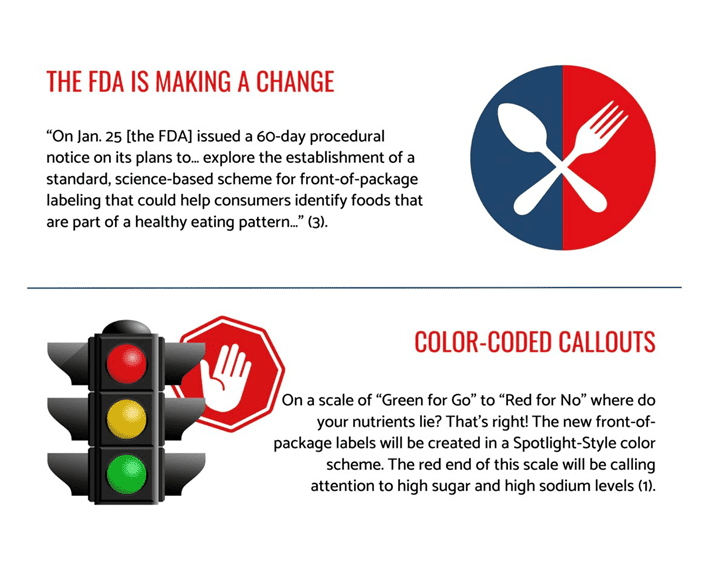
The Tufts Food Compass is not a new food pyramid but a traffic light system. As of January 2023, it appears that the FDA is now moving to implement the Food Compass ranking system as an outcome of the September 2022 White House Conference.
For a data-driven review of the current dietary guidelines, see:
- Protein – Optimal vs Acceptable Macronutrient Distribution Range (AMDR)
- Fat – Optimal vs Acceptable Macronutrient Distribution Range (AMDR)
- Carbohydrates – Optimal vs Acceptable Macronutrient Distribution Range (AMDR)
Will The Tufts Food Compass Help You Lose Weight?
It’s important to note that, despite the majority of Americans being obese, the Tufts Food Compass scoring system is not about weight loss but rather ‘healthfulness’ based on a range of parameters deemed desirable, as discussed below.
In contrast, our Satiety Index Score ranks foods based on the likelihood that they will provide the nutrients that tend to lead to greater satiety and weight loss.
Tufts Food Compass vs. Satiety Index Score
If you’re reading this to understand what you should eat, the chart below shows how Tufts’ Food Compass’s ‘healthfulness’ rating compares to our Satiety Index Score. If you want to dive into the details, you can check out the interactive Tableau version of this chart here.
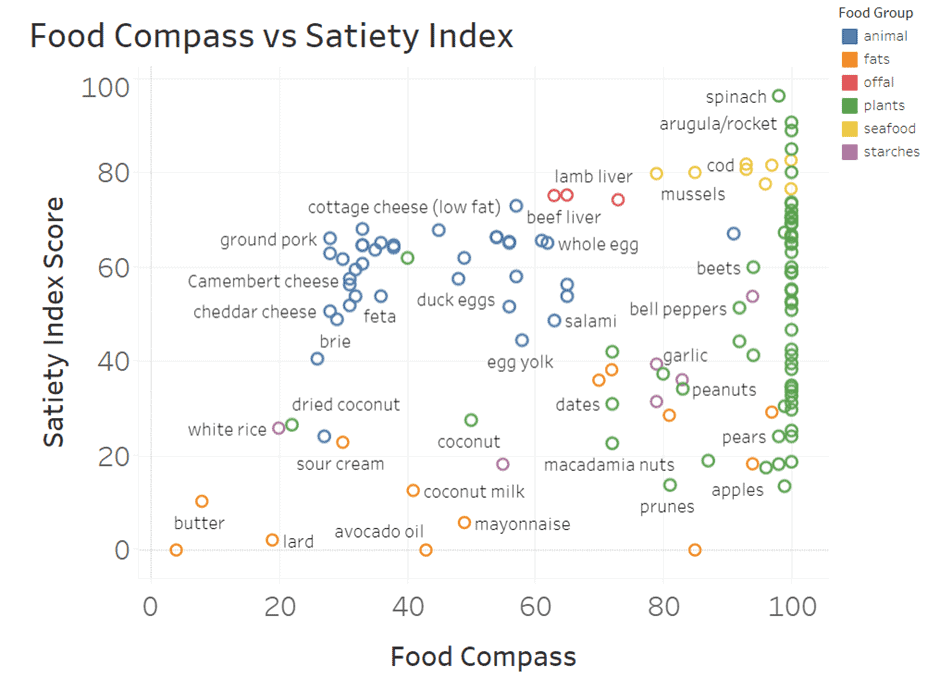
- In the bottom left, we see both systems have a low rank for butter, coconut oil and lard.
- Both systems rank non-starchy green vegetables like spinach, rocket and broccoli in the top right. Seafood also scores well in both systems.
- Along the bottom, we can see that Food Compass gives a significant bump to refined fats like olive oil and mayonnaise because they contain unsaturated fats, although they provide little nutritional value.
- Along the right-hand side, many fruits score 100%. This is likely due to the emphasis on phytonutrients, typically only measured in fruits and some vegetables.
- Meanwhile, towards the top left of the chart, we see that Food Compass provides a lower weighting for animal-based foods due to their cholesterol content.
For more details, you can find the full Food Compass Food List in the supplementary materials here.
As you will learn below, the Food Compass Nutrient Profiling System relies on a number of negative ranking factors. In contrast, our system simply focuses on getting enough of the essential nutrients from the food you eat, particularly those that align with greater satiety.
The chart below shows how our approach looks in terms of nutrient density (per calorie) vs nutrient density (per serving). The colouring is based on our Satiety Index Score, meaning the foods shown in green tend to provide more satiety per calorie, while the ones in red are much easier to overeat.

You can dive into the details of this chart in the interactive Tableau version here or download our food lists tailored for a range of goals and preferences here.
The Benefits of a Nutrient Profiling System
Confusion and conflicts of interest abound in the field of nutrition. Hence, creating an unbiased quantitative ranking system that food manufacturers can’t manipulate is a worthy quest to combat the exploding diabesity epidemic.
Considering many modern interfaces like Google, Instagram, Facebook, and TikTok are optimised with quantitative and complex algorithms, it makes sense that we should also be able to systematise the parameters of the food we eat based on what our bodies require to satisfy our cravings precisely.
With the explosion of voice search and AI, it won’t be long before people come home and say, ‘Google/Alexa, what should I eat tonight or this week?’ and Amazon or Uber Eats will arrive on their doorstep with dinner or the groceries for the next few days.
Unfortunately, most ranking systems are built to advertise to YOU more precisely and end with YOU as the product. Because they do this so effectively, Facebook, Instagram, and Google have quickly become the wealthiest companies.

Similarly, if the food industry finances a food ranking system, it will likely guide you to buy more of the products it wants to sell you.
In the following sections, we’ll take a look under the hood of Food Compass to understand the implications of the various ranking factors better and why they provide some unexpected results.
The Ranking Factors
The table below shows the nine domains used by the Food Compass System nutrient profiling system, which includes 35 different ranking criteria. Note that the three domains towards the right (specific lipids, protein and fibre, and phytochemicals) have been given half the weighting of the other five domains.
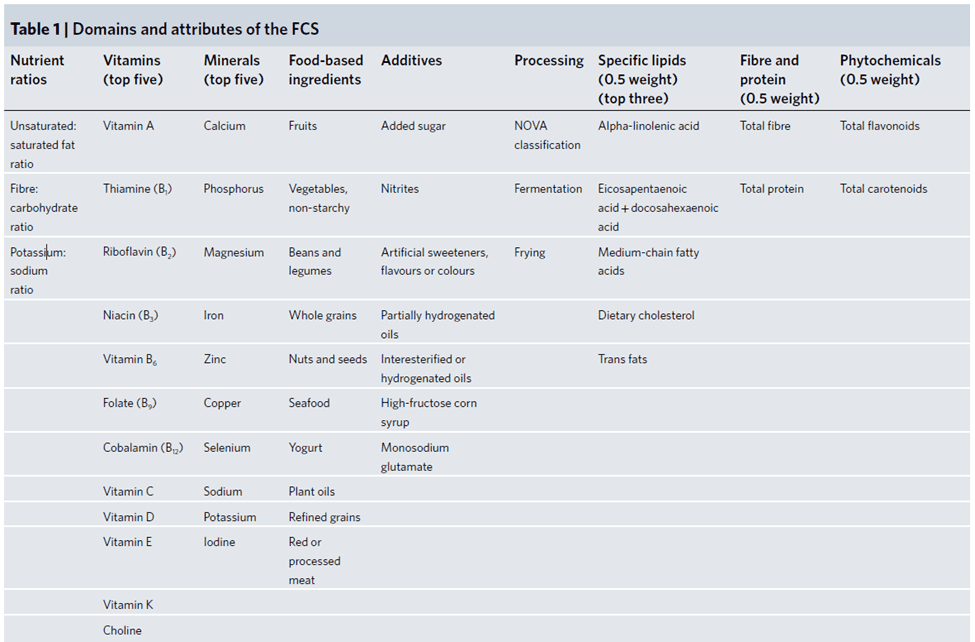
On the surface, this all looks logical.
But will this complex system help you identify the foods containing the essential nutrients required to let you thrive and feel satisfied?
In a recent review of the Food Compass nutrient profiling system, Ty Beal and colleagues noted that ‘a primary limitation of Food Compass is that the weighting of attributes and domains does not represent a balanced reflection of available evidence and sometimes appears arbitrary and insufficiently transparent.’
We agree! And by the end of this article, we think you will too.
Fibre and Protein
Let’s start with the big guns: protein and fibre.
Protein (%)
Protein % refers to the per cent of total calories from protein.
Data from our analysis 136,154 days of food data from forty thousand people who have used Nutrient Optimiser users show that protein percentage dramatically impacts the amount of food you tend to eat. This is illustrated in the protein % vs calorie intake chart below.
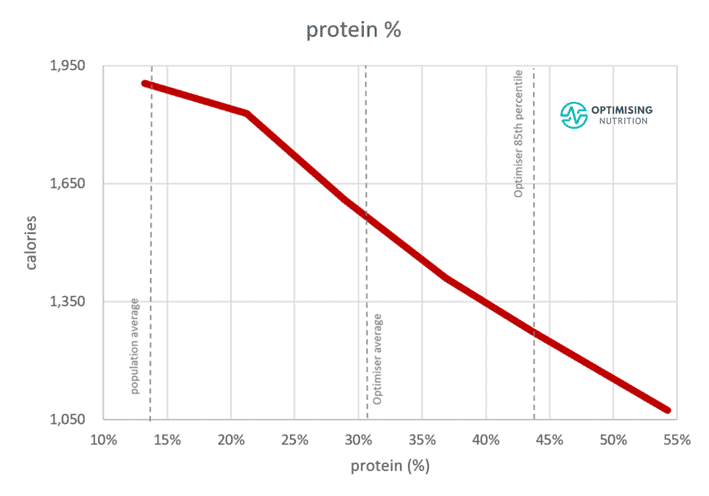
People consuming a diet with the lowest percentage of protein tend to eat twice as many calories as people consuming the highest protein %!
Our appetite balances our requirements for nutrients like protein and energy. Hence, it’s critical to get adequate protein and nutrients without overconsuming energy.
For more detail on the relationship between protein % and how much we eat, check out:
- The Protein Leverage Hypothesis, and
- How Much Do You Need to Increase Your Protein % to Lose Weight?
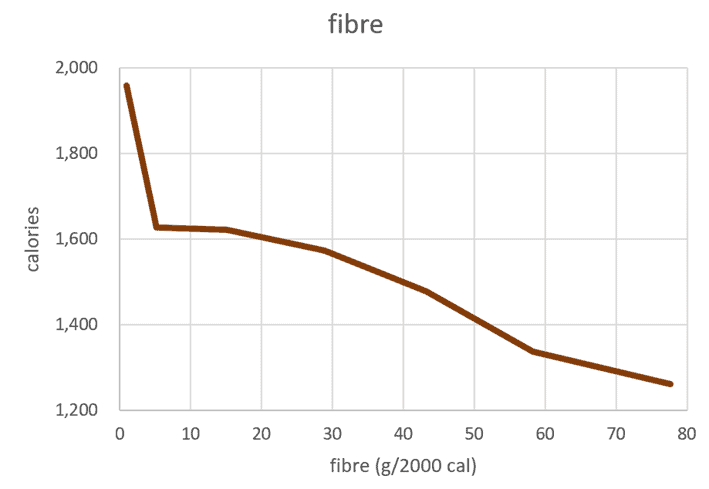
Fibre
Our analysis shows that fibre also has a positive impact on satiety. Fibre—or the lack of—is an excellent indicator of whether a food is processed or refined; the less fibre a carb-rich food has, the more likely it is to be processed (i.e., non-starchy vegetables vs refined sugar and flour).
For more detail on fibre, see Dietary Fiber: How Much Do You Need?
Food Compass Weighting for Fibre and Protein
Good news: the Food Compass nutrient profiling system includes fibre and protein in its ranking factors.
Bad news: the weighting for these critical parameters is very low.
Protein and fibre—the most critical factors influencing satiety—have been grouped in one domain and given half the weighting.
The chart below shows the relative weighting given to each ranking factor (domain) used by Food Compass. The little brown slice in the top left represents protein and fibre combined. Their system only weighted 6.7% to protein and fibre!
If the goal of the Food Compass was to actually empower people to eat less and reverse the diabesity epidemic, the fact that some of the highest-ranking foods (e.g., celery juice, Cheerios, grapefruit, avocado, and chocolate almond milk) contain negligible protein suggests that they might have dropped the ball in the weighting of their ranking factors.
Consuming adequate protein without excess energy is the first fundamental step in optimising your nutrition and increasing your satiety.
Minerals
It’s encouraging to see that some critical essential minerals were also included in the Food Compass rankings.
Our analysis also shows that foods and meals that contain more minerals per calorie satisfy our cravings to varying degrees and improve satiety.
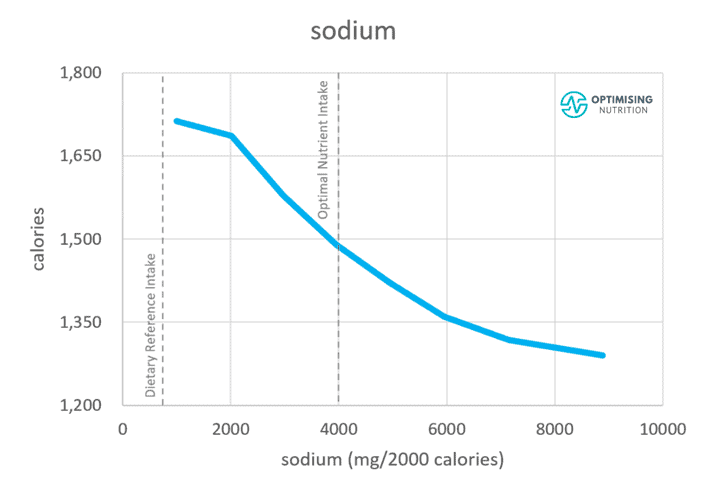
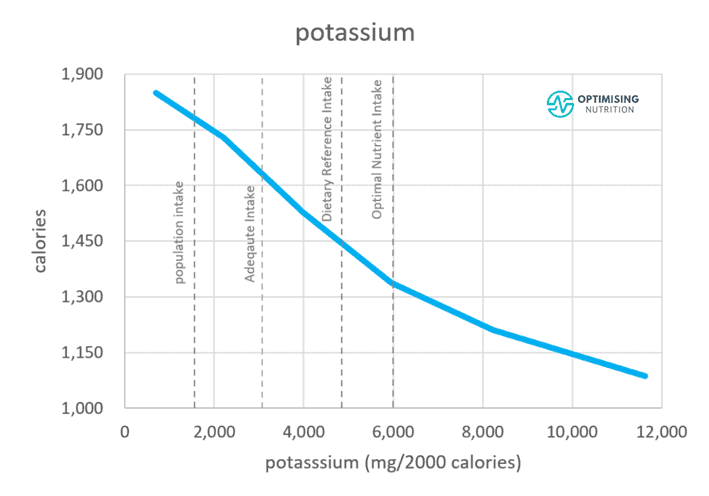
The charts below show the satiety response curves for some of the minerals considered by Food Compass. In each graph, you will notice that getting more of each mineral per calorie tends to align with a lower energy intake.
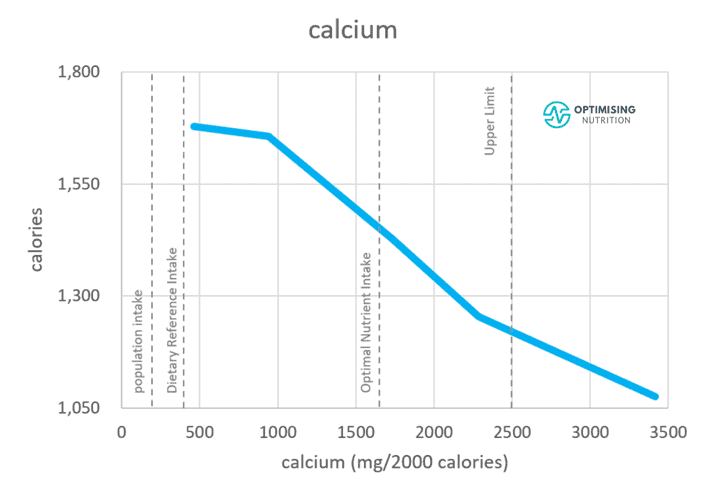
This chart shows all the essential minerals together, showing a positive satiety response to each of them to some degree.
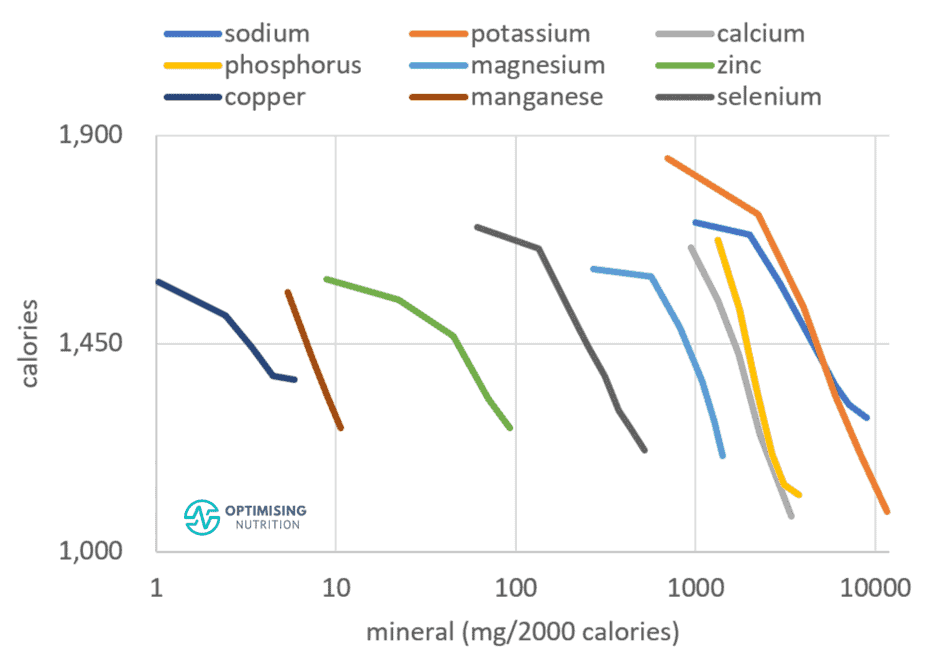
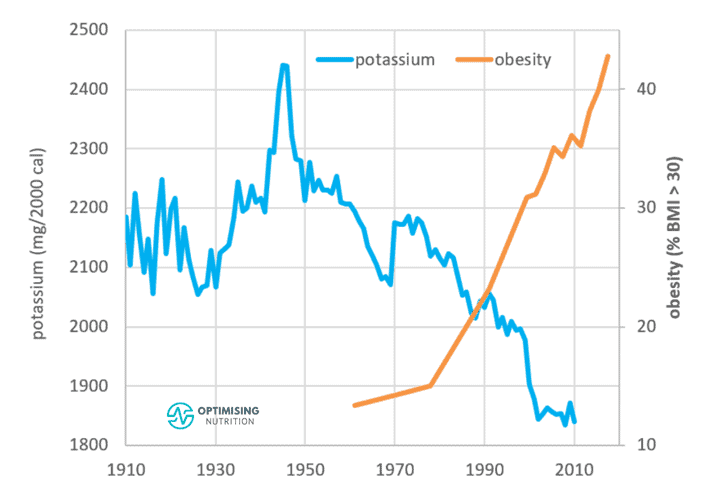
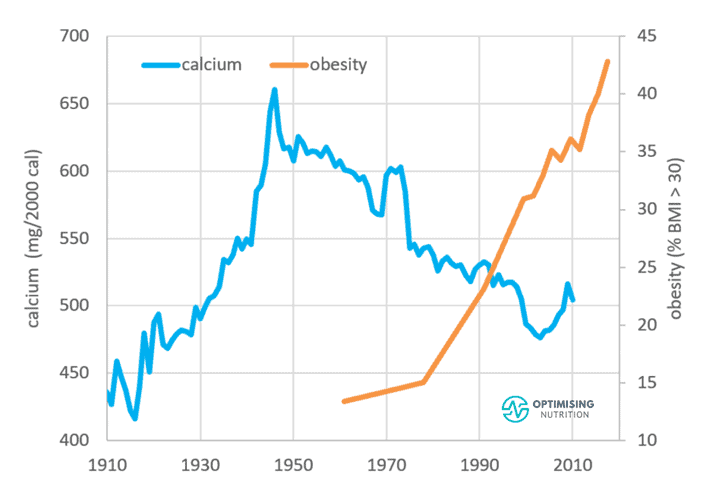
It’s also worth noting that minerals like potassium and calcium have declined significantly in our food system over the past century as we have become more reliant on synthetic fertilisers that have degraded quality of our soil. As a result, we now have to consume a lot more food than we would have in the 1940s to get enough of these minerals. So, it makes sense that we might have strong cravings for them.
For more details on the satiety impact of minerals, check out The Effect of Minerals on Appetite, Hunger and Satiety.
Multivariate Analysis
To understand the degree to which nutrients impact our cravings when considered together, we ran a multivariate analysis of the essential minerals. I also included protein and fibre, which we already established as having a solid relationship with satiety.
As the table below shows, potassium, calcium, and sodium have a statistically significant relationship with overall calorie intake. Increasing your diet’s mineral content in addition to protein and fibre aligns with a significant reduction in calorie intake.
| Nutrient | 15th | 85th | % |
| protein (%) | 19% | 44% | -32% |
| potassium (g/2000 cal) | 1.9 | 5.9 | -4.7% |
| fibre (g/2000 cal) | 11 | 44 | -4.5% |
| sodium (g/2000 cal) | 1.5 | 5.1 | -2.7% |
| calcium (g/2000 cal) | 0.5 | 1.9 | -2.6% |
| vitamin B5 (mg/2000 cal) | 4 | 15 | -1.1% |
In addition to protein and fibre, electrolytes are critical for people looking to satiate their appetite, eat less, and reverse conditions related to the diabesity epidemic. So it’s good to see that Food Comoass has emphasised these.
Vitamins
Next, let’s look at the satiety impact of vitamins.
Below, we’ve included the nutrient-satiety response curves for the vitamins considered by Food Compass. Like protein and minerals, vitamins affect satiety positively.
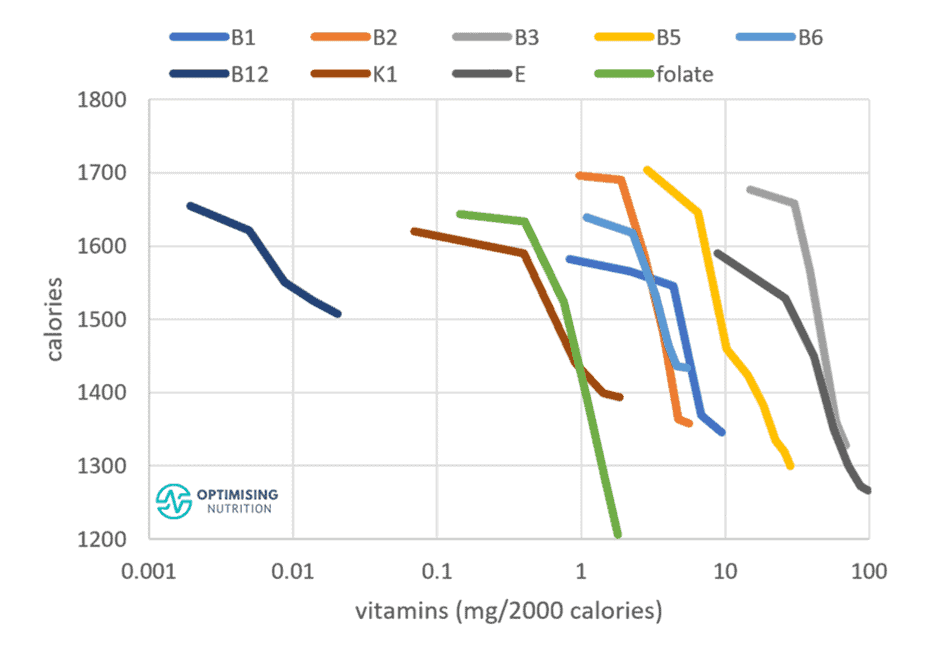
However, the satiety benefit dissipates when we exceed the amounts we can obtain from whole food. In fact, it often rebounds! Just because your Cheerios are fortified with a smattering of synthetic vitamins to replace the nutrients lost in processing doesn’t mean they’re more satisfying or healthier.
For more detail on the satiety response to synthetic vitamins and fortification, see Nutrients: Could You Be Getting Too Much of a Good Thing (from Supplements and Fortification)?
Overall, it’s good to see that vitamins have been included as a ranking factor. However, in terms of satiety, they don’t tend to add a lot.
Having twice the weighting for vitamins compared to protein and fibre together is dubious, especially when it seems to rank synthetically fortified breakfast cereals so highly.
Nutrient Ratios
Next, we’ll look at the nutrient ratios used by Food Compass:
- the potassium:sodium ratio,
- the fibre:carbohydrate ratio, and
- the unsaturated:saturated fat ratio.
Nutrient ratios are an interesting topic that is often overlooked. Many nutrients compete for absorption, so having too much of one nutrient from supplements or fortification can inhibit the absorption or utilisation of another.
Considering the micronutrient ratios becomes important if your diet relies heavily on supplements and fortified processed foods. However, if you get most of your nutrients from Whole Foods, you needn’t worry as much about nutrient ratios; they tend to look after themselves.
For more details on micronutrient ratios, see Micronutrient Balance Ratios: Do They Matter and How Can I Manage Them?
Potassium:Sodium Ratio
As mentioned above, our satiety analysis shows that sodium AND potassium positively influence satiety. We eat less when we consume more foods that naturally contain more of these minerals per calorie.
There is plenty of controversy around sodium, and many recommend trying to minimise it. However, sodium is not necessarily a nutrient we need to minimise or avoid at all costs, but we definitely need to keep it balanced with potassium. For more details on how much salt we really need, check out How Many Grams of Sodium Do You Need Per Day?
Hence, considering the potassium:sodium ratio is reasonable, mainly because most people don’t get enough potassium.
The satiety chart below shows that people consuming more potassium than sodium tend to consume fewer calories. But in the big scheme of things, the calorie reduction is small compared to the decline from other nutrients like potassium and sodium.

In our system, we find that prioritising adequate sodium and potassium is plenty without necessarily penalising sodium.
Fibre:Carb Ratio
Next, we come to the fibre:carb ratio, which the Food Compass system uses to measure refining and processing.
The chart below shows the satiety response to total carbohydrates and non-fibre carbohydrates alongside one another. As noted earlier, fibre tends to have a positive satiety response, and we eat less when our carbohydrates are more fibrous.
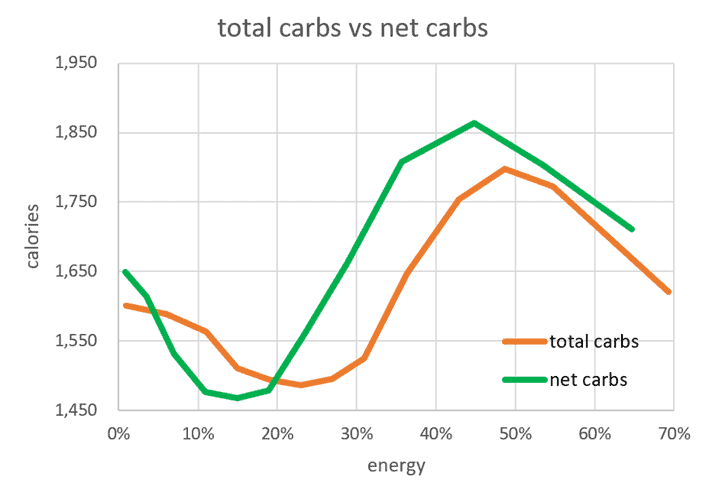
Similar to fat, carbohydrates are just another energy source. Hence, it makes sense that we eat more when our food contains more non-fibre carbohydrates. We can see that we consume the most energy aligns when about half of our energy comes from non-fibre carbohydrates, and the remainder comes from fat. However, it’s not a simple linear relationship.
- Zero-carb is not necessarily better than lower-carb.
- Lower-carb (i.e., 10 – 20% total carbs or 20 – 30% net carbs) tends to align with the lowest overall energy intake.
- On the right-hand side of the chart, we see that a very high-carb, low-fat diet corresponds to a slightly lower calorie intake than when we consume fat and carbs together.
Looking at the satiety response curve for fibre:carb ratio, we see that we benefit from consuming more fibrous carbohydrates.
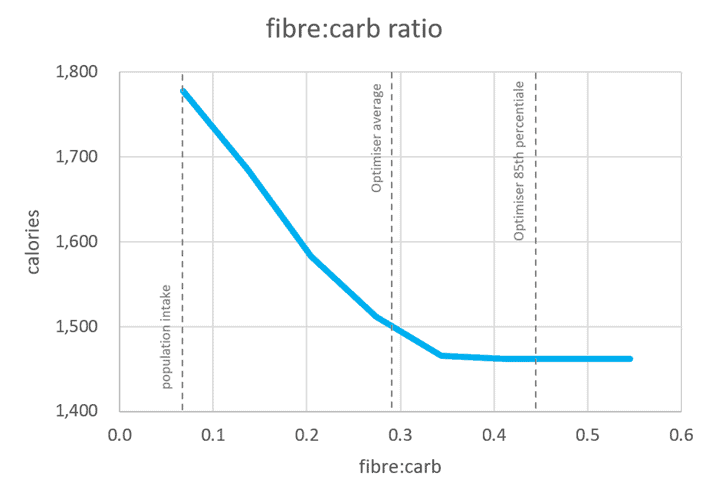
Overall, the fibre:carb ratio is a logical inclusion. However, it would make more sense to simply increase the weighting of the protein and fibre domain.
Saturated:Unsaturated Fat
Things start to get interesting when we look at the different types of fat.
Fat is an easily accessible energy source and is the most calorically dense macronutrient. So, it shouldn’t be too surprising to see that more energy from fat corresponds with a higher overall energy intake.
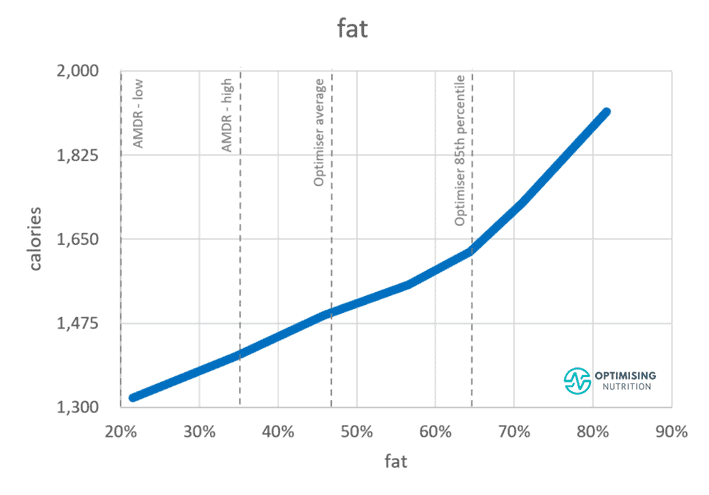
But because protein often comes packaged with fat, eating a very low-fat diet can force us to sacrifice some of our protein intake, negatively impacting satiety. So we need to find a balance between the extremes that allows us to get adequate protein without more energy than we need.
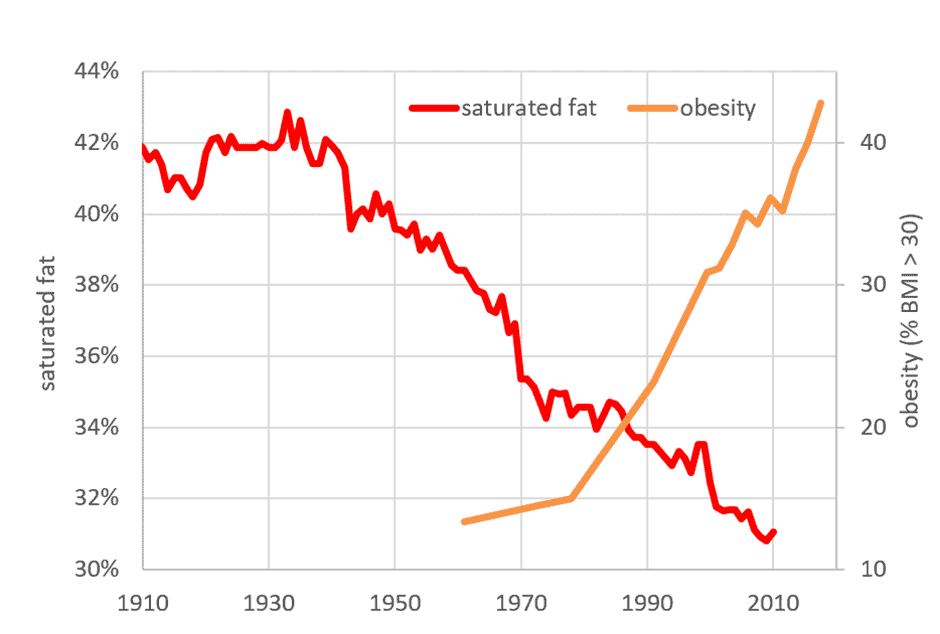
The satiety response to saturated fat is even more interesting. Up until around 30% of our calories come from saturated fat; more saturated fat aligns with a higher calorie intake. However, our energy consumption tends to decrease beyond this point. This is likely because foods like hamburgers and chips fried in lard containing saturated fat as ingredients provide more hyper-palatable energy. However, saturated fat from whole foods like steak and eggs that contain more protein is not as much of a concern.

Interestingly, the US intake of saturated fat was approximately 42% of total calories in the 1940s. However, with the ever-climbing increase in industrial seed oils in our food system, our average intake has drifted down to 31%. Ironically, this percentage aligns with the maximum calorie intake in the chart above.
Meanwhile, a greater intake of monounsaturated fat aligns with a more substantial calorie intake, particularly once we exceed 15%. Some monounsaturated fats from whole foods like avocadoes is great. It’s when it starts to dominate our diet that we get into trouble.
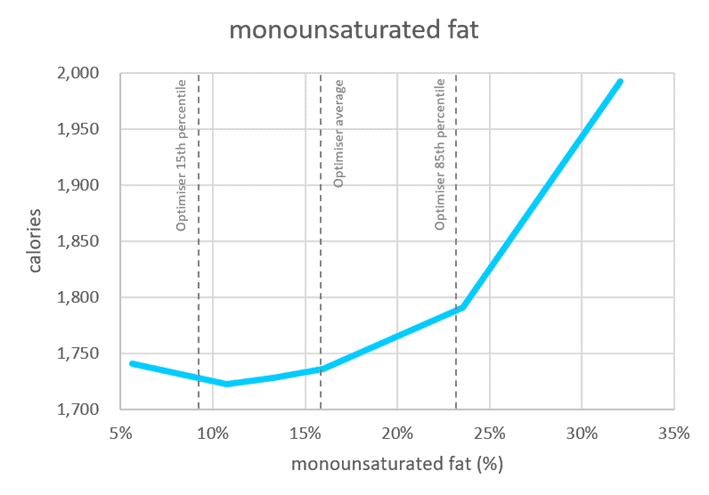
The availability of both monounsaturated fat and polyunsaturated fat has increased by around 300 calories per person per day over the past century. For more details, see Monounsaturated Fat: Is It So ‘Good’ After All?
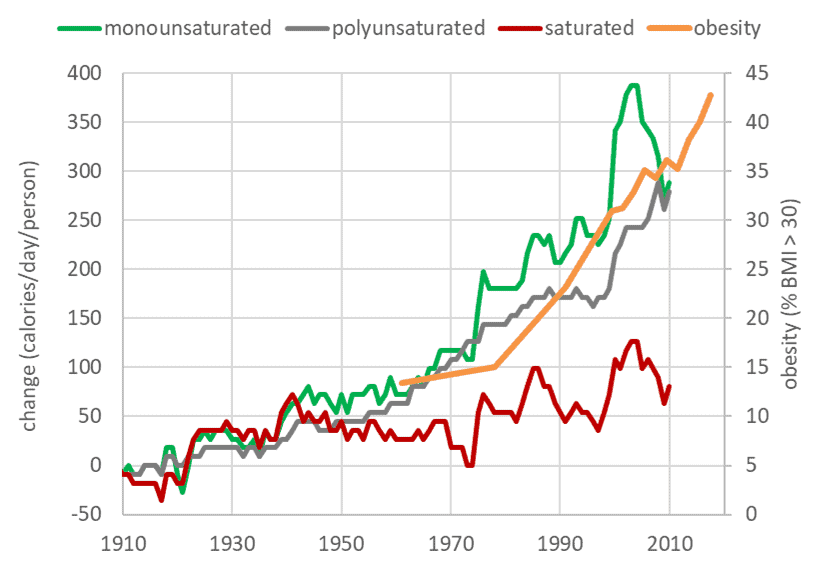
Processed plant oils that consist mainly of monounsaturated fat have become ubiquitous in our food system as cheap ingredients for energy-dense, nutrient-poor junk foods. As the chart below shows, added fats and oils have contributed significantly to the increase in calories over the past half-century.
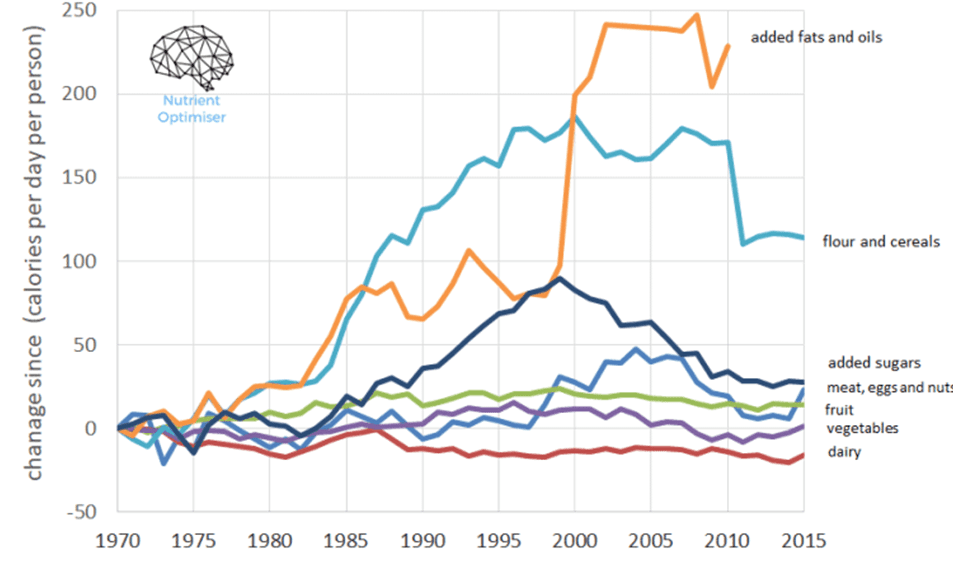
Although the sources of saturated fat like butter, dairy and lard have remained relatively unchanged, data from the USDA Economic Research Service shows that there has been a massive influx of ‘salad and cooking oils’.

Since we worked out how to extract oil from industrial crops at scale in 1908, the fat in our food system has increased by more than six hundred calories per person per day!
The chart below from Our World in Data shows that the production of industrial seed oils like palm, soybean, sunflower, and rapeseed has exploded from 20 million tons to 160 million tons per year since the 1960s.
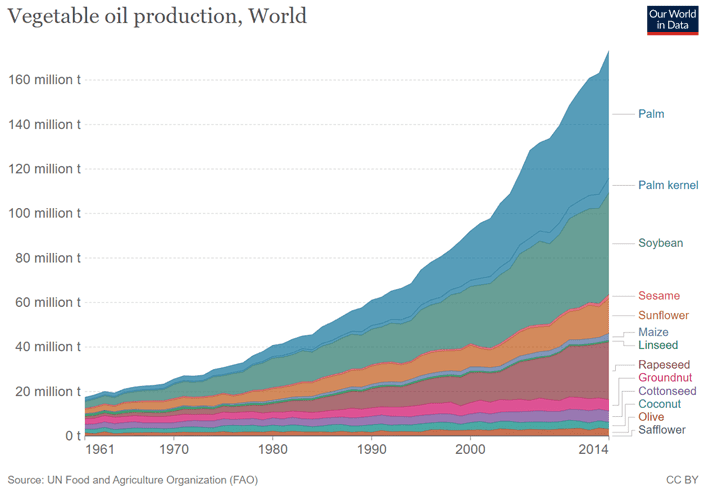
Given that these cheap, nutrient-poor oils have come to dominate our food system, does it really make sense to give them bonus points in the Food Compass nutrient profiling system while penalising saturated fat?
The satiety chart below shows no simple linear relationship between calories and saturated fat vs unsaturated fat. Instead, the maximum calorie intake aligns with a blend of saturated and unsaturated fat, which is uncommon in whole foods.

Summary
- A higher potassium:sodium ratio aligns with greater satiety. However, it does not appear to add any additional benefit as a ranking factor if we don’t prioritise excess sodium.
- The fibre:carb ratio does have a beneficial positive correlation with satiety. It is also a valuable differentiator between refined vs unprocessed carbs.
- The saturated:unsaturated fat ratio does not appear to be helpful. However, it seems we should minimise processed foods that contain a blend of the two.
Food-Based Ingredients
Food Compass has used several ranking factors based on the ingredients they contain, which I’ll offer some thoughts on individually in the following section.
Fruits
Fruits are good energy sources that are hard to overeat by themselves, but most don’t contain much in the way of nutrients per calorie.
For example, let’s look at the nutrient profile of watermelon, which ranks highly in the Food Compass chart system. Watermelon provides potassium, vitamin C and vitamins B5 and B6 but is lacking in many other essential nutrients, particularly protein.
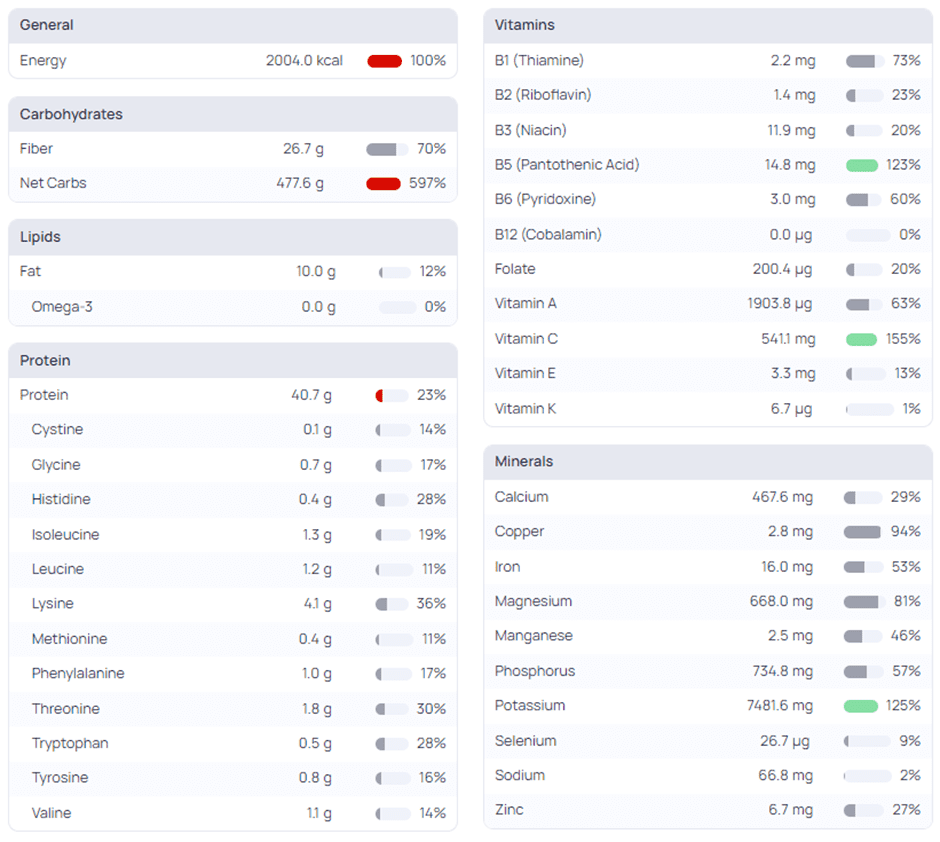
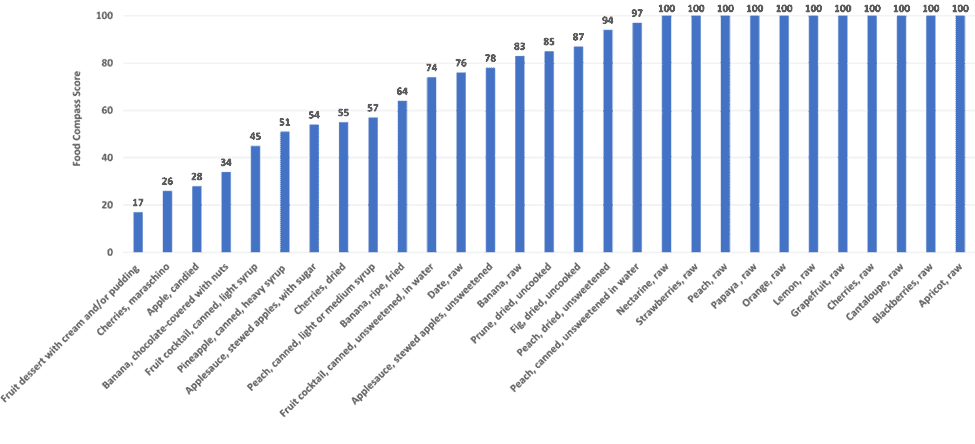
Despite the shortcomings, quite a few fruits, like apricots, blackberries, cantaloupe, cherries, grapefruit, lemon etc., score a 100 in the Food Compass ranking system.
Fruit and vegetable juices like celery and tomato are also ranked well per the Tufts Food Compass list. However, they’re absorbed very quickly and provide little satiety.

While fruit is undoubtedly better than ultra-processed junk food, there doesn’t appear to be any uniquely redeeming features to fruit that warrant bonus points in addition to vitamins and minerals.
Non-Starchy Vegetables
Non-starchy vegetables are included as a separate positive ranking factor by Food Compass. However, because they rank highly in terms of nutrients per calorie, non-starchy vegetables stand on their own merits without needing to be propped up with bonus points from an arbitrary food category.
Beans and Legumes
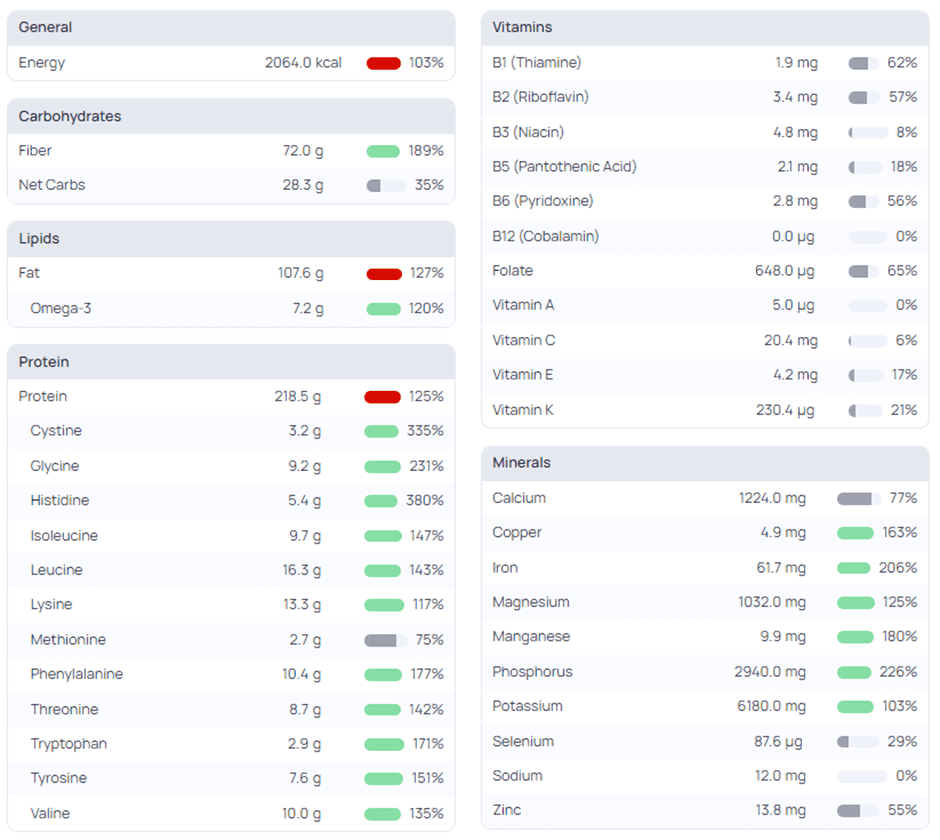
As shown in the Cronometer screenshot below, soybeans are a good source of protein and many of minerals. However, they are much lower in vitamins relative to meat and seafood. You’ll also need to consume a lot more calories to get the same amount of protein as you would from meat and seafood.
Whole Grains vs Refined Grains
Whole grains are certainly more nutritious than refined grains, which have been stripped of important nutrients during processing to make them more palatable. Despite this being used as a ranking factor, even fortified cereals like Cheerios scored incredibly well?!?! I believe this is another unwarranted category that skews the Food Compass rankings when fibre and nutrient density would be more than adequate.
Nuts and Seeds
Nuts and seeds are yet another criteria the Food Compass system uses to rank foods. While they are a great energy source—if you need it—most people find them easy to overeat.
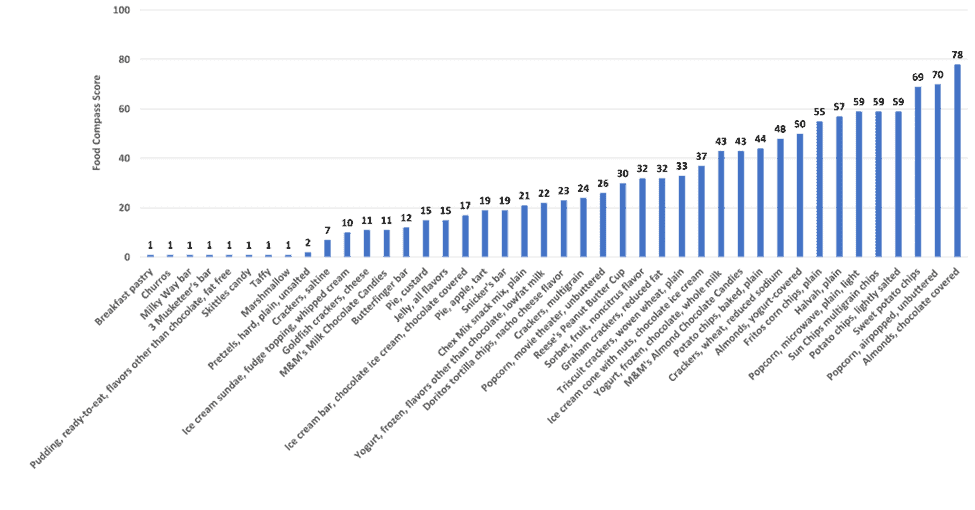
With some extra weighting on the nuts category, it might seem bizarre that chocolate-covered almonds made it to the top with a score of 78! I would love it if chocolate-coated almonds were a high-satiety superfood, but the reality is most people can these carb+fat combo foods all day and never feel full.
Seafood
In terms of nutrient density, seafood tends to rank highly. It is an excellent source of protein, omega-3 fatty acids, and a range of vitamins and minerals. However, it doesn’t need any additional help from from a bonus ranking factor! If we just let its nutrients speak for themselves, seafood does super well with respect to protein, vitamins, minerals, and essential fatty acids.
Yogurt
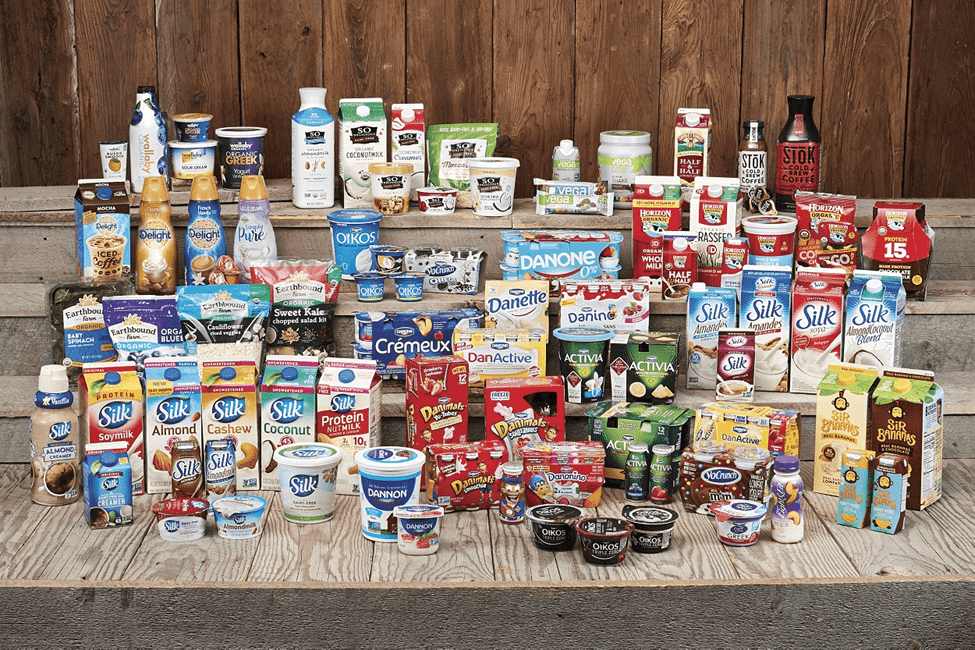
Yogurt can be a great source of calcium, bioavailable protein and prebiotics. However, it’s somewhat ironic that it’s been included as a specific ranking factor considering Danone funded Food Compass.
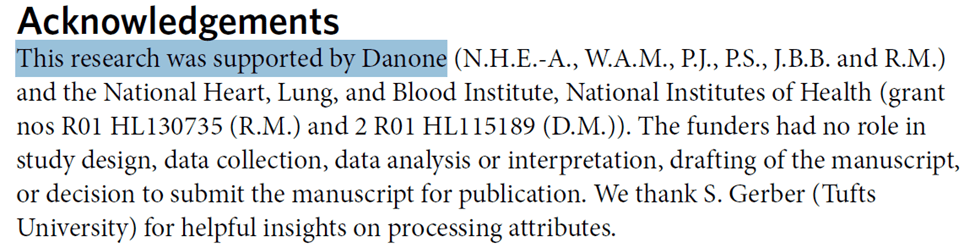
Perhaps they needed to add a new factor to reverse the unnecessary anti-saturated fat and cholesterol ranking factors that would otherwise penalise the dairy products of the study’s sponsor.
Plant Oils
As we discussed above, counting ‘plant oils’ extracted from industrial crops via hydrogenation as positive is unlikely to add significant value to a food ranking system. In fact, I think it is ludicrous given that modern ultra-processed food is packed with empty calories from ‘heart-healthy vegetable oils’ like palm oil, canola, soybean and rapeseed oil!
If you wanted to name a single smoking gun of the diabesity epidemic, you could reasonably point the finger at the 600 or so extra calories that have been added to our food system from plant oils alone.
Red or Processed Meat
Red meat is an emotive subject tied to sustainability and ethical beliefs. However, others on the opposite side of the belief system (i.e., carnivores) are eating nothing but steak and thriving.
Red meat can be a cost-effective source of protein for many people who are not getting enough. This is especially true in developing countries, where people can’t afford to eat a vegan diet AND buy supplements to avoid deficiencies.
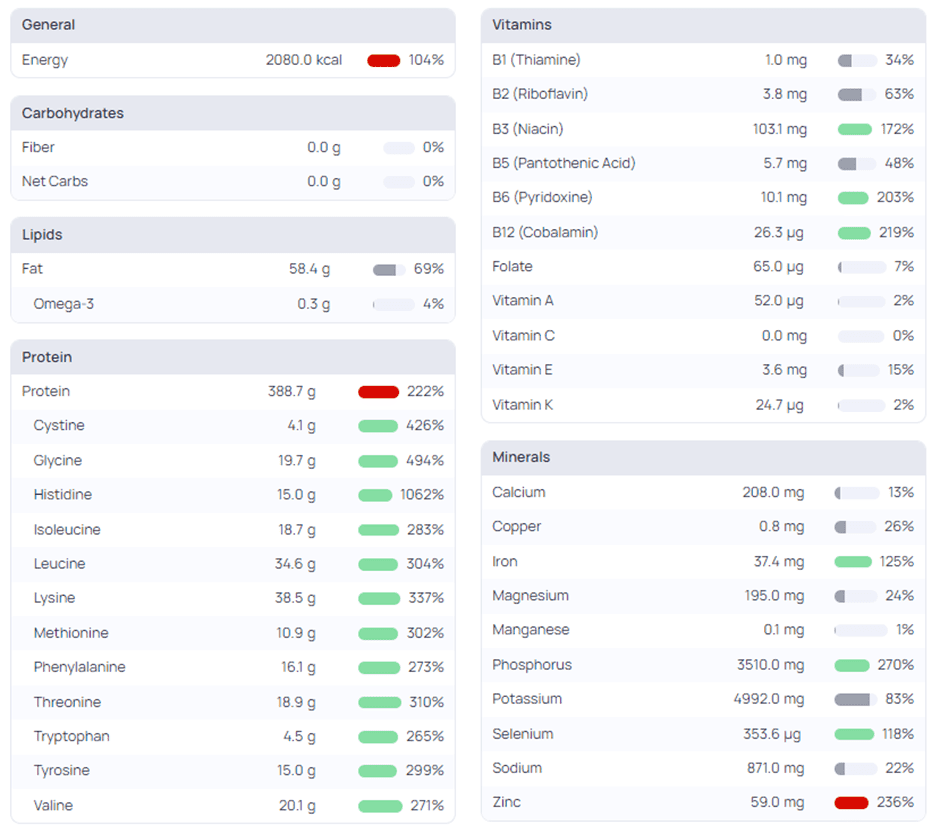
As shown in the Cronometer screenshot for sirloin steak, meat can provide substantial protein and other nutrients.
Processed meat is certainly not ideal. However, it tends to rank lower than whole foods when viewed through the lens of nutrient density anyway.
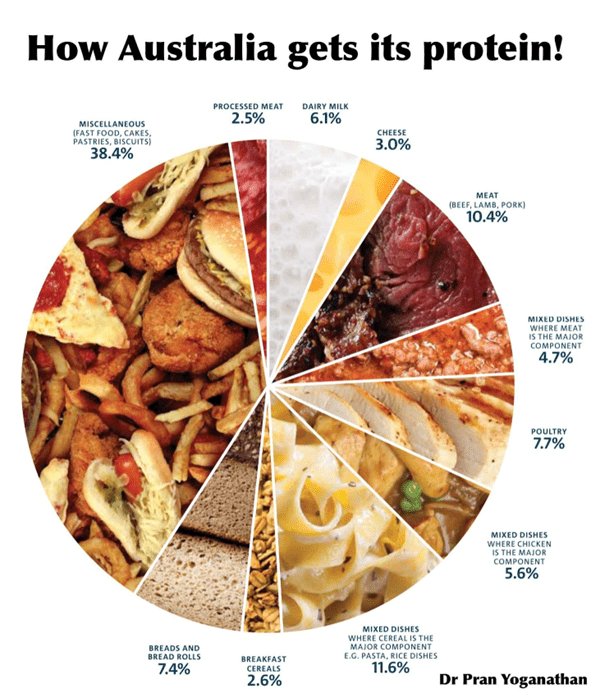
The image below from the CSIRO shows where Australians get their protein from. If you applied a nutrient-density filter to these protein sources, the heavily processed protein sources would fall to the bottom of the pile because they are diluted with refined carbs and industrial seed oils. Therefore, there is no need for an additional weighting factor to demote red meat.
Summary
These qualitative value judgements are unlikely to add value beyond focusing on nutritional quality. Instead, they reinforce the ‘conventional wisdom’ our food guidelines from fifty years ago directed us to eat.
Weighting these belief-based factors above parameters that we have statistically significant data for (e.g., protein %, fibre, minerals and vitamins) dilutes the usefulness Food Compass nutritional profiling system, which is why so many highly ranked foods appear non-sensical.
Specific Lipids
The specific lipids considered by Food Compass include:
- Dietary cholesterol,
- Alpha-linolenic acid (ALA),
- Omega-3 fatty acids,
- Medium-chain fatty acids (MCT), and
- Trans fats.
Omega-3 Fatty Acids
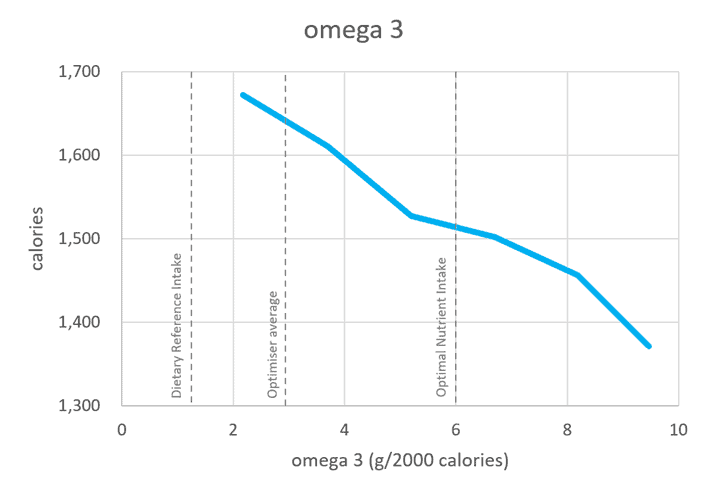
Our analysis shows that foods containing more omega-3 fatty acids align with greater satiety. Seafood is high in omega-3s, protein, and other beneficial vitamins and minerals. Because omega-3 is an essential nutrient that we appear to crave more of, it should be incorporated.
Trans Fats
The satiety response to trans fats is interesting. None seems to be better than some, but eating more of them does not necessarily mean you will consume more calories.

But if you’re focusing on nutrient-dense, minimally processed foods won’t consume substantial amounts of dangerous trans fats. However, trans fats from whole foods sources aren’t necessarily a concern.
ALA and MCTs
While they may be beneficial, data on alpha-linolenic acid and medium-chain fatty acids are generally hard to come by in food databases. Hence, if it is not regularly measured in food, it’s probably not good to use as a ranking factor for widespread use.
Cholesterol
Cholesterol is included in the Food Compass system as a negative ranking factor. But you may be surprised to see that foods that contain more dietary cholesterol align with greater satiety. Yep, you heard that right!
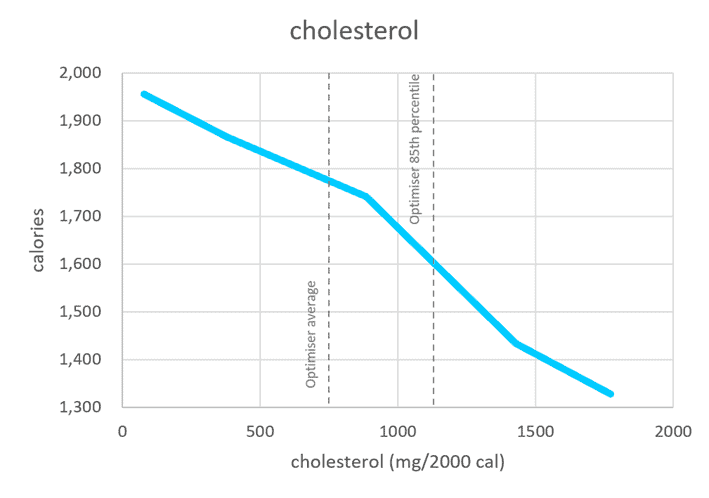
While not officially deemed an essential nutrient, some dietary cholesterol has beneficial effects on the body, like hormone synthesis. As the chart below shows, our cholesterol intake has declined since the release of the 1977 Dietary Goals for Americans that recommended we consume less fat and cholesterol and the explosion of widespread industrial farming. Sadly, obesity has exploded since then.
Despite the 2015 US Dietary Guidelines removing cholesterol as a nutrient of concern, Food Compass still used it as a negative ranking factor nearly six years later.
While there’s no need to go out of your way to consume more cholesterol, you also don’t have to fear nutrient-dense whole foods like liver, eggs, and beef that naturally contain it.
For more on cholesterol, see:
- Dietary Cholesterol and Blood Cholesterol: Are They Related?
- Cholesterol: When to Worry and What to Do About It
Multivariate Analysis
Interestingly, when we include all the essential nutrients in a multivariate analysis, foods that contain more cholesterol have a statistically significant relationship with satiety.
As shown in the , moving from low (0.2 g/2000 calories) to higher cholesterol (1.1 m/2000 calories) aligns with a 12% per cent reduction in calories!
| nutrient | 15th | 85th | % |
| protein (%) | 19% | 44% | -21% |
| cholesterol (g/2000 cal) | 0.2 | 1.1 | -12% |
| fibre (g/2000 cal) | 11 | 44 | -8.6% |
| potassium (g/2000 cal) | 1.9 | 5.9 | -5.5% |
| sodium (g/2000 cal) | 1.5 | 5.1 | -5.4% |
| calcium (g/2000 cal) | 0.45 | 1.9 | -3.8% |
It appears that some of the satiety response often attributed to protein may be due to cravings for cholesterol. Once we consider cholesterol, the satiety response to protein drops from 32% to 21%.
Summary
- It makes sense to include omega-3 as a beneficial ranking factor.
- Given the lack of data on trans fats, ALAs, and MCTs, adding them as individual ranking factors seems unnecessary.
- Since cholesterol is no longer considered a nutrient of concern, it should not be penalised as a negative ranking factor. In fact, our satiety analysis indicates that we crave foods containing cholesterol and will eat more calories if our food contains less of it.
Additives
Food Compass has also considered the following additives as individual ranking factors:
- Added sugar,
- Nitrites,
- Artificial sweeteners, flavours, or colours,
- Partially hydrogenated oils,
- Interesterified hydrogenated oils, and
- High-fructose corn syrup.
Additives are not ideal and seldom optimal but are seldom found in nutrient-dense whole foods. So if we simply focus on foods that contain all the nutrients, additives become irrelevant.
If I had my way, I would also include fortification as a negative ranking factor. Any food that requires fortification is likely a low-protein, low-fibre conglomerate of refined flour, sugar and industrial seed oils.
Instead, it appears that many fortified foods like breakfast cereals actually rank very well in the Food Compass system because they are fortified?!?!
Processing
Food Compass has also considered processing as an additional ranking factor.
NOVA Classification
Quantifying foods based on the level of processing may be helpful. However, it is unlikely to add additional value once we first quantify foods that naturally contain a broad spectrum of nutrients, especially protein and fibre.
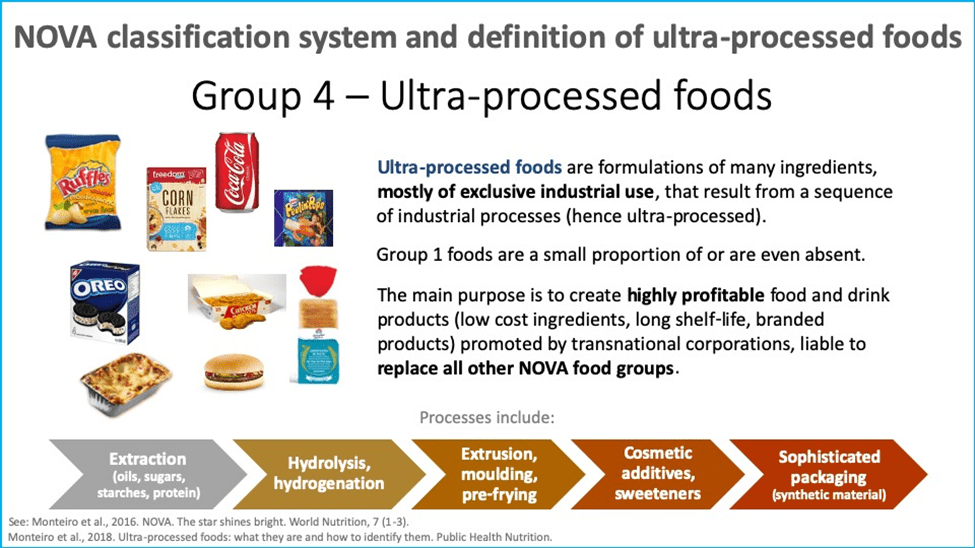
Ultra-processed foods are typically produced using large-scale industrial agricultural practices fueled by fossil fuel-based fertilisers. These practices grow crops quickly, but they accumulate fewer nutrients from the depleted soils they’re grown in year after year.
Our analysis shows that ultra-processed foods typically contain a mixture of energy sources like sugar, starch, monounsaturated fat and saturated fat together, which is unlike anything in nature. Again, simply prioritising adequate protein, fibre, vitamins, and minerals quickly eliminated ultra-processed foods.
For more details, see:
- Ultra-Processed Foods: What’s the Problem and How to Avoid Them, and
- Ultra-Processed Food: Modelling The ‘Hedonic Factor’.
Fermentation
Fermentation is generally a good thing. For example, in our Micros Masterclass, many people use sauerkraut to get more vitamin C or kombucha to boost their calcium intake. However, it is not necessarily useful as an additional ranking factor.
Frying
Again, frying is just a cooking method that becomes irrelevant once we consider nutrient density. Frying results in the accumulation of lots of fat, which dilutes nutrient density. Fried foods automatically fall to the bottom of the pile when you consider nutrients per calorie.
Phytochemicals
Food Compass also includes phytochemicals or compounds like flavonoids and carotenoids found in foods. While these are non-essential, they may be beneficial for health. Unfortunately, these are not commonly measured and thus unavailable in most nutrition databases.
Joel Furhman’s ANDI system relies heavily on parameters like phytochemicals. But because they are predominantly—if not exclusively—found in plant foods, they tend to be biased heavily towards a plant-based diet.
There is plenty of disagreement within the always-warring dietary camps about whether these non-essential plant compounds are beneficial or detrimental. But unfortunately, enough quantitative data is not yet available to understand these non-essential nutrients’ complex effects on the body.
By including parameters that are only measured for a small group of foods (i.e. fruits and some veggies) you’re effectively penalising every other food.
As a general rule, you will get plenty of beneficial non-essential nutrients like phytochemicals as bonuses if you consume plenty of nutrient-dense whole foods.
Summary
Our review of the Food Compass nutrient profiling system against our very own data-driven satiety analysis suggests that:
- Protein and fibre are included, but they are vastly underweighted if Food Compass’s goal is to promote nutrient density and satiety so we can begin reversing the diabesity epidemic.
- Promoting unsaturated fats while penalising cholesterol and saturated fat only perpetuates the increased use of nutrient-poor and refined vegetable oils that now contribute a significant proportion of the energy in modern ultra-processed foods.
- Including other factors like nutrient ratios, food-based ingredients, specific lipids, additives, and processing only dilutes the system and skews it towards more processed foods.
- Simply thinking in terms of essential nutrients—including fibre and amino acids—per calorie is more than adequate for ranking foods and meals that optimise satiety and support metabolic health.
More
- One Nutrient Density and Satiety Chart to Rule Them All
- High Satiety Index Foods: Which Ones Will Keep You Full with Fewer Calories?
- Highest Satiety Index Meals and Recipes
- The Perils of Belief-Based Nutrition
- Free 7-Day Nutrient Clarity Challenge
- What is Nutrient Density (and Why It Matters)?
- Free 7-Day Nutrient Clarity Challenge
- Macros Masterclass
- Micros Masterclass
Thank you for donning your scuba gear and taking the deep dive on this for us. 🙂
In a word, YES, the compass is broken! I read the Eureka Alerts paper on this when it first came out, looked at it, and said, “Oh no–yet ANOTHER food selection gimmick that tells us what we alreay know (or should know)”. Obviously, eating REAL foods is going to nourish us better than junk foods, and we don’t need another cutesy graphic telling us this. Apparently this is what you get with grant money! Anybody who actually cares about their health is way WAY beyond this point, and as you pointed out at length, this “compass” doesn’t go nearly into enough depth to be truly effective. Perhaps another grant or two would make that happen.
Meanwhile, the graphics dept. has once again cranked out an image telling us to avoid junk foods in favor of whole foods. Duh!
It’s funny–researchers STILL don’t seem to know enough about our food and how to put nutrition to its highest and best use, or are at least are unwilling to put it in print (“Oh–too complicated.”). Let’s see someone put THAT into one simple cutesy graphic! You have to use multiple graphics to do it, so what are THEIR chances?
Hi,
Thank you for this quite in depth work,
I think the compass is limited but your tool might be too. I still firmly believe the glycemic/insulin inducing capability of the foods, they impact on the gut microbiota, their relation to inflammation and oxidative stress should be factored in any food.
My dream would be to have a radar graph based on all the parameters with thresholds for the “limit this food” defined by age/sex/metabolic condition of each person (people with obesity might not need the same nutrients, energy or even food types as athletes).
Might need a big data approach for this to setup z-scores for each parameter but would definitely be more helpfull.
Now overall food must also be considered in terms of pleasure, satisfaction, user-friendliness (sweet potatoes are awesome but baking them makes them less appealing than a bunch of grapes for me).
But again, to be used it has to be simple. So I guess just sticking to energy-controlled mostly plant-based diet with from time to time low fat animal proteins with a control on added sodium and a mass of spices and there you go. Supplementation in B12 in any from would be necessary and a focus on certain micronutrients might be necessary (zinc, selenium, iron) to avoid any troubles. Then from there go see a nutritionist to adapt on the daily scale.
Cheers !
agree that keeping healthy blood sugars is an important factor. for people who have significant blood sugars, we also factor in the insulin index. see https://optimisingnutrition.com/what-affects-your-blood-sugar-and-insulin-other-than-carbs/
Now it is 2023, and I’ll say to you all what I said to Nina Teicholtz when she also wrote about this abomination of a food guide every time it resurfaces: Tufts University is a grant whore, and you have to look no further than who funds this study to see why sugary breakfast cereals rate higher than plain old ground beef. Tufts relies HEAVILY on federal funding and corporate money to carry out its so-called “research.” It’s actually reverse-research, in that a certain result is laid out as the goal, and the university is being paid to generate “evidence” to back it up. This, no doubt, pleases the shareholders of the various breakfast cereal conglomerates, so they buy more stock, get more red meat thrown at them in the way of rigged “research”, they buy yet more stock, and on and on…
Obviously, none of these people involved have been down the cereal aisle in the grocery stores lately–it’s got to be the loneliest place in the entire store! Is it any wonder this study was trotted out to the media? Probably more to the benefit of Kellogg’s, and other cereal makers than the university itself.
This project is more stock market manipulation than actual nutritional benefit.
thank you.
Wow. That is a shockingly difficult read, especially in 2023. As I even type this reply out, I see on the TV “they” are (once again) pushing “your” Covid “booster” shots. Big corporations equal big bucks equals big advertising dollars equals changing the normal in the minds of our youth. Shower enough on Internet, TV and the little print left and soon it will be taught and spoken of as gospel in our schools. Soon, a visit to McDonald’s will be higher on the list then a home prepared vegetarian meal. Just a matter of time. If the world can buy into Chinese TikTok, then the sky is the limit! No morals, just money.
My guess is that 5% of Americans care about this kind of thing enough to read this article or ones like it, rarely eat out, drink water by the litre, pursue a whole foods diet as organic as they can afford and avoid sugar and polyunsaturated oils like the plague. 15% may care what they feed themselves and their children but buy into Cheerios as health food, eat out frequently at chain restaurants, and have pantries full of poison. The remaining 80% don’t care that McDonalds does not qualify as a food group and is killing them one bite at a time, they drink liquified sugar by the 12-pack daily, only exercise to walk to the fridge or dial grub hub, and have no idea they are obese and/or diabetic. The degradation of our country, the dumbing down of our kids, the aggressive social behaviors (the whole world actually has these issues) is a direct result of big food’s impact on our gut, on our brain, on our health. The frog has been sitting in the pot for 50-75 years. The water is approaching a boil. If the frog does not get out now…it never will. Those of us that care need to lead by example and share our knowledge with anyone who shows an interest in regaining health…before the movie Wall-E becomes our reality.
Agree! I think we are heading towards a very dystopian profit-driven future. My hope is that a few who are interested will listen and learn to nourish their bodies with the nutrients they need. It’s hard to cut through the noise when there is so much money invested in what food we chose and little profit in telling people to get nutrients from meat, seafood and veggies.