
Are you aware that your fat-free lean mass is a primary determinant of your energy requirements?
The more lean mass you possess, the more you can eat and, consequently, the more nutrients you can garner. This piece explores the intriguing correlation between fat-free lean mass, energy consumption, and macronutrient distribution, shedding light on how one’s body composition dominates energy needs.
With the aid of substantial data, we unveil insights that could be instrumental in tailoring your nutritional regimen.
Dive in to understand how better to align your diet with your body’s inherent demands and optimize your nutritional intake.
In Professor John Blundell’s recent presentation at the Royal Society’s scientific meeting on Causes of Obesity: Theories, Conjectures and Evidence, he highlighted that:
- fat-free mass is the primary determinant of calorie intake and appetite; meanwhile
- our fat mass has a minimal correlation to energy intake.
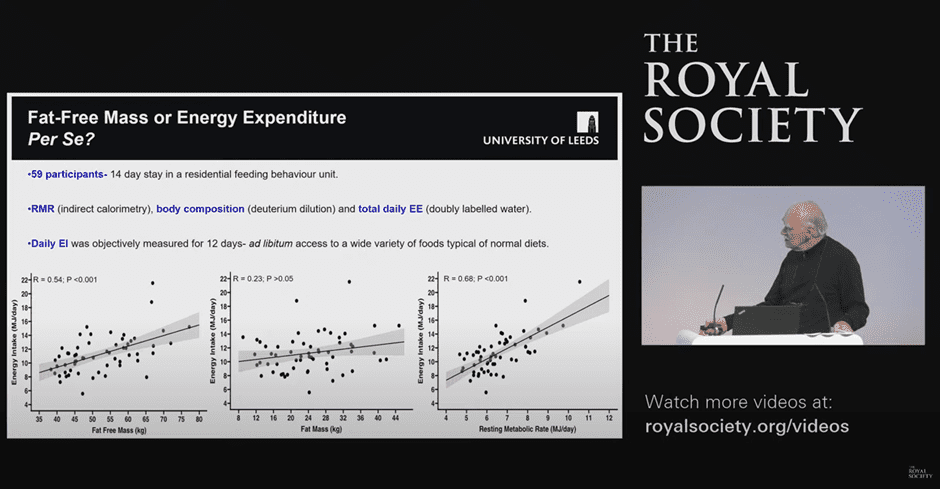
John’s research highlights that our appetite and energy intake predominantly exist to support our muscles and organs (i.e., our fat-free mass or FFM). Meanwhile, our body fat is an inert portable fuel tank.
Most of the time, we only consider the impact of activity, short-term fullness, and balancing blood glucose as the key factors that impact our need for energy from food. These are shown on the right-hand side of the figure below. However, our body composition and fat-free mass dominate our energy requirements. These factors are shown towards the left-hand side in the figure below.

You can watch John’s 15-minute presentation here (starting at 4:34) and read the paper detailing his research here.

Although fascinating, Professor Blundell’s data is from a study of 59 closely monitored human subjects and later 242 people monitored under free-living conditions. I thought it would be interesting to repeat this analysis using our Optimiser data to understand better our lean body mass’s influence on macros and overall energy intake.
Why Is This Important?
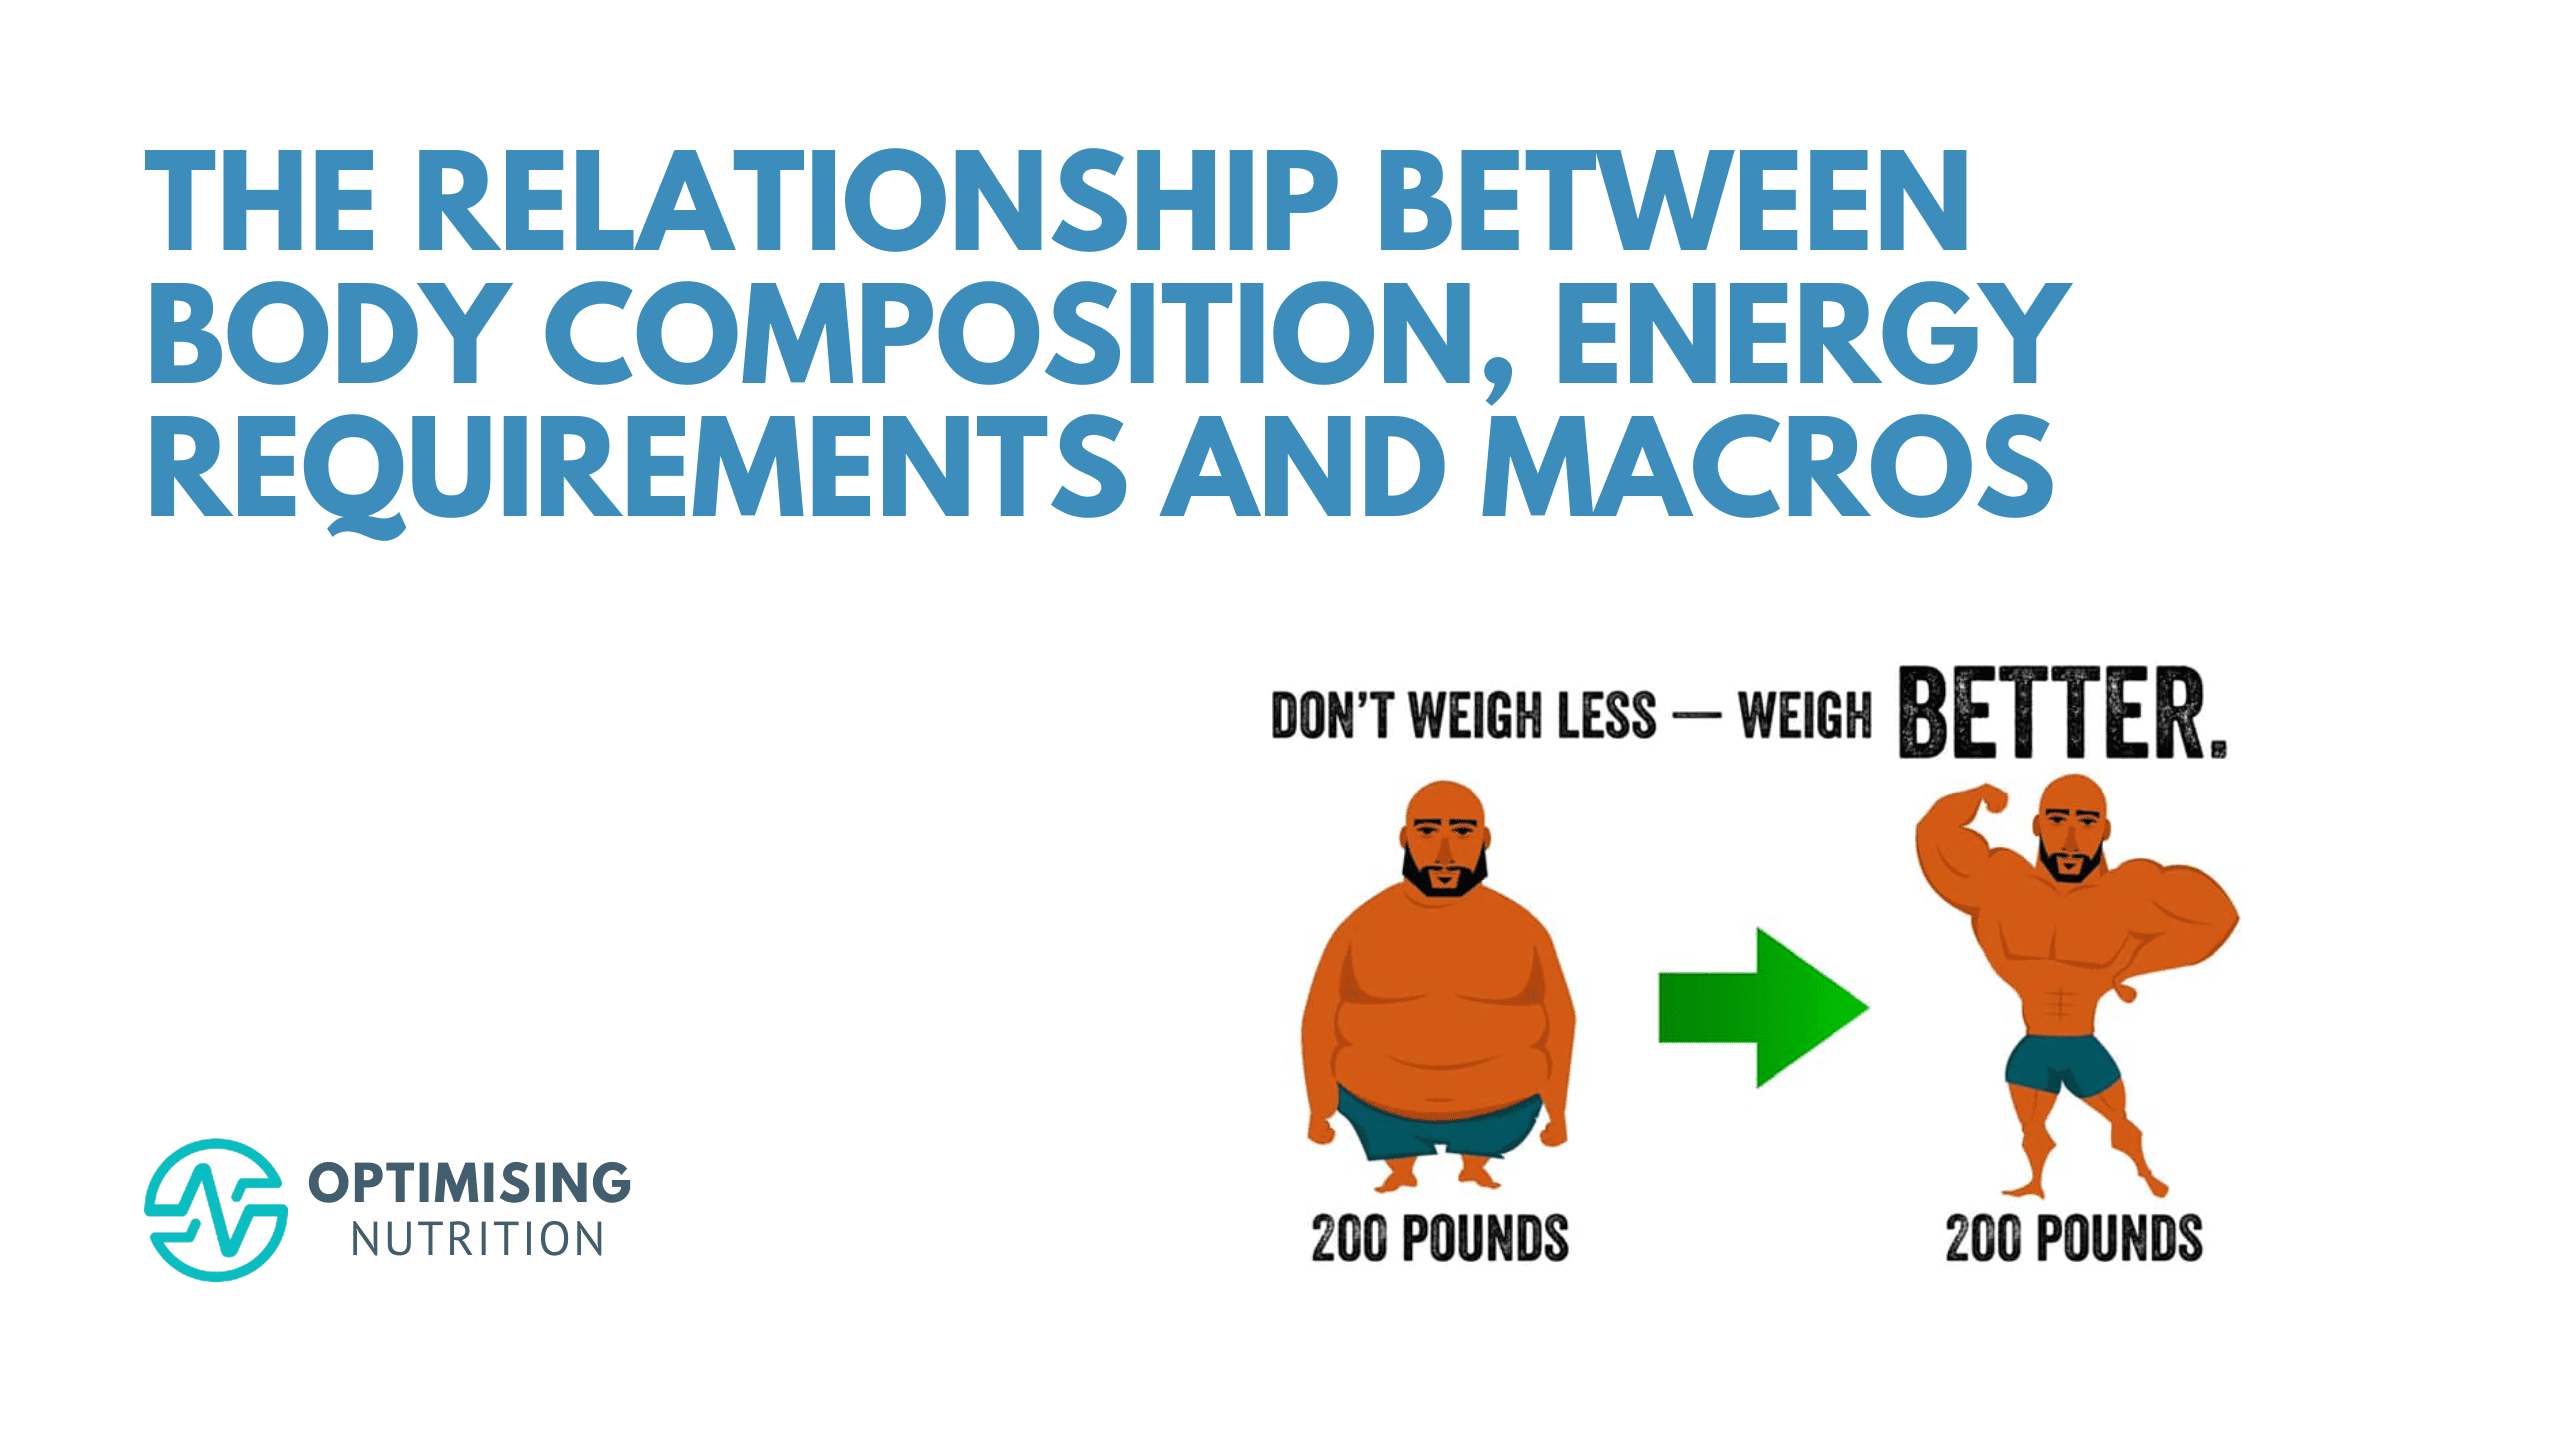
- People with more lean mass require more energy. But counterintuitively, people who carry more fat appear to require less energy.
- Maintaining a higher lean mass enables you to sustain a higher calorie flux (i.e., more energy in and out), get the protein and nutrients your body needs, increased satiety and appetite control.
- Your body’s energy requirements may plummet if you lose metabolically active lean mass through extended fasting, slashing calories, or the hormonal changes that occur as we age.
- If you want to lose weight, building and preserving lean mass is critical.
- While younger people can get away with a lower protein %, it becomes critical to emphasise protein as we age to increase satiety and avoid losing excessive lean mass, which downregulates metabolic rate. Resistance training is also helpful to tell your body that you need to keep your muscle rather than use it for fuel.
- Most macro calculators are often based on weight. However, our lean mass may be the only relevant parameter.
Optimiser Data
Over the past several years, we’ve accumulated one hundred and fifty thousand days of macro and micronutrient data from forty-five thousand Nutrient Optimiser users, which has been extremely helpful in answering some burning questions.
While some of these people participated in our Macros Masterclass, others have just tracked their everyday intake to identify their priority nutrients in our 7-Day Nutrient-Clarity Challenge.
Of that data, we have weight data for 11,187 Optimisers and body composition data for 1,179 Optimisers. While the accuracy of food data tracked through Cronometer and biometric data measured with bioimpedance scales is not as high as doubly labelled water and DEXA, the sheer volume of data still gives us some powerful and statistically significant insights.
Although our Optimisers didn’t use doubly labelled water and don’t live in a metabolic chamber, our dataset was taken from free-living people. So, this data is highly relevant to how you live and track your food!
Everyone’s interested to see how they compare, so before we dive into the analysis, let’s take a look at the basic stats from our Optimiser data.
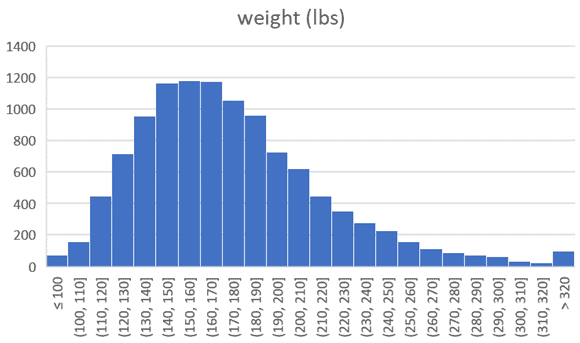
Weight
The weight of our average Optimiser is 176 lbs (or 79.9 kg), although this range is broad, as illustrated in the frequency distribution chart below.
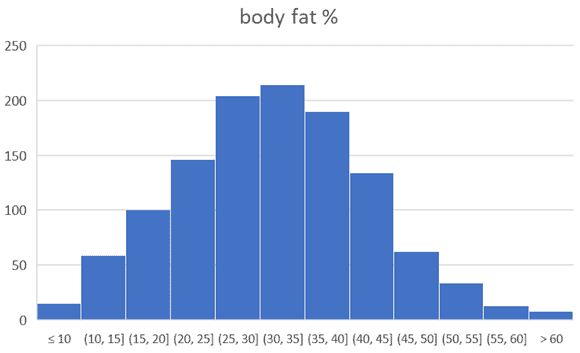
Body Fat %
The average body fat percentage of any given Optimiser is 32%, although it ranges widely from less than 10% to greater than 60%.
Fat-Free Mass
The average fat-free mass, or the weight of lean tissues like your muscle, organs, bone, and other fat-free tissues, is 142.7 lbs (64.8 kg). Fat-free mass is also known as FFM, lean mass, lean body mass, or LBM, and it accounts for your metabolically active tissues.

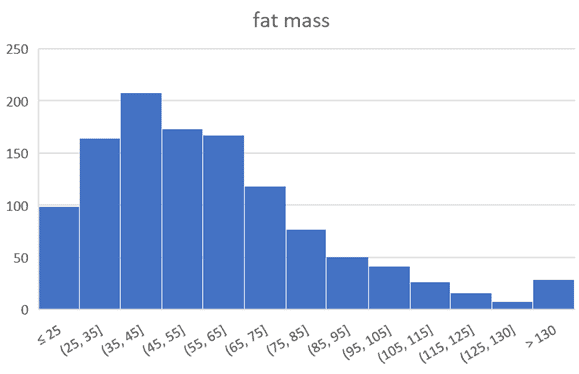
Fat Mass
Lastly, the average fat mass amongst our Optimisers is 57 lbs (26 kg).
Body Composition vs Calories
The data was imported into Tableau for charting. While there is a lot of data—and hence, a lot of scatter—all the relationships shown below are statistically significant (p < 0.0001).
Weight vs Energy Intake
The chart below shows weight vs calories. Unsurprisingly, larger people consume more calories. For every extra kilo of body weight above the mean, the average Optimiser consumes an additional 2.6 calories (or 1.2 calories per lb).
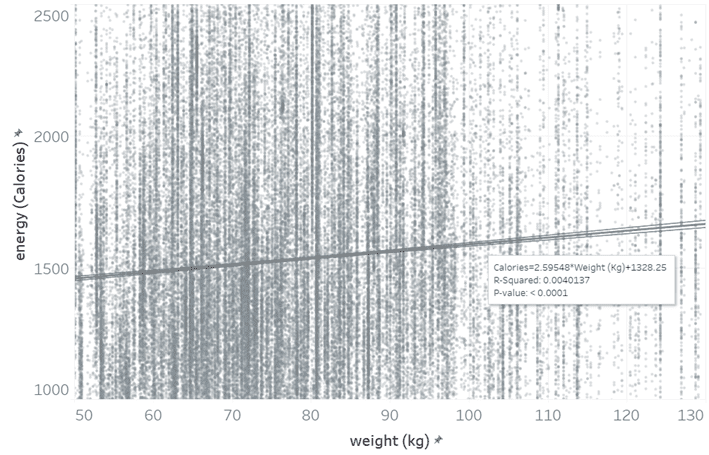
The average energy intake of our Optimisers is 1,532 calories.

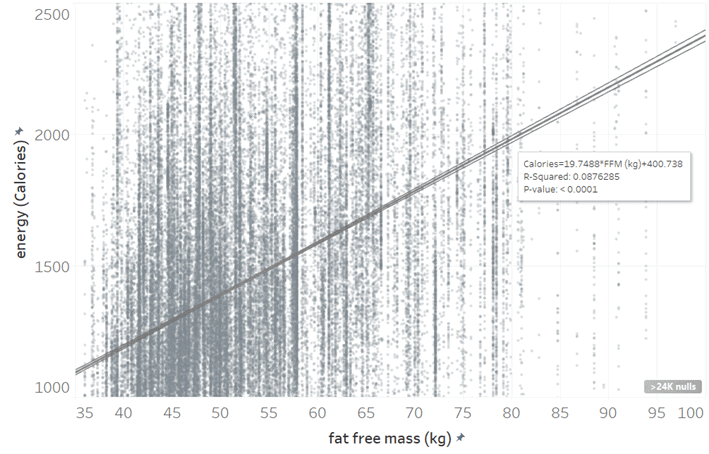
Fat-Free Mass vs Energy Intake
This gets a little more interesting when we plot fat-free mass vs energy intake. For every extra kilo of lean mass, Optimisers consume an extra 19.8 calories (or 9 calories per lb of LBM)! The gradient is MUCH steeper for FFM than weight.
Fat Mass vs Energy Intake
But the most intriguing observation was that people consume 9.8 fewer calories for every kilo of fat mass they hold!
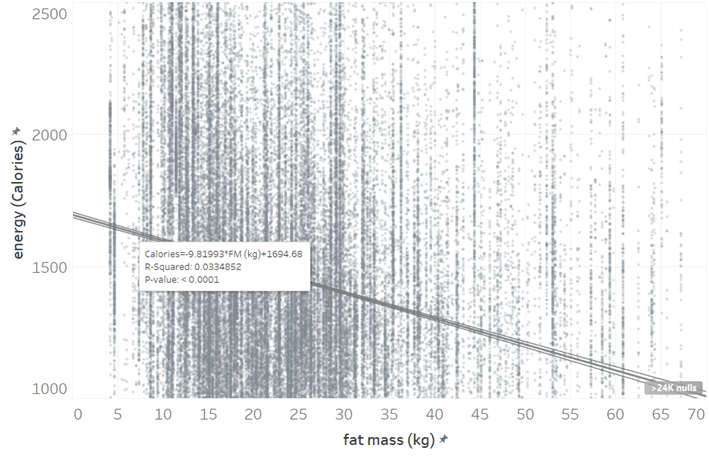
This surprising phenomenon could be because of one or several reasons, like:
- Some of the data is from Optimisers who were trying to lose weight in our Macros Masterclass and had cut calories to lose weight, or
- Appetite downregulates when we have significant amounts of stored fat mass; and
After the initial publication of this article, I sent it to Professor Blundell, who made the following comments:
I really enjoyed reading the analysis of your optimisers, particularly since it corroborates the relationship between FFM and EI under free-living conditions.
This is an impressive data set. This relationship is extremely robust and reliable even when the measurement of variables is not perfect.
The deductions from the studies indicate that the drive to eat emanates from FFM (and not FM), and that FM contributes little to this drive (it does contribute a bit through its effect on RMR) but FM does contribute to overall appetite control (inhibition through the well-established leptin-melanocortin pathway).
Interestingly your own data show a negative effect of FM on EI with low levels of FM being strongly inhibitory and larger amounts showing attenuated inhibition. We have demonstrated similar effects in a number of studies and our interpretation is that it is related to the degree of leptin and insulin resistance.
Lean people with low levels of FM are very leptin and insulin sensitive and this implies strong inhibition and good appetite control. As a person gains fat, leptin resistance begins to develop and the inhibitory action weakens; this means that the more FM a person has, the less help they get from their fat to control appetite.
However the main force of our studies is that FFM is the major driver of hunger and food intake. When FM is low there is a much better correspondence between energy needs and energy intake.
How to Calculate Your Energy Target Only Using Fat-Free Mass
There are many macro calculators that use different formulas. The analysis above highlights that equations like the Mifflin-St Jeor or Harris-Benedict that consider total weight are less accurate than those like the Katch-McArdle that also consider body composition.
Based on the analysis above, you could reasonably estimate your energy intake using only your fat-free mass. The equation is as follows:
Energy target (calories) = 19.8 x FFM + 400 = 19.8 x weight (kg) x (1 – BF%) + 400
If we plug it in and use numbers for someone who weighs 100 kg and is 20% body fat, we get:
Calorie target = 19.8 x 100 kg x (1 – 0.2) + 400 = 1,984 calories.
If you’re in the US, you will need to convert your weight in lb to kg by dividing by 2.2.
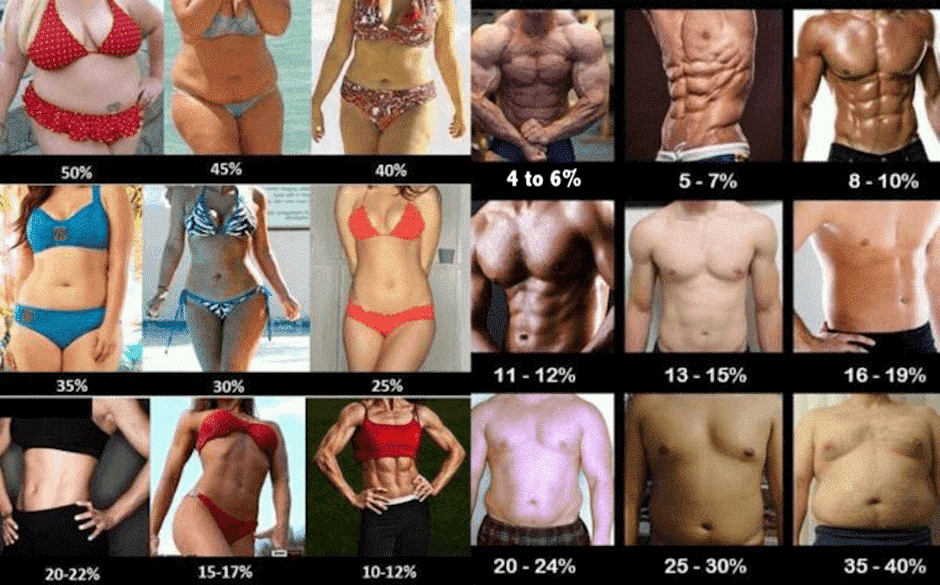
If you don’t have bioimpednace scales or DEXA, you can use the photos below to estimate your body fat %.
Overall, we find any macro calculator has limited accuracy. In our Macros Masterclass, the best way to determine the ideal macros for weight loss is to track your normal intake for a week to establish your baseline. From there, you can progressively dial back energy from fat and carbs while prioritising protein until you start making steady progress towards your goals.
Fat-Free Mass vs Macros (g)
Beyond simply considering calories, our Optimiser data also allows us to examine how fat-free mass influences our intake of protein, carbs, and fat.
Protein
As the chart below shows, Optimisers tend to eat an extra 1.54 grams of protein for every kilo of additional fat-free mass.
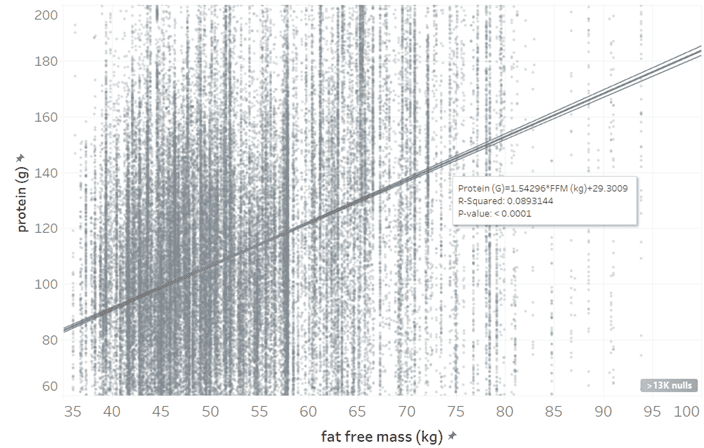
The following formula describes the gradient of the trendline (where FFM is in kg):
Protein (g) = 1.54 x FFM + 29
The chart below shows the range of protein intakes amongst our Optimiser data, with the average person consuming 2.1 grams per kilogram of lean body mass (LBM).
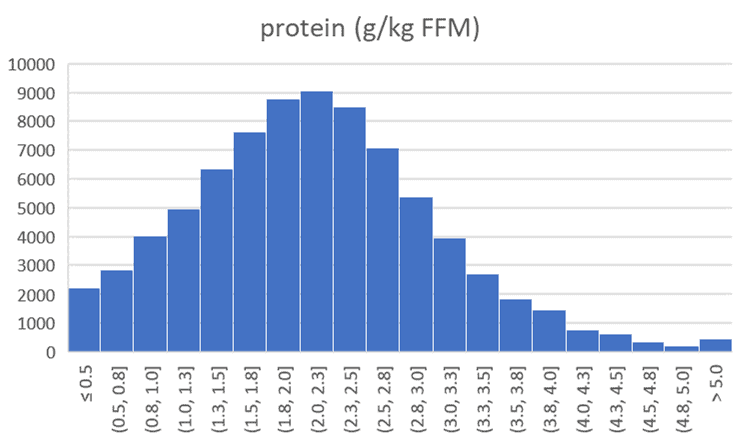
While the DRI minimum is set at 0.8 g/kg body weight (BW), we suggest people using our Data-Driven Fasting Challenges get at least 1.4 grams/kilogram LBM before trying to lose weight to maximise their chances of preserving lean mass.
Our macro calculator uses 1.8 grams/kilogram LBM as a default. Pushing much higher than this can be difficult to achieve for many while also maintaining an energy deficit.
In percentage terms, the average Optimiser’s protein intake is 31%.

The recurring theme of our analysis is that if you want to lose fat while preserving lean mass and improving satiety, you should err on the side of caution and try to consume a little more protein in terms of per cent and grams per kilogram LBM.
Once you work out your average intake, you want to dial back energy from fat and carbs while prioritising protein and keep your consumption (in grams) above your baseline intake if your goal is weight loss.
Next, we’ll look at how our Optimisers fill their remaining calories with energy from carbs and fat.
If your glucose after meals is elevated and rises more than 30 mg/dL (1.6 mmol/L) following a meal, it will be helpful to target fewer carbs and use more fat to fill your fuel gaps.
If your blood glucose is below this threshold, it doesn’t matter much where you get your non-protein energy.
Non-Fibre Carbohydrates
Our Optimisers consume an extra 0.7 grams of carbs per kilo of lean mass.
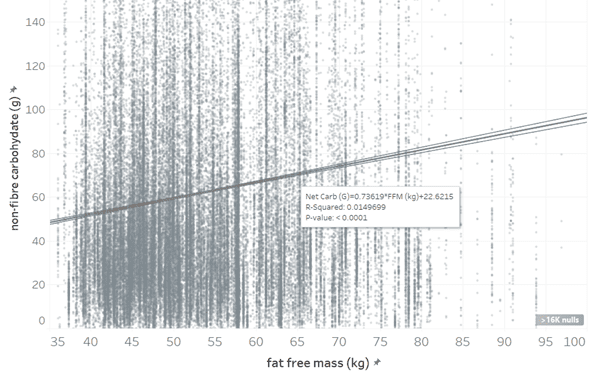
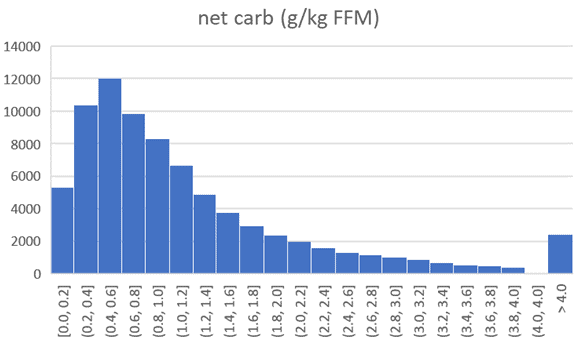
The average carb intake amongst this population is 64 grams or 1.1 grams/kilogram of LBM.
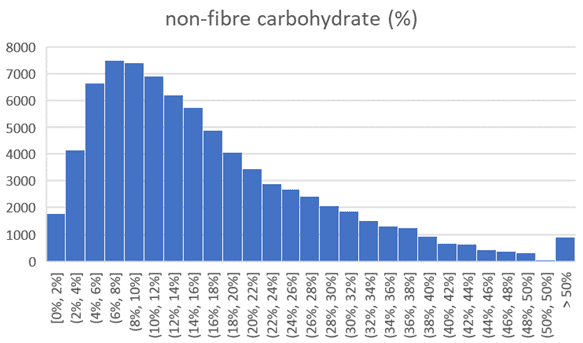
As you can see, our Optimisers tend to be on the lower carb end, with an average net carb intake of 16%.
The chart below details our satiety analysis findings and shows that this carb intake aligns nicely with the minimum overall calorie intake.
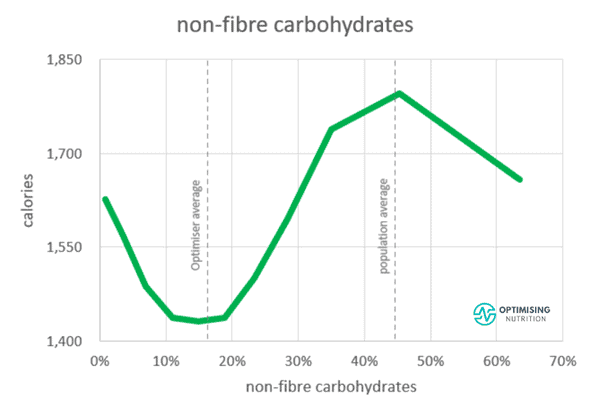
Because carbs are already low, we find most of our Optimisers need to dial back their fat intake. As we can see from the chart below, a lower fat intake also aligns with a lower overall calorie intake.
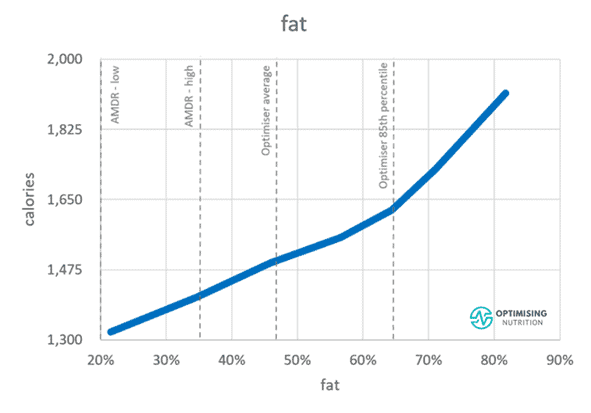
Fat
The chart below shows that our Optimisers consume an extra 1.1 grams of fat per kilogram of fat-free mass.

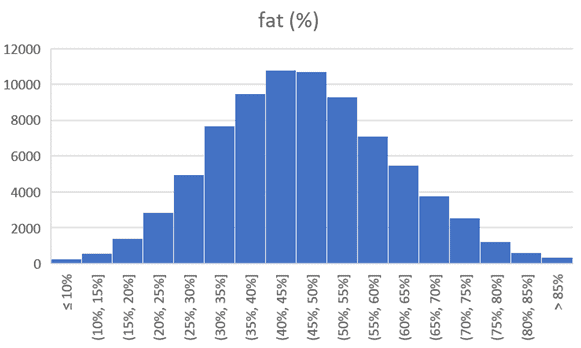
On average, Optimisers obtain 47% of their calories from fat.
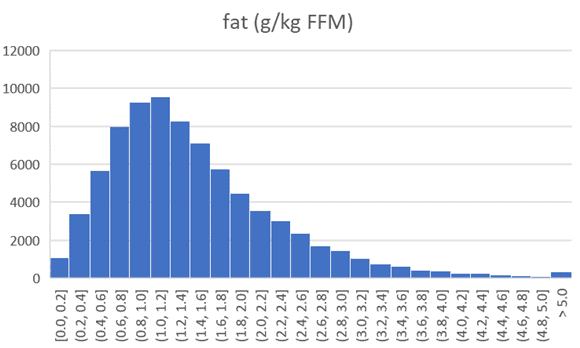
In lean body mass, the average Optimiser’s fat intake is 1.4 grams/kilogram LBM.
Summary
The table below summarises the average intakes of each macronutrient in terms of % of total calories, grams/kilogram of Free-Fat Mass and grams/pound of Free Fat ass calculated from our Optimiser data.
| Macro | % | g/kg FFM | g/lb FFM |
| Protein | 31% | 2.1 | 0.95 |
| Net Carbs | 16% | 1.1 | 0.5 |
| Fat | 47% | 1.4 | 0.64 |
If your goal is to lose fat without sacrificing precious fat-free mass, you’ll want to be on the high side for protein and on the low side for fat.
Why Your Fat-Free Mass is Important?
Most people want to lose weight. But quote Dr Gabrielle Lyon,
‘Muscle is the organ of longevity. Anabolic hormones [like testosterone and estrogen] start to decline in our 20s, and most of us become less active when we age.
While there is plenty of talk about magical hacks and elixirs for longevity, being as strong and resilient is a pretty safe bet and gives you better protection for a range of factors such as falls and immunity.’
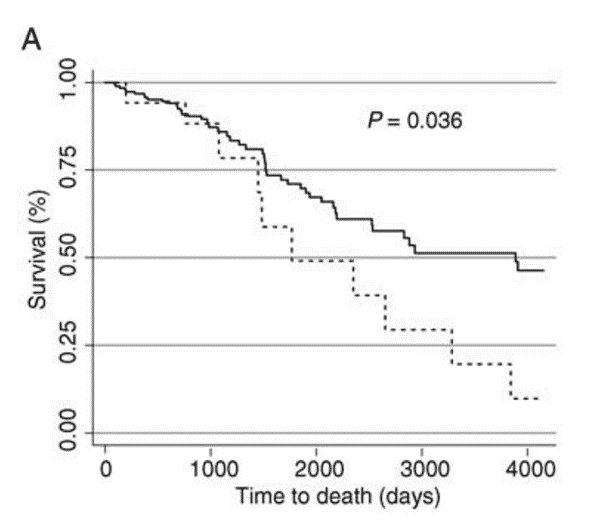
The chart below, taken from Low fat-free mass as a marker of mortality in community-dwelling healthy elderly subjects, shows the survival curves for people in the upper and lower quartiles of the Fat-Free Mass Index. People with more fat-free mass are much less likely to die of any cause!
Additionally, appetite also tends to decrease as we age. This is due to several factors, but the loss of fat-free mass is likely a significant contributor. As we’ve seen, carrying more fat-free mass enables you to eat more and inherently get more of the nutrients you need from the food you eat.
You can think of your fat-free mass like your 401k superannuation account for healthy again—you can have all the money in the bank, but it’s not worth much if you don’t have the health to enjoy it!
ooh..how exciting…
an example that’s really close to my numbers…
I like the Katch/McCardle also…
Yeehaw….
Cheers!
Excellent summary Marty, clear and concise. Thank you
Thanks Marcus! Glad you found it useful.