

Are you struggling with questions about tailoring your diet to meet your specific goals and confused about the so-called Acceptable Macronutrient Distribution (AMDR)?
Are you tired of one-size-fits-all approaches that don’t consider your unique needs?
If so, you’re not alone.
Many people find themselves adrift in a sea of conflicting advice when it comes to nutrition.
In a world where the latest dietary guidelines often provide a one-size-fits-all approach, it’s no wonder that questions about protein intake, the role of carbs, and dietary fat reduction keep popping up.
But fear not, because in this article, we’re diving deep into the world of macronutrients, offering you a data-driven approach to crafting a diet that suits your specific goals, whether weight loss, maintenance, or even weight gain.
We’ll explore the importance of protein, the delicate dance between carbs and fat, and how you can modify your macronutrient targets to create a diet that’s uniquely yours.
So, if you’re ready to break free from the cookie-cutter nutritional advice and discover how to personalize your diet for success, keep reading.
We’ll provide you with insights, suggested macronutrient ranges, and real-world data to guide you on your journey to a healthier, happier you.
Whether you’re looking to shed those extra pounds or fuel your active lifestyle, this article has something for everyone.
Let’s embark on this nutritional adventure together and unlock the secrets to a diet tailored just for you.
Suggested AMDR macronutrient ranges
If you want the how (not the why), check out the “quick start” macro guides shown in the tables below.
Weight gain
If you’re a growing teenager or a bulking athlete, the macros in the table below will help you eat more and gain weight.
| macro | target |
| protein | < 20% |
| fat | > 35% |
| carbs | 35 – 55% |
If you want to lose weight, you should avoid these macro ranges (i.e. lower protein, with a similar mix of fat and carbs).
Low fat
This table shows suggested macro targets for a healthy low-fat diet. For fat loss, move toward the “stretch targets” in the fat-loss column.
| macro | typical | fat loss |
| protein | 20% | 37% |
| fat | 15 – 30% | 30% |
| carbs | 50 – 65% | 33% |
Low carb
If you prefer a low-carb diet, the macro distribution ranges below are appropriate. Again, for fat loss, move toward the fat loss stretch targets.
| macro | typical | fat loss |
| protein | 22% | 40% |
| fat | 60% | 35% |
| carb | 18% | 25% |
For more detail on how we arrived at these macro ranges tailored for different goals… read on.
The Acceptable Macronutrient Distribution Ranges (AMDR)
The table below shows the macronutrient targets (recently reissued in March 2021) set by the Dietary Guidelines for Americans (2020 – 2025).
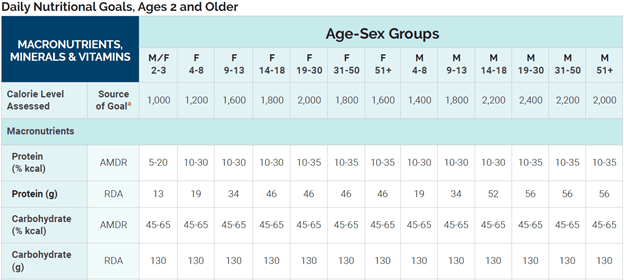
If you can’t read the fine print, the table below summarises the macro targets for adults.
| macro | min | max | RDA |
| protein | 10% | 35% | F – 46 g M – 56 g |
| fat | 20% | 35% | – |
| carb | 45% | 65% | 130 g |
No consideration of goals
Sadly, the official Acceptable Macronutrient Distribution Ranges (AMDR) do not consider an individual’s goals or context (weight loss, weight gain, or maintenance). They take a “one size fits all” approach without considering the powerful effect of what you eat on your ability to manage your appetite.
Unfortunately, the Dietary Guidelines (created by the US Department of Agriculture) tend to reflect how the general population currently eats, with a nudge towards more products of industrial agriculture (not necessarily your health or goals such as weight loss or improving nutrient density). They recommended a minimum carbohydrate intake (RDA) of 130 g per day, with a minimum protein intake of 46 g for women and 56 g for men.
If you are part of the growing majority of people who need to lose weight, the USDA guidelines (and the dieticians that enforce them) recommend that you simply “eat less and move more”.
Despite the large proportion of the population thriving on a lower-carb diet, the Dietary Guidelines ignore it as a valid option.
Why does this matter?
You may or may not have heard of the Acceptable Macronutrient Distribution Ranges (AMDR) or the Dietary Guidelines, but they are a big deal. They guide the food provided to those in schools, jails, hospitals, nursing homes, and many other institutions.
Dieticians are bound to work within these sanctioned guidelines. So, any inherent flaws or omissions become a causative public health issue, not merely a question of taste or preference.
The Data
Nearly three years ago, we published this article analysis of 587,187 days of data logged by 9.9k people in MyFitnessPal (MFP). It yielded some fascinating insights into our satiety response to the food we eat.

The data enables us to see some clear trends in the factors that influence how much we eat.
- Rather than housing a few people in a hospital ward for a few weeks (or mice in a cage), this data represents how people eat in the real world.
- This MFP data represents seven months of nearly ten thousand global users logging food choices spanning cultures, preferences, quality musts, and accessibility and illustrates how humans eat in the real world.
- People logging their food are typically trying to lose weight, so this data singularly represents that population’s intake. However, their information inferentially demonstrates that food choices influence success in either gaining or losing body fat and meeting respective weight goals.
- We subsequently published a separate analysis looking at the satiety response to macronutrients and micronutrients of people using Nutrient Optimiser that aligned with our conclusions from the satiety analysis. Due to nutrient leverage (both macronutrients and micronutrients), WHAT we eat has a significant impact on HOW MUCH we eat.
How do most people eat?
First, let’s look at how the MFP data aligns with the USDA Dietary Guidelines’ Acceptable Macronutrient Ranges (AMDR). How consistently do we follow the recommendations of the Dietary Guidelines in the real world? Or, to ask another way, how closely do the Dietary Guidelines correlate with how people typically eat?
Protein
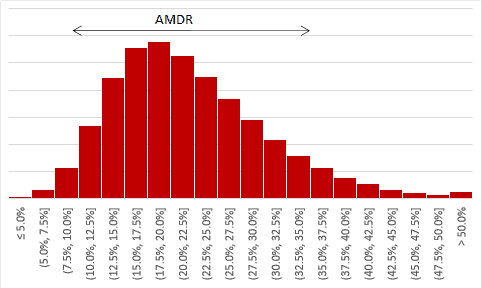
As shown in the frequency distribution chart below:
- People logging in MyFitnessPal consumed an average of 22% protein.
- The majority (88%) of the data from MyFitnessPal users lies within the AMDR range for protein (i.e., 10% to 35%).
- 4% are eating less than the 10% minimum AMDR target,
- 8% are consuming more than the 35% maximum AMDR target.
For comparison with the general population (who aren’t tracking their food), the chart below (created using data from the USDA Economic Research Service) shows that the percentage of dietary protein has changed in our food system over the last century.
- The average protein intake is on the bottom end of the AMDR range for protein of 10 to 35%.
- Protein intake was at its lowest (10.5%) in 1930 during the Great Depression.
- Since the introduction of the 1977 Dietary Guidelines for Americans (published by the US Dept of AGRICULTURE), protein intake has reduced from 13% to 11.5%.
- Looking to the right of the chart, we can see that, in line with the Protein Leverage Hypothesis, the reduction in protein since the publication of the original Dietary Guidelines aligns with an increase in obesity (data from the Centres for Disease Control).

Fat
The next chart shows the distribution of fat intake for the 9.9K MFP users:
- The average fat intake is 35%, which aligns with the upper limit of the AMDR.
- Less than half of the data (47%) lies within the AMDR range for fat (20 to 35%).
- 7% of people are consuming less than the lower AMDR limit (20%)
- 46% are consuming more than the AMDR upper limit (35%).

The fat content of foods produced for Americans has constantly risen since 1908 when a newly-patented process introduced cheap hydrogenated industrial seed oils made from soy and corn. In 2010, fuel from fat was the source of 43% of total energy.
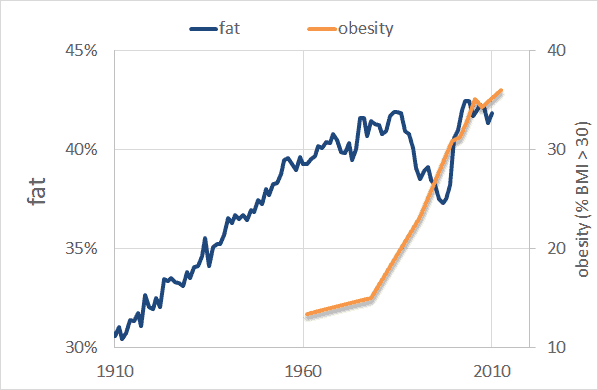
The average fat content of the food produced in the US has not been below the 35% upper limit set by the Dietary Guidelines since 1936. It seems we enjoy foods that have more energy from fat, and food manufacturers love to sell them to us, especially when they are becoming cheaper and cheaper to make due to agricultural subsidies and large-scale industrial agriculture.
Carbs
How have carbs fared according to the data?
- The average carb intake of MFP users is 43%.
- There is a fairly large spread of carb intake. Only 43% of the data lies within the AMDR range of 45 to 65% carbohydrate.
- Only 3% of MFP users consume more than the 65% AMDR upper limit for carbs.
- The majority of MFP trackers (54%) consume less than the 45% AMDR lower limit for carbs.

As shown in the chart below, the US population’s carb intake decreased to about 46% of calories over the past century from a high of 58%.

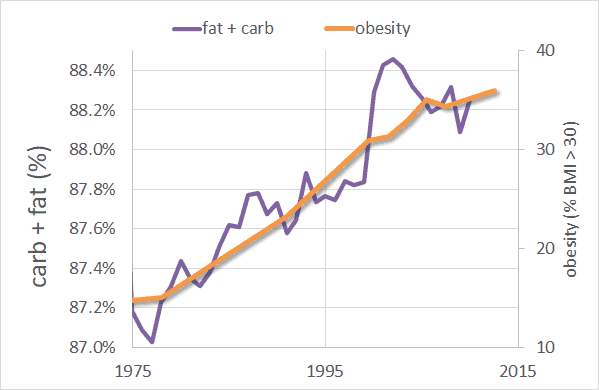
Fat + carbs
In the chart above, if you only looked at the correlation between carb intake and obesity from 1990 to 2000, you could conclude that carbs are the culprit for the diabesity epidemic. But when we look at the big picture, we see that, over the longer term, carbs have decreased, and fat has increased. Both macros now rank at similar levels.

The rise in obesity actually aligns with a period where the availability of fat and carbs has risen in our food system over the past half-century.
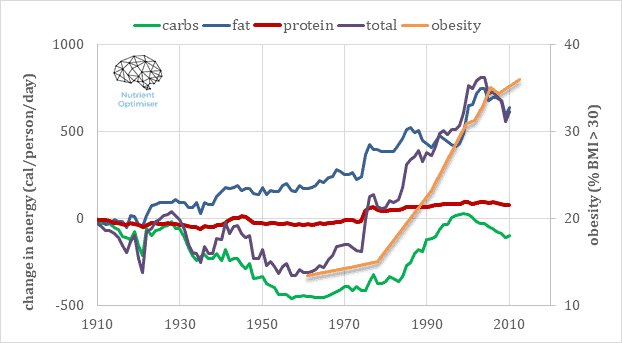
If we zoom in on the period when the obesity epidemic seemingly went viral, we see it dovetails with the increase in non-protein energy. As fat and carbs replace protein in the food system, satiety diminishes, and we eat more in the pursuit of the nutrients our bodies require (i.e. protein leverage).
Satiety response to macros
This data analysis starts to get interesting when we look at the satiety response to the different macronutrients (i.e., protein, carbs, and fat).
MyFitnessPal users identify their target calorie intake in the app (usually about 15% below their theoretical Basal Metabolic Rate). Using this data, we can see how varying macronutrients across the spectrum gives us a better or worse chance of meeting our calorie targets.
Protein
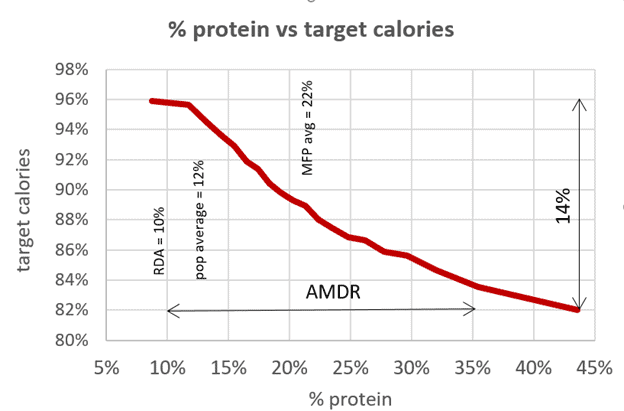
The chart below shows protein % vs. daily calorie intake divided by target calories. It appears that the percentage of protein in your diet highly correlates with successfully staying under your calorie target for the day.
- A higher percentage of dietary protein gives us a better chance of meeting our calorie goals.
- Although all of the MFP users were likely trying to eat less, people who consumed a higher protein percentage tended to consume 14% fewer calories than those who consumed the lowest protein percentage.
- To the left of the chart, we see that the Recommended Daily Allowance (RDA) for protein aligns with the lowest satiety and highest energy intake.
The chart below, created from 40k days of people using Nutrient Optimiser, shows a similar trend. A higher percentage of protein aligns with a lower overall intake. Optimisers who were consuming 65% protein consumed 40% less than their daily energy requirements for maintenance, while Optimisers consuming 15% protein consumed 20% more than their Basal Metabolic Rate!

Protein: Energy Ratio
Another way of expressing protein content, popularised recently by Optimising Nutrition Advisor Dr Ted Naiman, is the protein: energy ratio (or P:E).
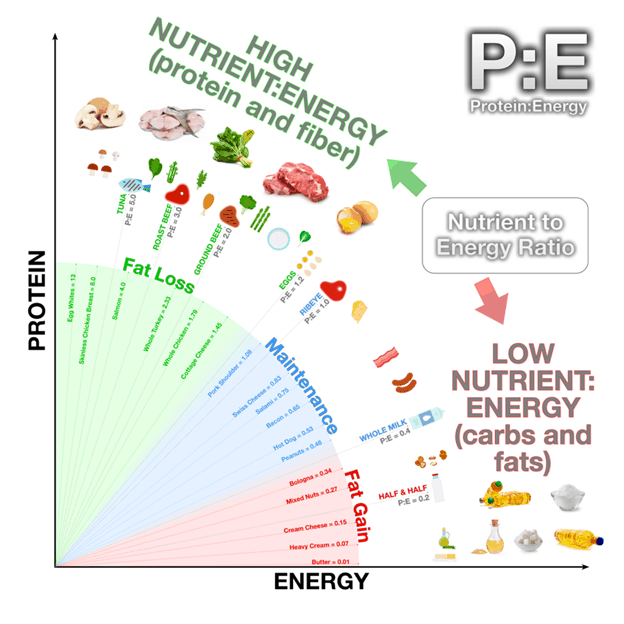
The chart below shows the protein: energy ratio vs. success in reducing calorie intake. As with protein percentage, a higher P:E aligns with greater satiety.
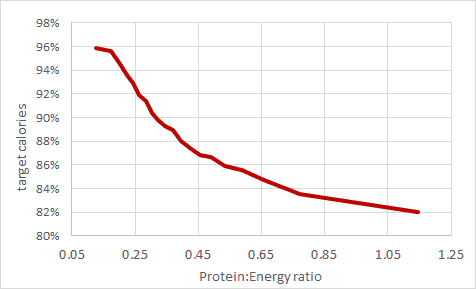
For reference, the average P: E ratio of MFP users was 0.42. Not many people consistently achieve a P: E higher than 1.0.

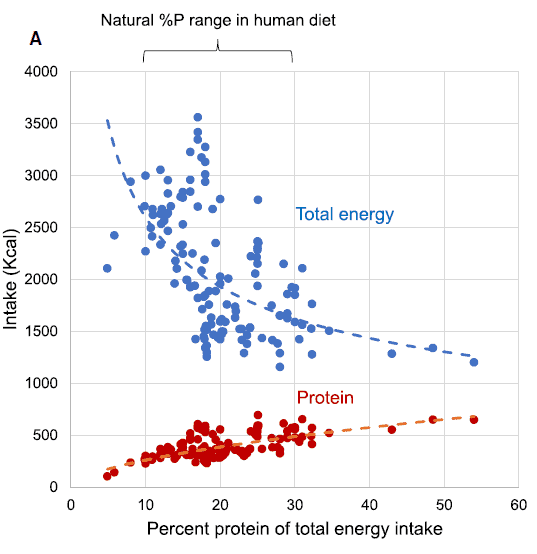
Protein leverage
The chart below shows the relationship between protein % and total energy intake in a compilation of human clinical experiments (from Protein Leverage: Theoretical Foundations and Ten Points of Clarification by professors David Raubenheimer and Stephen Simpson, published in Obesity, 2019). Although protein intake is marginally higher when we increase protein percentage, the protein leverages a much larger reduction in total energy intake!
Has protein dilution fueled the diabesity epidemic?
Remember reading in a previous chart that the percentage of protein in the US food system has dropped from about 13% in 1977 to 11.5% due to the increase in ultra-processed foods (i.e., manufactured products of large-scale industrial agriculture)? One reason appears in the protein vs. satiety chart below as a 1.9% increase in energy intake (i.e., protein leverage) at a population level. Professors Raubenheimer and Simpson noted in their 2005 paper Obesity: The Protein Leverage Hypothesis that this shift in protein % is enough to explain the obesity epidemic.

If we want to lose weight, we will benefit from increasing the percentage of protein in our diet but not necessarily by eating MORE protein. Protein often comes packaged with fat, so simply adding more protein often leads to a greater energy intake. The key to leveraging satiety is prioritising protein and dialling back our intake of fat and carbs, thereby avoiding over-fueling.
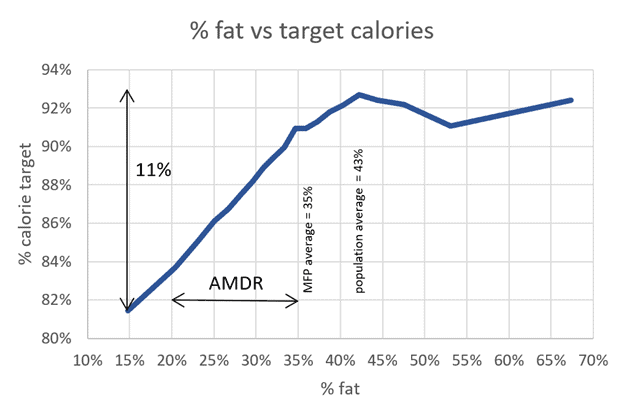
Fat
When it comes to fat, the analysis of the data from MFP users shows that:
- A lower fat intake correlates with a lower energy intake.
- The average population intake of fat aligns with the highest energy intake.
- Reducing fat intake to 15% would trigger an 11% reduction in calories (i.e., not as much protein but still significant).
As much as I wanted to believe that I could eat fat to satiety back in my keto days, it just isn’t true.

Carbohydrates
Where things get interesting is when we look at carbohydrates.
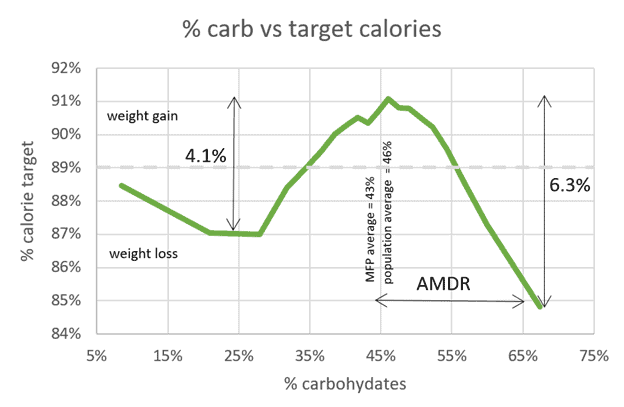
- Maximum energy intake tends to align with around 46% of energy from carbohydrates (i.e., the lower end of the AMDR).
- The population average carb intake (46%) and the MFP average (43%) tend to mesh with the most significant energy intake.
- Increasing carb intake to greater than 65% correlates with a 6.3% reduction in energy, while reducing carbs aligns with an energy reduction of 4.1%.
- On the right-hand side of the chart, we see that satiety increases once we increase carbs above 50% of calories due to the reduction in dietary fat.
- However, on the left-hand side, we discover that lower-carb is not necessarily better. If you prefer a lower-carb diet, a 20 – 30% carb intake tends to align with the best satiety outcome. Moving to the very low-carb end of the spectrum tends to eliminate fibrous non-starchy veggies and foods with more fibre which tend to be bulky and hard to overeat.
- While not as significant as the change in energy intake due to increasing protein per cent, moving outside the range of 35 to 55% carbs has considerable potential to increase satiety and allow you to eat less.
Before the advent of agriculture, food availability varied. More carbs were available in summer and closer to the equator, and more fat in winter or closer to the poles.

When it comes to carbs, you need to pick a side (at least on a meal-to-meal basis) – either lower-carb or higher-carb. It isn’t necessarily a matter of carbs being good or bad; you need to get your energy from somewhere. Rather, it’s the unnatural combination of carbs and fat not found in nature that leads us to overeat compulsively.
If we need to keep out of the danger zone of carb+fat combined, perhaps it would be useful to have bespoke guidelines for people who follow a low-carb or high-carb diet.
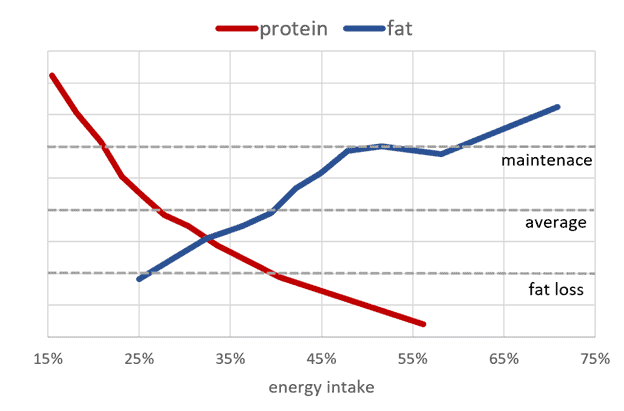
What are the best macros for weight gain?
The chart below shows the satiety response to protein, carbs, and fat on the same chart. While there’s no hard and fast cut-off point, as a general rule, if your macro profile is above the dotted line, you’ll likely eat more and hence gain weight.

If your goal is to gain weight (i.e., growing child, a bulking bodybuilder, or someone recovering from anorexia nervosa), you should follow the macros in the table below.
| macro | target |
| protein | < 20% |
| fat | > 25% |
| carbs | 35 – 55% |
Women – weight gain
The table below suggests an optimal macro split for a ‘typical’ woman (who requires 2200 calories to maintain her weight) with a 10% energy surplus to see what this looks like in absolute terms.
| macro | weight gain |
| protein (g) | < 110 |
| fat (g) | 60 – 110 |
| carb (g) | 190 – 300 |
Men – weight gain
The table below shows suggested macros for weight gain for a typical man (who requires 2400 calories per day for weight maintenance) with a 10% energy surplus.
| macro | weight gain |
| protein (g) | < 130 |
| fat (g) | 70 – 130 |
| carb (g) | 230 – 360 |
How should your macro targets vary on low fat vs. low carb diets?
While there are some people who are clinically underweight, the reality is that most people are looking to push their weight downwards.

Protein
Our decision to keep to either side of the carb+fat danger zone beggars the following question: how much protein should I consume? Of course, the answer depends on your context and goals.
- Are you active?
- Do you want to lose body fat?
- Do you want to preserve muscle?
- Do you already have a lot of lean muscle mass to support?
- Do you prefer consuming a low-carb or high-carb diet?
Your appetite will generally ensure you eat enough protein to meet your requirements. Just be vigilant that you don’t over-consume energy in the hunt for the nutrients your body needs to thrive.
Do you need to eat ANY carbs?
No. You don’t need to eat carbs.
There is no such thing as an essential carbohydrate.
But your body does need glucose.
- Although the Recommended Daily Allowance for carbohydrates was set (by the US Department of AGRICULTURE) at 130 g per day, your body can produce the glucose it needs from protein via gluconeogenesis. There are plenty of examples of people who appear to be thriving with negligible dietary carbohydrates. However, if you follow a very low-carb diet, you will likely require a bit more protein to supply some of the glucose you need.
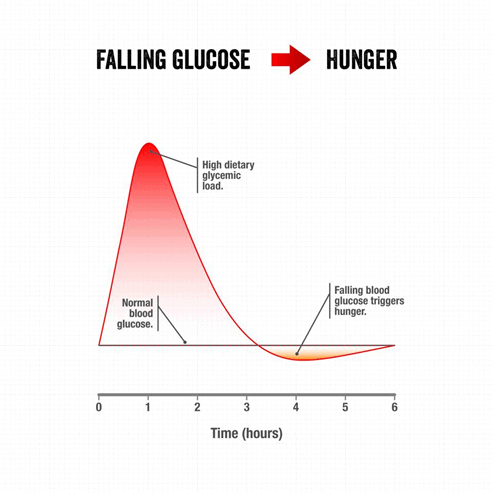
- If you have elevated blood glucose, it doesn’t make sense to base your diet on processed carbohydrates. The blood sugar rollercoaster caused by high doses of fast-acting carbs makes people overly hungry. Their blood sugar comes crashing down, driving them to eat more than they otherwise would or should. The antidote is to reduce your carb intake until you achieve stable, healthy blood sugars (i.e., a rise of less than 30 mg/dL or 1.6 mmol/L after meals).
- However, it may be beneficial to prioritise in carbohydrates if you are lean and active to fuel your activity more efficiently. It’s a lot of work for your body to convert protein to carbohydrate, and it is a rate-limited process. Protein also tends to be a more expensive fuel.
To better understand target macros for people who prefer a low-carb or a low-fat diet, I divided the MFP data into two separate groups, each one containing one-third of the MFP data. The lower-carb group were consuming less than 40% carb while the lower lower-fat group was consuming less than 30% fat
Nutrition is often seen as complex because there are many moving parts, but many people identify with a low-carb or low-fat diet. Depending on our preferences, how should we prioritise fat and carbs?
Low carb
The chart below shows the satiety response curve for the low-carb diet. We can see that:
- average protein intake = 27%, and
- average fat intake = 45%.
The MFP average appears as a dotted line through the middle of the chart. Mindful that the MFP users are typically trying to lose weight, I have also shown a line representing weight maintenance on a lower-carb diet. If you want to lose weight, you should move down the graph by reducing dietary fat and increasing the percentage of protein. It’s worth noting that the highest satiety outcome on a lower-carb diet doesn’t come from further limiting carbs but from reducing dietary fat and increasing protein.
Target macros – low carb
The table below shows suggested macro guidelines for weight maintenance and a stretch target for fat loss on a low-carb diet.
| macro | maintenance | fat loss |
| protein | 22% | 40% |
| fat | 60% | 35% |
| carb | 18% | 25% |
Women – low-carb
This table shows the grams-per-macronutrient necessary for a typical woman to maintain her weight and an aggressive 30% energy deficit.
| macro | maintenance | fat loss |
| protein (g) | 110 | 140 |
| fat (g) | 133 | 54 |
| carb (g) | 90 | 88 |
Men – low-carb
The following table shows the grams-per-macronutrient necessary for a typical man to maintain her weight and an aggressive 30% energy deficit.
| macro | maintenance | fat loss |
| protein (g) | 132 | 168 |
| fat (g) | 160 | 65 |
| carb (g) | 108 | 105 |
It’s important to note that absolute protein intake only increases by 27%, while dietary fat drops to approximately a third of maintenance intake.
To reiterate, satiety is not so much about increasing protein, but in a low-carb context, decreasing dietary fat to allow stored body fat to be used.
Low fat
For the MFP users consuming a low-fat diet (less than 30% fat):
- Average protein = 24% (i.e., less than the 24% for the low-carb group),
- Average carbs = 52%.

Again, as well as fat averages for the MFP users, I have shown the typical fat loss lines.
- If you want to eat less to lose weight, you will derive the most significant satiety impact from dialling up protein % and dialling down carbohydrates.
- Increasing carbohydrate towards 70% with a very low-fat diet has some positive satiety effect (if you can achieve it). However, the most significant satiety effects result from lowering both dietary fat and carbs.

Target macros – low fat
The table below shows suggested macro ranges on a low-fat dietary approach. If your goal is fat loss, you should move towards the macros shown in the fat loss column by reducing carbs, which will automatically increase the protein % of your diet.
| macro | maintenance | fat loss |
| protein | 20% | 37% |
| fat | 15 – 30% | 30% |
| carbs | 50 – 65% | 33% |
Women – low fat
The table below exemplifies what this could look like in absolute terms for a typical adult woman in maintenance mode vs. an aggressive 30% deficit.
| macro | maintenance | fat loss |
| protein (g) | 100 | 130 |
| fat (g) | 33 – 67 | 47 |
| carb (g) | 63 – 250 | 116 |
Men – low fat
The table below shows what this might look like in absolute terms for a typical adult man in maintenance mode vs. an aggressive 30% deficit.
| macro | maintenance | fat loss |
| protein (g) | 120 | 155 |
| fat (g) | 40 – 80 | 56 |
| carb (g) | 75 – 300 | 139 |
In the low-fat scenario, the increase in protein is modest compared to reducing carbohydrates, allowing the body fat to burn its fat stores.
Comparison with low-carb and dietary guidelines
The low-fat approach correlates with a slightly lower protein intake than the low-carb approach (approximately 10%). This is likely because some of the protein on a low-carb diet is being used to create glucose via gluconeogenesis.
However, what is more interesting is that the protein intake for maintenance is more than two times higher than the Dietary Guidelines Recommended Daily Allowance for healthy weight maintenance and three times higher for weight loss!
It’s important to remember that the RDA for protein (i.e. 46 g for women and 56 g for men) is an absolute minimum to prevent diseases of deficiency. It does not align with greater satiety, weight loss or nutrient density.
Mixing it up
Rather than sticking exclusively to low-fat or low-carb macros, you can even mix it up – you just need to ensure that individual meals stay out of the carb+fat danger zone.
Many people have maximised their nutritional profiles and ensured they don’t overeat simply by staying out of the energy-toxic carb+fat danger zone on a meal-by-meal basis.
If your blood sugars are stable, you could choose to focus your low-fat, higher-carb meals around your workouts to replenish glycogen and opt for a lower-carb meal when you don’t need the glucose to fuel your performance. Quickly refilling depleted glycogen stores helps avoid overconsuming hyperpalatable fat+carb comfort foods after exercise.
Alternating your fuel sources between carbs and fat typically leads to greater sustainability and long-term adherence, more flexibility and variety in food options, and a better nutrient profile (see Metabolic flexibility: How to give your body what it needs when it needs it for more detail).
Our Data-Driven Fasting app includes a feature that guides people to build their meals around whole-food carbs when their blood glucose is significantly lower than normal.
Take it slowly
When setting your target macros, it’s important to remember that you only need to change enough to get the results you want to see.
Jumping from 10% to 50% protein will drive a calorie deficit that may be hard to sustain (even though it will provide greater satiety per calorie). So, while it may be doable for a few days, you may find yourself in a restrict-binge-restrict cycle later as your body drives you to get the energy it needs.
Before changing your macros, we recommend you track your current food intake in Cronometer for a few days to understand your typical baseline macro profile. Based on this data, you can make incremental adjustments as necessary. If you’re able to lose weight at a rate of at least 0.5% per week, there’s no need to change what you’re doing.
We designed the Nutrient Optimiser Smart Macros Algorithm to suggest incremental changes for the upcoming week based on your progress. In addition to dialling back refined carbs and fats, Nutrient Optimiser identifies nutrient-dense foods and meals that suit your goals.
We always find that, beyond simply thinking in terms of macros, prioritising foods and meals that contain all the nutrients you need reduces cravings and further increases satiety. While amino acids (i.e. protein) have the most potent impact on satiety, our data analysis indicates that all of the essential nutrients play a role (i.e. micronutrient leverage).
If you’re interested in trying Nutrient Optimiser (and 600+ of our NutriBoosters recipes), consider joining the next Macros Masterclass and learn how to optimise your macro and micronutrients in a supportive, like-minded community.
Suggested macro targets
To summarise, Acceptable Macronutrient Distribution Ranges recommended by the Dietary Guidelines favour the higher-carb end of the nutrition spectrum. However, the reality is that most people gravitate to the hyper-palatable fat+carb combos that promote energy toxicity and diabesity.
Once we accept the importance of avoiding foods and meals in the hyper-palatable fat+carb danger zone, we can create macronutrient targets for either the low-carb or low-fat scenarios.
Weight gain
If you want to gain weight, you can follow the macros shown in the table below. However, if you are part of the growing majority of the population who want to lose weight, you should avoid this dietary scenario with lower protein and a similar blend of fat and carbs.
| macro | target |
| protein | < 20% |
| fat | > 25% |
| carbs | 35 – 55% |
Lower fat
If you don’t want to gain weight and prefer a low-fat diet (i.e. less than 30% fat), the macro distribution ranges would be appropriate. If your goal is fat loss, then you can move towards fat loss.
| macro | maintenance | fat loss |
| protein | 20% | 37% |
| fat | 15 – 30% | 30% |
| carbs | 50 – 65% | 33% |
Lower carb
If you prefer a low-carb diet (i.e. less than 40% carbs), use the suggested macro targets in the table below. If your goal is fat loss, move towards fat loss.
| macro | maintenance | fat loss |
| protein | 22% | 40% |
| fat | 45% | 35% |
| carbs | 28% | 25% |
AMDR series
Read the rest of our series reviewing the AMDRs:
- The “Acceptable” Macronutrient Ranges (AMDRs) for Protein, Fat and Carbs
- Carbohydrates – The Optimal vs Acceptable Macronutrient Distribution Range (AMDR)
- Fat – Optimal vs Acceptable Macronutrient Distribution Range (AMDR)
- Protein – Optimal vs Acceptable Macronutrient Distribution Range (AMDR)
More
- Protein Power: Visualizing 30g in Everyday Foods
- Low-Carb vs. Low-Fat Diets for Satiety, Weight Loss and Nutrient Density
- Metabolic flexibility: How to give your body what it needs when it needs it
- Keto, Low Carb, or Satiety: Navigating Your Diet Choices
- The satiety index (updated)
- The fascinating relationship between macro and micronutrients in the food you eat
- Macronutrients [Macros Masterclass FAQ #2]
- Macros Masterclass
GREAT read and very timely for what I’m thinking about for my next step in Optimizing my Nutrition. Thanks so much, Marty!
thanks Audrey. glad you found it useful. hope it helps you reach your goals.
Wonderful, Marty…
Recommend that all living humans read it!
Cheers!
Bob
Thank you so much for posting this — it is eye-opening for me, and also very timely. I just had the penny drop that I need to abort my recent ultra-low-fat diet experiment. After nearly a decade on the low-carb end, for the past ~7 months I’ve been consuming ~10g fat per day most days, and otherwise ~30% protein (mostly nonfat dairy, well tolerated) with the balance from fruit, butternut squash, honey, molasses. However, some binging did happen involving sugar and rarely fat+sugar.
This has been a disaster — the gut issues it was supposed to have improved have worsened, along with a host of troubling autoimmune and neurological and other issues (ranging from cramps/dystonia to short-term memory issues to polyuria), and I’ve gained ~5lbs, which seems to be mostly inflammation.
It was great for the first month or two, but after that I wasn’t experiencing the satiety I expected from the higher protein. It appears that I could have been consuming a lot more fat and still be considered low fat.
So now I’m trying to figure out my new macros, and this is going to be so helpful. I’d be grateful for any insights and happy to share any more information in case this n=1 is any help to you.
Thanks again,
Ela
Thank you very much, finally understandable and comprehensive information for effective weight loss. This article is a summary of everything there is to know.
Posted a comment yesterday, but it’s disappeared. Wanted to add to it that in addition to the foods mentioned, I was also consuming lots of green veg. Was just focusing on the caloric inputs and realized I needed to complete the picture by mentioning the greens. (I have severe oxalate toxicity, so they’re all low-oxalate veggies.)
Thank you for the great article! A question regarding weight gain – if the desired weight gain is in the form of muscle mass, would you still recommend <20% from protein? I'm currently targeting 40:30:30 carbs/protein/fat.