
Your blood glucose can give you powerful insights into when and what to eat. But as people start paying attention to their blood sugar, they often wonder:
- What is a normal, healthy glucose value if I don’t have diabetes?
- What is the best glucose level for weight loss? and
- How low is too low when it comes to blood glucose?
To provide some clarity, this article reviews 854,633 glucose values from 8,882 people who have used our Data-Driven Fasting app.
Instead of managing disease, Optimisers in our Data-Driven Fasting Challenges use their blood glucose to guide their weight loss and improve their metabolic health.
By the end of this article, you will understand:
- The range of normal non-diabetic blood sugar.
- The most important time to test your blood sugar.
- How to use your blood glucose as a fuel gauge to lose weight and optimise your metabolic health.
- General Recommendations
- What is a Normal Blood Sugar Level?
- Why is It Important to Know Your Blood Sugar Levels?
- Why Is My Blood Glucose High?
- Normal Fasting (Waking) Glucose
- Typical Blood Glucose After You Eat
- Rise in Glucose After Eating
- Pre-Meal Blood Glucose Levels
- How to Lower Your Glucose
- What Can I Do to Lower My Blood Sugar Levels?
- What Are the Symptoms of Hunger and Low Blood Sugar Levels?
- More
General Recommendations
To set the scene, the table below shows the blood glucose values used to diagnose pre-diabetes and Type 2 diabetes.
| Fasting | After-Meal | HbA1c | |||
| mg/dL | mmol/L | mg/dL | mmol/L | % | |
| ‘Normal’ | < 100 | < 5.6 | < 140 | < 7.8 | < 5.7% |
| Pre-Diabetic | 100 – 126 | 5.6 to 7.0 | 140 to 200 | 7.8 to 11.1 | 5.7 to 6.4% |
| Type 2 Diabetic | > 126 | > 7.0 | > 200 | > 11.1 | > 6.4% |
Doctors often use these cut-offs to prescribe diabetes medications like metformin or insulin. However, rather than simply addressing the symptoms, it’s ideal to address the root cause before you require medication.
If you’re reading this, you’re probably interested in optimising your metabolic health to avoid these medications that only manage symptoms of metabolic syndrome, like high blood sugar.
This article will show you the optimal glucose values that align with optimal metabolic health and how to achieve them.
What is a Normal Blood Sugar Level?
Your body likes to keep the glucose in your bloodstream in a tight range.
- You need enough glucose for your brain and the red blood cells that depend on it. Your liver continuously releases enough glucose into your bloodstream to fuel your daily activities.
- However, too much glucose can be toxic to your system. If your blood glucose is too high, your pancreas raises your insulin levels to slow the release of glucose into the bloodstream until your blood glucose levels decrease.
The chart below shows the distribution of all 854,633 blood glucose values collected in the Data-Driven Fasting app.
- The average blood glucose value is 101 mg/dL (5.6 mmol/L).
- Some people have glucose values above 180 mg/dL (10 mmol/L).
- Very few people have blood glucose levels below 65 mg/dL (3.6 mmol/L).

The chart below shows the same data in mmol/L for those outside the US (note: to convert mg/dL to mmol/L, divide by 18).

The table below shows:
- the 15th percentile, or the value that only 15% of values are below, is 84 mg/dL (4.7 mmol/L), and
- the 85th percentile, or the value that only 15% of values are above, is 115 mg/dL (6.4 mmol/L).
| all glucose | mg/dL | mmol/L | HbA1c |
| average | 101 | 5.6 | 5.1% |
| 15th | 84 | 4.7 | 4.6% |
| 85th | 115 | 6.4 | 5.6% |
Why is It Important to Know Your Blood Sugar Levels?
High blood glucose indicates that you have too much energy stored in your body. This is sometimes known as insulin resistance, but energy toxicity is the root cause.
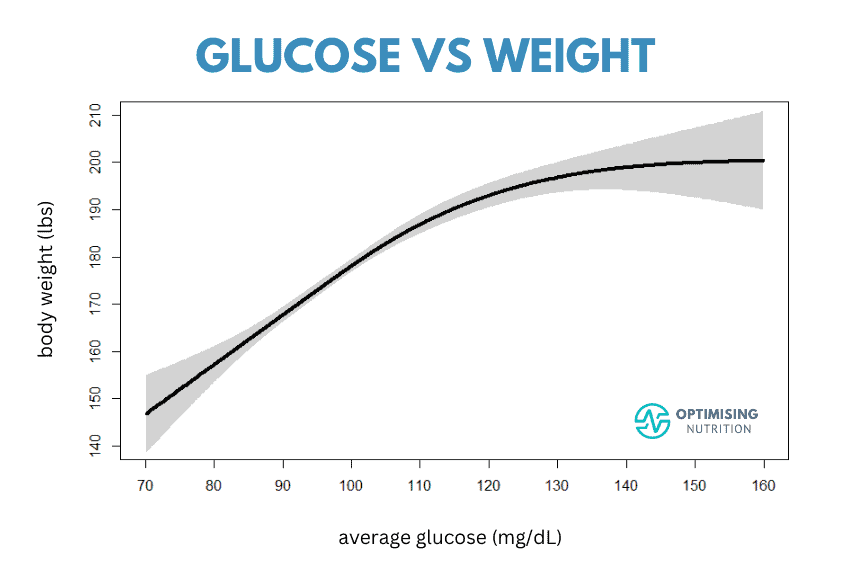
High blood glucose levels correlate with obesity and higher body fat, waist circumference, waist-to-height ratio and blood pressure. The chart below, created from our data, shows that people with higher glucose levels tend to be heavier.

While we often focus on our unsightly body fat or the weight on the scale, we can still be obese but metabolically healthy. But more importantly, high blood glucose levels indicate that you have dangerous levels of stored energy building inside your body. But, as you’ll see, you can also use your glucose to drain the excess energy in your body.
Why Is My Blood Glucose High?
To solve the blood glucose puzzle successfully, it’s important to understand that it’s not just about the carbohydrates in your diet but the excess energy stored as glycogen and fat in your body.
The image below depicts the main fuel tanks in our bodies. Once the larger fuel tanks are full (i.e. your body fat and liver), any excess energy will back up into your bloodstream.

The reason we see elevated glucose in your blood is because the downstream fuel tanks are full. There’s nowhere left for the extra energy from your food to go, so it overflows into your bloodstream.
But the good news is, as you deplete the glucose in your bloodstream, your body can start using the excess glycogen in your liver and the unsightly fat stored on the outside of your body and the dangerous fat stored around your vital organs.

For more details on this, see:
- Oxidative Priority: Unlock Your Fat-Burning Potential and
- Your Personal Fat Threshold & High Insulin Levels
Normal Fasting (Waking) Glucose
While fasting glucose, or glucose when you first wake after an overnight fast, can be tricky to control, it’s an important marker of your overall metabolic health. The charts below show the range of 222,749 fasting glucose values logged in the Data-Driven Fasting app.


The table below summarises this data.
| fasting glucose | mg/dL | mmol/L |
| Average | 104 | 5.8 |
| 15th | 88 | 4.9 |
| 85th | 117 | 6.5 |
The chart below shows that people with higher fasting glucose tend to have a larger waist circumference. This is because they store excess energy in the adipose tissue and the vital organs in their belly, so their waist is larger.

Interestingly, once we tip over into the type 2 diabetes range and become insulin-resistant, our bodies don’t necessarily store a lot of extra fat.
Insulin is required to store energy. When we are leaner and more insulin-sensitive, storing energy is easier. Counterintuitively, once we become insulin resistant, storing more fat actually becomes harder.
Eventually, many people experience pancreatic burnout because their pancreas has been working so hard for so long it can no longer produce enough insulin to store more energy. With inadequate insulin to hold all their energy safely in storage, it starts to overflow into their blood.
If your waking blood glucose is below 100 mg/L, you’re in good metabolic health. The chart below (from Jee-Jeon et al., 2017) shows that a fasting glucose level between 80 and 100 mg/dL aligns with the lowest hazard ratio or risk of dying from any cause.

Typical Blood Glucose After You Eat
While we focus mostly on pre-meal glucose in our Data-Driven Fasting Challenges, we encourage people to initially check their post-prandial glucose one hour after eating until they confirm they are not overfilling their glucose fuel tank with excessive processed carbs.
We recommend using a simple — and cost-effective — glucometer like the Contour Next One to test an hour after you eat. But if you already have or prefer a continuous glucose monitor (CGM), you can use the peak value one to two hours after you eat based on your CgM trace.

The charts below show the distribution of 173,560 blood glucose values after eating (in mg/dL and mmol/L).


The table below summarises this data.
| post-meal glucose | mg/dL | mmol/L |
| average | 112 | 6.2 |
| 15th | 91 | 5.1 |
| 85th | 131 | 7.3 |
The chart below shows the relationship between fasting glucose and your glucose after eating, clearly showing that if your fasting glucose is high, your blood glucose across the rest of the day will also be high.

Insulin resistance and diabetes do not happen overnight; they’re a spectrum. It’s ideal to catch it and take action before it gets out of control. Rather than waiting until you’ve been diagnosed with pre-diabetes or type 2 diabetes, you can take action now and move back to healthy glucose numbers.
Rise in Glucose After Eating
Most people focus on keeping their blood sugars stable or managing the rise in glucose after eating by swapping carbs for fat. However, this doesn’t necessarily address the root cause — energy toxicity.
The chart below shows the average rise in glucose across the 6,211 people who tracked their pre- and post-meal glucose in the Data-Driven Fasting app. The average rise in glucose after eating is 16 mg/dL or 0.9 mmol/L.

Towards the right of this chart, you can see that only a few people see a rise in glucose of more than 60 mg/dL. Interestingly, towards the left, we see that many people find their glucose falls after eating, especially if they are metabolically healthy and/or prioritise nutrient-rich meals.
The chart below shows the relationship between fasting glucose and the rise in glucose after we eat.
- Towards the left, we see people who are metabolically healthy and have lower fasting glucose, who also tend to see a smaller rise in glucose after they eat.
- But if all your fuel tanks start to fill up, you’ll also see a larger rise in glucose after you eat as the excess energy from your food backs up into your bloodstream.

In our Data-Driven Fasting Challenges, we suggest people avoid or reduce foods and meals that raise their glucose by more than 30 mg/dL or 1.6 mmol/L. Once most of their post-meal glucose values are below this, they can focus on the glucose before they eat and skip the hassle of testing their glucose after meals.
Some glucose variability after you eat is a normal part of healthy appetite signalling. Unfortunately, aiming for flat-line glucose often leads people to switch their carbs for fat, contributing to energy toxicity and higher average glucose across the day.
For more details, see:
- How to Use a Continuous Glucose Monitor (CGM) for Weight Loss
- CGM Data Demystified: Your Path to Nutritional Wisdom and Metabolic Health
- Glucose Spikes: Your Guide to Healthy Blood Sugars
- Glucose Goddess Jessie Inchauspé’s Insights Reviewed
Pre-Meal Blood Glucose Levels
The glucose level BEFORE you eat is the most important blood glucose value to measure.
People with lower premeal glucose tend to have a healthier waist-to-height ratio because their bodies have plenty of capacity in their fuel tanks. With less energy stored around their fat cells, they have less fuel spilling into their blood.
Notice in the chart below how a premeal glucose slightly below 83 mg/dL aligns with a healthy waist-to-height ratio of 0.53. Once you reach this point, you’ll likely be lean, metabolically healthy, and ready to transition to maintenance. To reach an ‘optimal’ waist-to-height ratio of 0.5, you may need to push to an even lower premeal blood glucose.

As shown below, your fasting glucose correlates with your glucose before you eat.
- If you have type 2 diabetes, you should work towards a premeal glucose of around 110 mg/dL (or 6.1 mmol/L) to get back to the pre-diabetes range.
- If you’re currently managing pre-diabetes, you can work towards a premeal glucose of 94 mg/dL (5.2 mmol/L) to get into the normal range.
- However, to achieve an optimal waist-to-height ratio of 0.5, associated with the lowest risk of dying of any cause, you can shoot for a premeal glucose of 74 mg/dL (4.1 mmol/L).

Many people wonder what a normal premeal glucose value is in our challenges. The charts below show the distribution of pre-meal glucose values logged in the DDF app.

Notice how your liver ensures that the glucose in your blood never gets too low. But as your glucose decreases, your body turns to the stored fat on our body for fuel, which most of us are interested in burning.

The table below summarises the analysis of 458,087 pre-meal blood glucose values.
| premeal glucose | mg/dL | mmol/L |
| Average | 95 | 5.3 |
| 15th | 81 | 4.5 |
| 85th | 106 | 5.9 |
It’s important not to let your glucose drop too far below what your body is used to. This often leads to an emergency stress response in your body, and eating more than you otherwise would and making poorer food choices.
In our Data-Driven Fasting Challenge, we want optimisers to push their bodies just a little, but not so much that they fall into the all too common binge-restrict cycle.
We ran a multivariate analysis of all the data. We found that premeal glucose is the biggest factor in predicting fasting glucose, much more than post-meal glucose, glucose rise, weight or body fat!
How to Lower Your Glucose
Many people are concerned about their rising glucose levels. But the good news is that you can actively manage your glucose before you eat.
In our Data-Driven Challenge, we guide our Optimisers to wait until their glucose is slightly lower than normal before they eat to ensure that they tap into their stored energy multiple times a day.
The graphic below shows the ideal scenario. You eat, your glucose doesn’t rise by more than 30 mg/dL, and then it’s time to eat again when you’re hungry and your blood glucose is below your current trigger.

Life doesn’t always go to plan perfectly, but in the Data-Driven Fasting Challenge, we turn the puzzle of what and when to eat into a game.
For more details on the various hacks to optimise premeal blood glucose and your weight, body fat and metabolic health, check out our Visual Guide to Using Your Glucose as a Fuel Gauge.
What Can I Do to Lower My Blood Sugar Levels?
Finally, let’s look at how to use your pre-meal glucose to reach your goals and achieve your desired results.
After you find your baseline glucose trigger using the DDF app, it guides you through the process of Hunger Training, where you wait until your glucose is just below your current trigger, indicating it’s time to refuel.

If you can successfully wait until you reach your personalised glucose trigger, more often than not, you will begin to unload some of the energy you have stored. As a result, your average pre-meal glucose value will start to decrease, and the DDF app will slowly reduce your trigger to ensure you keep progressing.
What Are the Symptoms of Hunger and Low Blood Sugar Levels?
The real magic of Data-Driven Fasting is that it gets you back in touch with your true hunger signals. While they can vary from person to person, common symptoms of hunger include:
- rumbling stomach,
- food focussed,
- mentally tired/can’t think straight,
- light-headedness and
- slight nausea.
Once you relearn what it feels like to be hungry without pushing yourself so hard that you end up in a binge, you can get on with your life without constantly using your blood glucose as guidance. You have successfully retrained your hunger signals.
You can rate your hunger level when logging your pre-meal trigger in the DDF app. Lower glucose readings align nicely with higher perceived hunger ratings. As we can see from our final chart from the Data-Driven Fasting data analysis, people tend to feel hungrier when their glucose is lower. Before long, they can even learn to calibrate their feelings of hunger with their glucose and food needs.

But before using the numbers here, remember that your metabolism is unique! For your personalised pre-meal blood glucose trigger, click here for free DDF app access for two weeks.

If you need more help and guidance, we’d love to join our next Data-Driven Fasting Challenge.
I have been testing my blood glucose for awhile now, but I never quite understood how to bring my fasting level down. I’ve tried intermittent fasting and I can bring it down through not eating. This article is so helpful. Thank you for making it reader friendly and easy to understand!
cheers. I’m really glad you found it helpful!
Ive lost weight but I want to bring my blood sugar down further without losing more weight. Any thoughts on that issue? Two at home A1c tests (different brands) show me just inside of normal – 5.5 for one test and 5.3 for the other. My insurance carrier’s test shows me at 5.9!
Swapping carbs for dietary fat will help to lower HbA1c, but your BG sounds like it’s already pretty good.