
Say goodbye to generic fasting routines and hello to a personalized, cutting-edge approach that taps into your body’s real-time fuel gauge! Traditional fasting methods might dictate fixed eating windows like 18:6, 20:4, or alternate-day fasting, but they lack the essential ingredient—YOU!
Without tailoring your fasting regimen to your unique metabolism and daily schedule, it’s easy to dismiss your body’s healthy hunger cues. This often results in less-than-optimal food choices and uncontrollable overeating once the fasting period ends.
Data-Driven Fasting, on the other hand, flips the script. We harness the power of your blood glucose levels to provide invaluable insights that ensure you’re nourishing your body precisely when it needs it, not a minute sooner or later.

Instead of suppressing your natural appetite signals, Data-Driven Fasting educates you on how to decode and trust these signals. As you embark on this journey, you’ll find that your appetite naturally aligns with your body’s needs, creating a harmonious relationship where you give your body exactly what it craves at the perfect moment.
Get ready to transform the way you eat, nurture your body, and unlock your full potential with Data-Driven Fasting!
BONUS: Download Free Data-Driven Fasting Book That Has Helped Thousands Of People Personalize Their Fasting Routine
- Getting Started with Data-Driven Fasting
- The Secret of Data-Driven Fasting
- Why We Created Data-Driven Fasting
- Your Healthy Appetite Signals Have Been Hijacked
- Discover Your Perfect Fasting Formula: Unleash the Power of YOUR Unique Routine!
- Discover Your Ultimate Refueling Strategy!
- What happens when you push the limits of fasting?
- Why Fasting Fails for So Many
- Is Fasting for Longer Better?
- Unlocking the Power of Protein and Nutrients!
- The Secret to Unlocking Your Body Fat Stores
- How to Burn Your Body Fat
- Your Body’s Fuel Tanks
- Your Personal Fat Threshold
- Why Blood Glucose and Insulin Are So Important
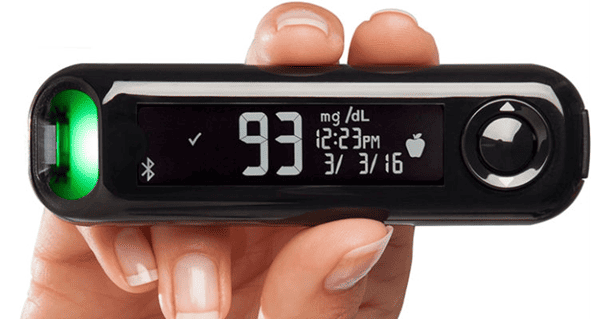
- How To Use Your Blood Sugar Meter as A Fuel Gauge
- Hunger Training: How to Lose Weight Using Your Blood Sugar as A Fuel Gauge
- The Research Behind Hunger Training
- The Data-Driven Fasting System
Getting Started with Data-Driven Fasting
Since we kicked off Data Driven Fasting in May 2020, we have fielded many questions in our Data-Driven Fasting Challenges and documented the answers in the manual for others to benefit.
The detail in the manual will unpack all the hows and whys around using your glucose to guide what and when to eat. But if you want to get started now, you can:
- try the Data-Driven Fasting app here to find your personalised glucose trigger today and start the hunger training process,
- download the complete Data-Driven Fasting Manual to read offline,
- get a quick overview of DDF with our free DDF 101 course and
- join our Data-Driven Fasting 30-Day Challenge, where we will guide you through the process with a structured program, Live Q&As in a supportive community environment and answer any questions you might have.

The Secret of Data-Driven Fasting
The secret of Data-Driven Fasting is that it’s not fasting, at least not how most people think of it.
Instead, Data-Driven Fasting uses quantified mindful eating to understand your unique metabolism.
You only need a simple glucometer (not an expensive CGM) to validate your hunger and ensure you give your body exactly what it needs.
Why We Created Data-Driven Fasting
Intermittent fasting has ignited a weight loss revolution, helping countless individuals shed pounds, tame blood glucose levels, and even reverse type 2 diabetes – all without the tedium of meticulous food tracking.
But here’s the truth: For some, the fasting journey hasn’t delivered the transformative results they’ve yearned for.
When those hunger pangs strike with a vengeance, we tend to reach for quick fixes – energy-packed, nutrient-deprived foods that swiftly sabotage our hard-earned progress. It’s a heartbreaking setback we’ve all experienced.
Now, picture this: a path to sustained triumph, where you find the perfect balance – the minimum effective dose of fasting – without pushing yourself to the brink. Say goodbye to the relentless cycle of restrict, binge, restrict that leaves many feeling trapped.
In the world of fasting, less can indeed be more. You’ll discover the sweet spot that propels you toward your goals at a pace that’s not only sustainable but also avoids triggering your inner “lizard brain.”

Enter Data-Driven Fasting (DDF), the exhilarating game-changer that makes fat loss and metabolic health an exciting journey. With just a few simple measurements, DDF empowers you to customize your eating schedule to perfection, focusing only on what truly matters.
Bid farewell to calorie counting and rigid, one-size-fits-all fasting windows. DDF has stood the test of time, guiding thousands toward their fat loss and blood glucose goals with unparalleled success. The results speak for themselves, and we couldn’t be more thrilled!
Are you ready to harness the power of your own blood glucose to determine when and what to eat?
Dive in, and let Data-Driven Fasting illuminate your path to health and vitality like never before!
Your Healthy Appetite Signals Have Been Hijacked
Unfortunately, our natural, primal hunger signals have fallen prey to the cunning tactics of our modern food landscape. Picture this culinary battleground:
- A tempting abundance of ultra-processed foods, cunningly crafted with an irresistible blend of refined carbs and fats—a combo rarely seen in the wild, practically forcing us to overindulge.
- Round-the-clock access to food, every day of the year, leaves us in a constant tug-of-war with our cravings.
- Social and cultural cues nudge us to associate food with excitement, affection, pleasure, and the life of the party rather than as the vital source of the nutrients we need to thrive.
- The relentless drumbeat of food advertising and marketing entices us to snack and munch on and almost hypnotises us into overconsumption.
- Crafty artificial colourings, scents, and flavours dupe our appetite, tricking it into believing that processed food products are packed with the essential nutrients our bodies crave.
This colossal recipe of culinary mischief has birthed the ‘Frankenfood’ phenomenon—a market that perpetuates the overindulgence and weight gain cycle. This shift in our food ecosystem has ushered in the menacing ‘diabesity’ epidemic, an ever-growing menace affecting over 422 million people, as declared by the World Health Organization.
But don’t despair! It’s time to rewrite this culinary narrative, take back control of our appetites, and restore our bodies to their natural, healthy state. Let’s embark on a journey of discovery fueled by knowledge and empowerment as we combat the Frankenfood monster and reclaim our well-being.
Discover Your Perfect Fasting Formula: Unleash the Power of YOUR Unique Routine!
As the fasting frenzy sweeps the world, the question looms: Which fasting schedule is tailor-made for YOU?
With a smorgasbord of options like Michael Mosley’s 5:2, Hugh Jackman’s 16:8, Bert Herring’s Fast-5, Brad Pilon’s Eat Stop Eat, Ori Hofmekler’s Warrior Diet, Valter Longo’s Fasting Mimicking Diet, Alternate Day Fasting (ADF), Multi-Day Extended Fasting (EF), or the daring One Meal a Day (OMAD) approach, the choices are mind-boggling!
Passionate enthusiasts abound, fervently championing their fasting methods after experiencing jaw-dropping success. But what about YOU?
- How do you crack the code to find YOUR fasting plan?
- How can you be sure it’s doing wonders for YOU?
- What’s the secret to fine-tuning your unique routine for optimal results?
- Worried about falling off the wagon and undoing all your hard work?
- And how do you handle those moments when your stomach growls with hunger, but the clock says it’s not “eating time” yet?
Fear not, intrepid seeker of fasting wisdom, for we have the answers you crave! Get ready to embark on a thrilling journey to uncover YOUR ideal fasting schedule tailored to your body, goals, and success story.
Let’s decode the fasting enigma together and unleash the incredible power of YOUR unique fasting routine!
Discover Your Ultimate Refueling Strategy!
Imagine relying on your friend’s advice that the best time to refuel your car is at 10 a.m. on the first Saturday of the month.
Sounds absurd, right? Especially when they drive a hybrid hatchback, enjoy a short daily commute, and stroll around on weekends.
Meanwhile, you’re behind the wheel of a sturdy pick-up truck, tackling a two-hour daily commute and occasionally embarking on weekend adventures to the beach.

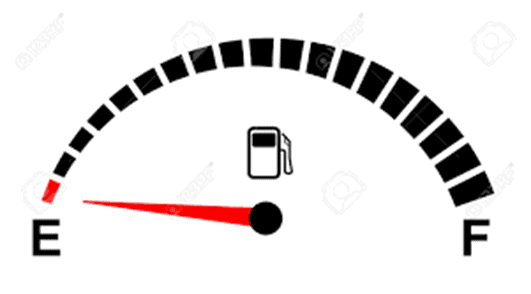
Following your friend’s rigid refuelling schedule would leave you stranded, gasping for fuel on the roadside! The only logical choice is to heed the fuel gauge in YOUR vehicle. Just as you rely on your car’s gauge to decide when to refuel, your eating schedule should be just as personalized.
There’s no magic in someone else’s eating timetable that guarantees it will work seamlessly for you. Your fasting routine should be fine-tuned based on your internal fuel gauge—your blood glucose level—rather than blindly adhering to someone else’s inflexible clock-based plan, no matter how well it suits them.
Enter Data-Driven Fasting—a game-changer that empowers you to optimize your refuelling schedule to align perfectly with your unique needs and goals. It gives you immediate insights into when your body’s fuel gauge is ‘full’ and when it’s flashing ’empty,’ ensuring you never run on empty again! Get ready to unlock your full potential with a refuelling strategy tailored just for you.
What happens when you push the limits of fasting?
While you don’t want to fuel up too often, you also don’t want to let the tank go dry. So, to continue the car analogy, you’ll find yourself in an emergency, broken down on the side of the motorway.
After being pulled to safety by the tow truck, from that day on, you will always make sure your fuel tank is filled to the brim at every opportunity to ensure you never have that experience again.
This is not unlike what happens to most of us when we dabble with extended fasting (e.g., OMAD, ADF or multi-day fasting).
While we often believe more deprivation must be better, we don’t account for our survival instincts intervening to ensure that we eat more than we need to, just in case we subject ourselves to another extended fast.
Studies in rats who press a button to get food show when food is consistently available, they will only press the button when they need food. However, when the food supply is inconsistent — when the button doesn’t yield food every time they press it — they go into a frenzy of panicked button pressing, whether they need food or not, to account for the unreliable food availability.
To address this, Data-Driven Fasting uses your blood sugar as a fuel gauge to empower you to understand precisely when and what you need to eat. Once your body learns that it will get what it needs when it needs it, Lizzy returns to sleep, content that there is no emergency.
Why Fasting Fails for So Many
Ever wonder why some folks can fast for days and still not shed those stubborn pounds? Fasting might seem like a breeze when you’ve got some extra stored fat to spare, but it’s a different story when it comes to achieving that lean physique you’ve been dreaming of.
You’ve probably seen those social media warriors boasting about feeling like superheroes with sky-high ketone levels after marathon fasting sessions. But on the flip side, others can’t seem to catch a break as their weight rollercoasters up and down like a never-ending game.
The result? They’re stuck in a cycle of losing and regaining the same few pounds, all while their body composition takes a nosedive. Soon enough, they’ve morphed into the dreaded “skinny fat” category, with more fat and less precious muscle.
Sure, many fasting programs talk a big game about building your “fasting muscle” through sheer willpower and increasingly longer fasts. But here’s the kicker—most of these well-intentioned “window warriors” only awaken the beast known as Lizzy.
Lizzy’s specialty? Transforming a quiet, manageable hunger into a full-blown, operatic “starvation” meltdown, often referred to as the dreaded “Godzilla response.”
And when Lizzy’s on the rampage, there’s no time for grilled chicken breast and broccoli diplomacy. Instead, it’s all about peace offerings in the form of comfort foods. The catch? These emergency comfort foods tend to be highly processed, crammed with empty calories, and nutritionally bankrupt—think pizza, cakes, chips, peanut butter, and ice cream. They’re like a one-way ticket to refilling your glucose and fat tanks, undoing all your hard-earned fasting progress in a flash.
But fear not, because Data-Driven Fasting has the solution you’ve been searching for! We teach you the art of nourishing your body precisely when hunger strikes. This strategic approach ensures that when Lizzy comes knocking, you’re armed with the right nutrients, making those tempting comfort foods a thing of the past. Say goodbye to the cycle and hello to sustainable leanness with Data-Driven Fasting!
Is Fasting for Longer Better?
Extended fasting enthusiasts often highlight the incredible benefits seen in lab rodents who go the distance with their fasting routines. But let’s set the record straight – you are far from being a giant mouse locked in a laboratory!
Consider this mind-blowing fact: One day in the life of a mouse is equivalent to a whopping forty human days. So, if you’re aiming to experience the same enchanting benefits of autophagy that those lucky rodents do after just three days of fasting, you’d have to commit to a whopping 120 days of fasting!
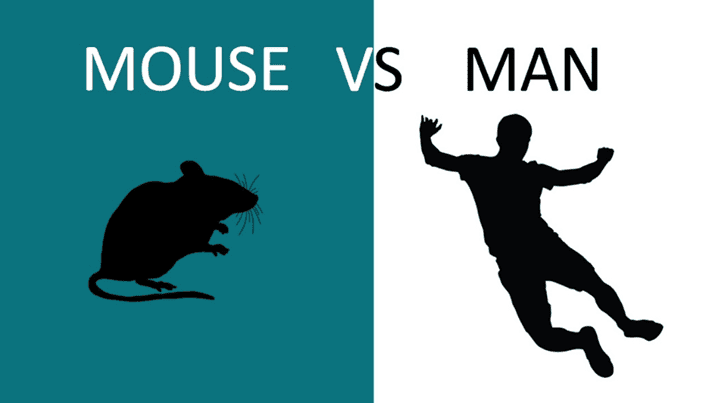
But that’s not all! Remember that lab rats get the same monotonous chow every day, regardless of their hunger pangs or satisfaction levels. Humans, on the other hand, have a world of culinary choices at their fingertips. No matter how disciplined you believe yourself to be, the moment you awaken your primal survival instincts when you fast for too long and let your blood glucose levels drop too low.
Unlocking the Power of Protein and Nutrients!
Here’s the deal: Regular fasting can leave you short on essential protein, minerals, and vitamins, the very things your body craves to banish those pesky cravings, keep you feeling satisfied, and supercharge your health.
Over time, you might find yourself in the dreaded “skinny fat” zone, with more body fat and less muscle, which can slow your metabolism and wreck your metabolic health. And to add insult to injury, you have to keep cutting calories more and more to keep progressing.
Check out the survey we pulled from our Data-Driven Fasting Facebook Group – it’s eye-opening!
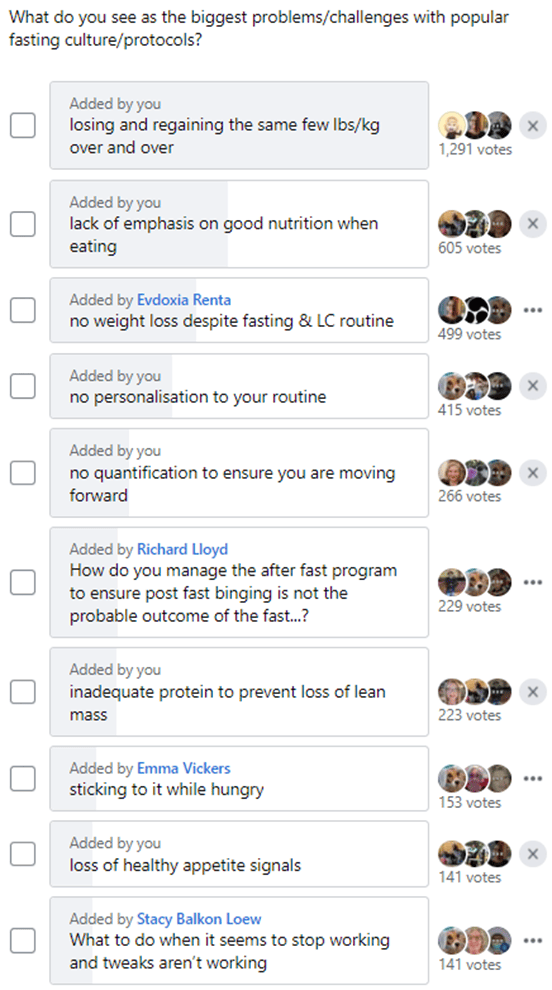
Most folks encounter a slew of issues with trendy fasting plans, like that frustrating cycle of losing and regaining the same weight repeatedly. When we saw these widespread challenges, we knew it was time for a game-changer.
Here’s the scoop: Fasting isn’t a magic potion that lets you bypass your body’s need for nutrients. Lizzy will always demand amino acids, minerals, vitamins, and energy, no matter how much willpower you muster with your conscious mind.
The real “secret” is finding the sweet spot between restriction for fasting benefits and delivering the nutrients your body craves without pushing so hard that Lizzy decides to undo all your hard work.
Small, sustainable changes that lead to lasting health are way better than quick fixes that leave you feeling guilty when you “fail” again. Let’s make your journey about long-term success, not short-lived setbacks!
The Secret to Unlocking Your Body Fat Stores
Our bodies are incredible machines, finely tuned to make the most of the energy we consume. When it comes to fueling ourselves, we have two primary options: the food we eat or the fat stored within us. But here’s the exciting part – not all fuels are created equal!
Take a look at the table below, which reveals the fascinating world of fuel priorities in your body (adapted from “Oxidative Priority, Meal Frequency, and the Energy Economy of Food and Activity” by Cronise et al., 2017).
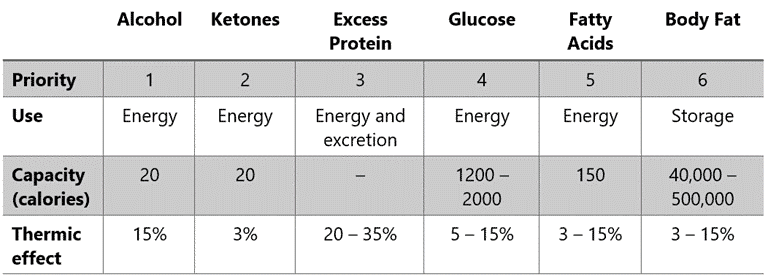
Some fuels are like high-octane rocket fuel for your metabolism, while others are harder to convert into energy. We’ve got some scientific lingo for this phenomenon: the thermic effect of food, dietary-induced thermogenesis, or the specific dynamic action of food.
While it might sound complex, these terms have a powerful impact on how our bodies process the food we eat, how much we eat, and what ends up stored as fat.
Here’s the scoop: Your body is incredibly smart. It prefers to burn fuels it can’t stash away for later. So, here’s the pecking order:
- Alcohol gets first dibs on the energy game.
- Ketones come into play when glucose and protein levels are low, offering an alternative to glucose.
- Protein follows closely, but don’t worry about overdoing it – most of the protein we eat goes toward essential functions like maintaining muscles.
So, your body’s remaining dominant fuel sources are carbs and fats. While the body likes to maintain some glucose, having too much slows the use of fat, either your diet or your body stores. For more detail, see Oxidative Priority: The Key to Unlocking Your Body Fat Stores.
How to Burn Your Body Fat
Counterintuitively, people carrying a lot of body fat burn mostly glucose at rest. So, when we measure their respiratory quotient (the ratio of CO2 exhaled vs. the oxygen consumed), we find that they’re working overtime by trying to burn off the glucose that’s ‘backed up’ in their system. So, because they are busy trying to burn off the excess glucose, they cannot easily access the fat stored in their body.
Because you can only store about five grams of glucose in your blood (about a teaspoon’s worth), a little dietary carbohydrate can quickly raise your blood glucose levels. This is especially true if your fat and glucose storage tanks are already full and can’t easily absorb the excess energy from your diet.

While we can convert sugar to fat (through a complex and highly regulated metabolic pathway known as de novo lipogenesis), it’s usually the fat in our diet that is stored while our body works to use the glucose first. Any leftover dietary fat is easily stored as adipose tissue for future use.
It’s not that fat is a better fuel source than carbs. Carbs are better for explosive bursts of activity, and fat is more compact and better for storage. However, both are simply energy sources that your body can use. As shown in the chart below from our satiety analysis, reducing carbs or fat aligns with reducing overall energy intake.
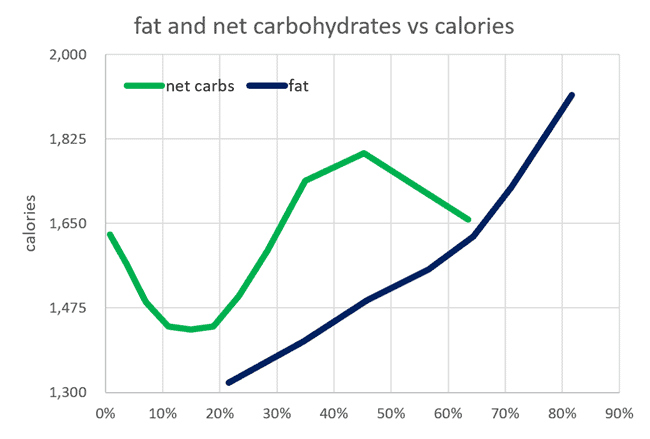
For more detail, see Low-Carb vs. Low-Fat: What’s Best for Weight Loss, Satiety, Nutrient Density, and Long-Term Adherence?
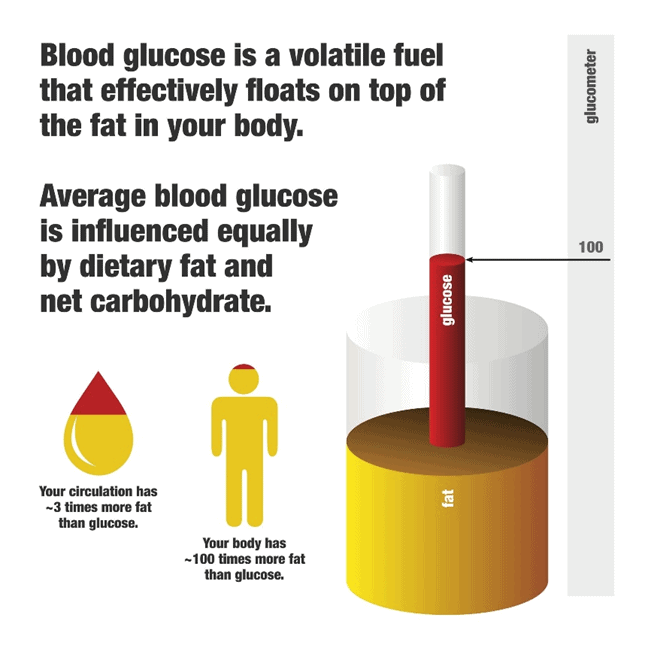
Directly after eating carbs, your glucose levels quickly rise and register on your glucometer. The key thing to understand here is that:
- Glucose essentially ‘floats on top’ of the fat in your bloodstream and adipose tissue.
- Hence, you must first deplete the glucose in your bloodstream before your body can access its fat stores.
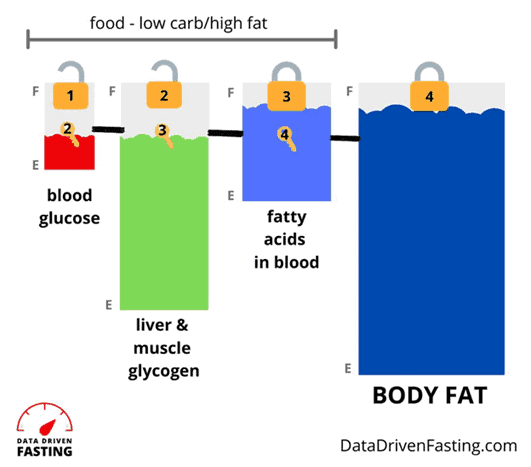
You can think of your available fuels as stacked up on top of each other in your various fuel tanks, as shown below.
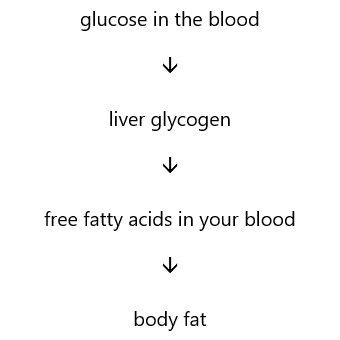
Understanding the oxidative priority of various fuels is the key to successfully burning the fat and glucose in your bloodstream to burn the fat on your body finally.
Your body’s fuel tanks are separate but interconnected; you’re constantly burning a mixture of glucose and fat.
- As you deplete the glucose in your blood, it’s refilled from the glycogen stores in your liver (note: glycogen is the fancy name for the body’s stored form of glucose).
- As glycogen is depleted, your body turns to the fat in your blood for energy.
- Once glucose and fat are depleted, your body can finally use its stored fat.
Before your body can burn your stored body fat, you must deplete the alcohol, ketones, glucose, and fat in your bloodstream and liver.
The image below shows how our blood glucose and liver glycogen stores change over time when we don’t eat. When we go without food, we deplete the blood glucose and draw down our liver glycogen.
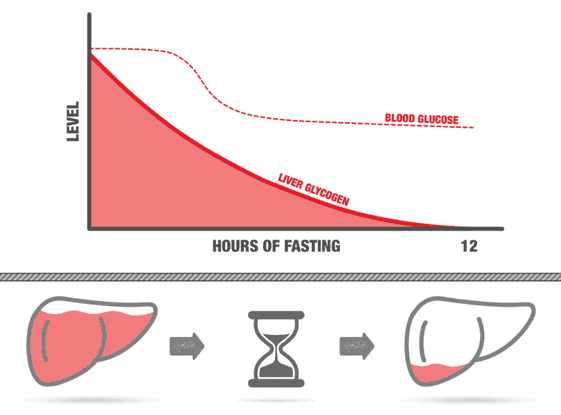
But it’s important to note that your blood glucose and glycogen are never fully drained or exhausted. Your body will never let your glucose go to zero. Even if you’re not eating any carbohydrates, your body can make glucose from the protein and fat in your diet through a process known as gluconeogenesis. If you’re not eating carbs or protein, your body will turn to your muscles to make glucose.
Rather than encouraging you to fast harder and for longer, Data-Driven Fasting teaches you to fast smarter by delaying your meals just long enough to allow your blood glucose to drop below what is normal for you.
This technique fosters sustainable, long-term progress towards your goals without pitting Lizzy against your conscious brain in a colossal battle over appetite control and perceived starvation. Thankfully, Lizzy will always win when it comes to a fight to the death between your mind and your survival instincts.
As you delay your meals for just a little longer, your body will use up the excess glucose in your bloodstream and liver. Then, once glucose lowers, your body turns to your stored fat for fuel without triggering the all-too-common binge response resulting from extended fasting protocols.
It’s a win-win for both your waistline and Lizzy!
Your Body’s Fuel Tanks
Did you know your body has several different ‘fuel tanks’?
As shown in the diagram below, most of us usually have our two glucose tanks, blood (1) and liver (2), filled to the brim.
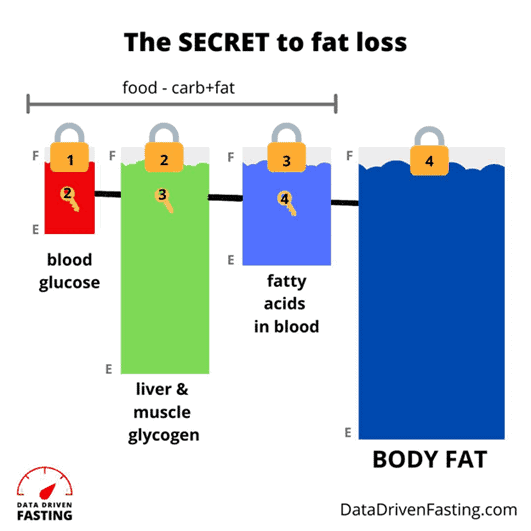
The fact that all our fuel tanks are topped up and overflowing is not simply because we are consuming too many carbohydrates. Instead, our downstream fat fuel tanks in our blood (3) and adipose tissue (4) are also full. Any excess energy effectively ‘backs up’ in our system, so we see elevated glucose in our blood.
But when we wait a little longer to eat, we allow our body to use the glucose in our blood and the glycogen stored in our liver. Reducing the glucose in your blood ‘unlocks’ the stored glucose in your liver. Then, as long as we’re not eating excess dietary fat, we can access the fat most of us want to lose in our blood and body.
Your Personal Fat Threshold
Our bodies store each fuel in varying quantities and use them in different ways.
Body fat is your largest fuel tank and can store a LOT of energy. But it’s not infinite. It can still become full and overflow.
For reasons we don’t yet fully understand but are likely linked to genetics and lifestyle factors (i.e., ethnicity, diet, inflammation, activity levels, and age), some people reach their Personal Fat Threshold at lower body fat levels than others. As a result, while most people develop type 2 diabetes after gaining significant excess body fat, others are diagnosed with type 2 diabetes while still relatively lean.
You may have heard the term ‘TOFI’ (thin on the outside, fat on the inside) used to describe people who carry their fat around their organs (i.e. ‘visceral fat’), like the guy on the right in the image below. In contrast, others store excess fat on the outside of their body (i.e. ‘subcutaneous fat’), like the guy on the left.
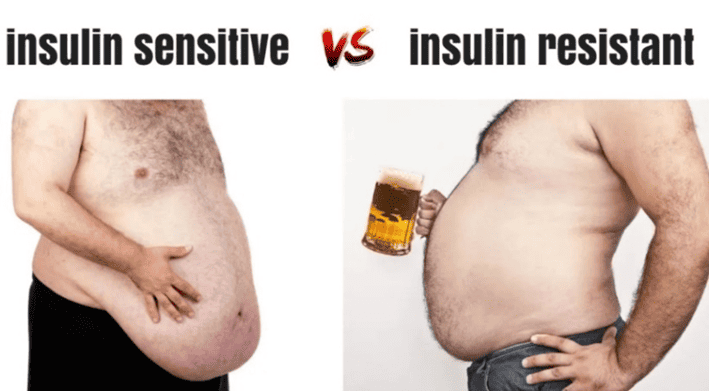
While carrying your fat on the outside may look more unsightly, it’s potentially less dangerous than having fat build up around your vital organs because you have overfilled your adipose tissue, and the excess energy has nowhere else to go.
Body fat acts like a sponge, soaking up the excess energy. But just as a sponge can only absorb so much water, there is a limit to how much energy your body fat can hold before it overflows into other places it doesn’t belong (like your liver, pancreas and heart).
The limit to the amount of fat your body can comfortably store on the ‘outside’ of your body (i.e., your adipose tissue) is known as your ‘Personal Fat Threshold’. Once your body exceeds its Personal Fat Threshold, blood glucose levels rise as excess energy ‘backs up’ into your bloodstream, measured as elevated glucose levels, ketones, and free fatty acids.
If stored energy levels continue to rise, visceral fat is deposited in and around your organs. While external fat stored as ‘muffin tops’ or ‘jelly bellies’ makes us cringe and reach for the latest pop-culture diet book, our internal and invisible visceral fat is the most dangerous to our health.
For more detail, see Personal Fat Threshold Model of Insulin Resistance, Diabetes and Obesity.
Why Blood Glucose and Insulin Are So Important
Maintaining healthy blood glucose and insulin levels is a big deal. When someone exceeds their Personal Fat Threshold, they risk developing Type 2 Diabetes and all the other diseases related to energy toxicity and metabolic syndrome.
You may have heard that elevated insulin and blood glucose levels correlate with many burgeoning modern diseases, including:
- heart disease
- stroke
- Alzheimer’s disease
- type 2 diabetes
- high cholesterol
- high blood pressure (hypertension)
- abdominal obesity
- non-alcoholic fatty liver disease (NAFLD)
- polycystic ovary syndrome (PCOS)
- endometriosis
- neuropathy
- cataracts
- depression
- gout
- atherosclerosis
- gastroesophageal reflux disease (GERD)
- obstructive sleep apnoea
- cancer
However, the important fact that many miss is that insulin and blood glucose aren’t the fundamental root cause. The real issue is not insulin toxicity but rather energy toxicity.

The main action of insulin in your body is to stop all your stored energy from flowing into your bloodstream at once. So, the more energy you have in storage, the more insulin your body needs to produce to hold it back.
Once you learn to eat in a way that allows you to lower your glucose and body fat sustainably, your body will no longer need to produce as much insulin. Thus, your insulin levels will decrease, and you will become insulin-sensitive rather than insulin-resistant.
For more details, see:
- Insulin is NOT Making You Fat,
- What Does Insulin Do in Your Body? and
- What Is Insulin Resistance (and How to Reverse It)?
How To Use Your Blood Sugar Meter as A Fuel Gauge
Wouldn’t it be great if there was a simple but precise fuel gauge for your body that could be used to tell if you:
- needed to eat (refuel) now,
- are craving those yummy leftovers in the fridge just because you know they’re there,
- are reaching for food to soothe your emotions, relieve boredom, or
- are only eating out of habit (because it’s ‘breakfast time’).
While you can cheat on your calorie tracking or fasting app, your glucometer never lies. So, it can be your new BFF if fat loss and healthier metabolic biomarkers are your long-term goals.
Maintaining blood glucose levels in the healthy, non-diabetic range is crucial to your overall metabolic health. However, our analysis of nearly five thousand people who have used the Data-Driven Fasting app shows that:
- many people who have some experience with fasting, low-carb, or keto diets have very stable blood glucose already and
- manipulating your diet to achieve even more stable blood glucose (e.g., swapping carbs for dietary fat) does not necessarily lead to more fat loss or improved metabolic health.
To lose fat, you must manage your blood glucose level before eating. With Data-Driven Fasting, you will learn to use a glucose meter as a fuel gauge to lose fat without pushing your body too hard.
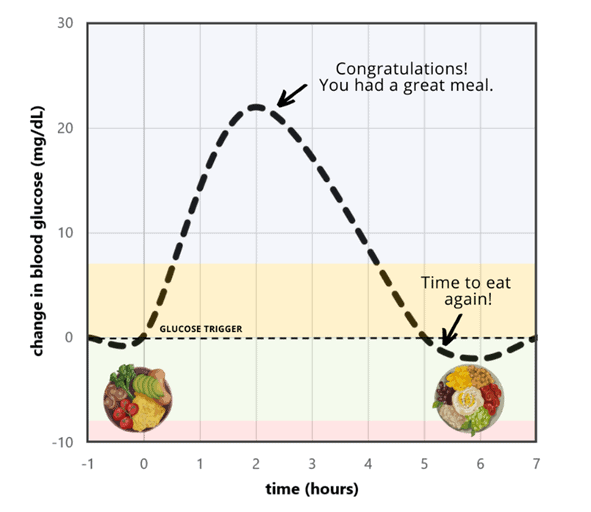
Data-Driven Fasting uses your personalised blood glucose as a ‘trigger’. When you feel hungry and think about eating, check your blood glucose to validate your hunger and see if you need to refuel.
- If your blood glucose is above your trigger, wait until it drops below this point.
- But if you’re starving and still above your trigger, you can focus on meals with protein and nutrients with less energy from fat and carbs because you know you currently have plenty of fuel in your bloodstream.
Waiting until your blood glucose drops below your trigger ensures that your fasting routine achieves a long-term negative energy balance by using the energy in the bloodstream.
As a result, you gain all the benefits of fasting, like increased insulin sensitivity, improved blood glucose levels, weight loss, fat loss, and autophagy, without waking your survival instincts and triggering an unhealthy binge-restrict cycle.
For more detail, see How to Use Your Glucose as a Fuel Gauge (A Pictorial Guide).
Hunger Training: How to Lose Weight Using Your Blood Sugar as A Fuel Gauge
We designed Data-Driven Fasting to help you fine-tune your eating routine and find the minimum effective dose of fasting required to get the desired results.
Data-Driven Fasting is founded on the understanding that you must first deplete both the glucose and fat in your bloodstream before depleting your stored body fat. You make this magic happen by measuring your blood glucose levels and confirming they’ve dropped below your trigger before you eat.
Although there’s nothing wrong with occasionally going 24 or 36 hours (i.e., skipping a whole day) without food, you’ll sacrifice all the benefits of your voluntary deprivation if you make poor food choices when you eat again.
While some people believe that you can eat whatever you want, so long as you do it in a specific “window”, the reality is that WHAT you eat when you refuel is critical to ensuring that you get the nutrients you need in the long term.
If you find yourself reaching for ice cream, cake, peanut butter or pizza after your fast, chances are you’d benefit by being a little less ambitious next time.
The Research Behind Hunger Training
We use a process known as ‘Hunger Training’ to ensure that the time you spend fasting doesn’t awaken your reptilian instincts and lead to poor food choices when you eat again. ‘Hunger Training’ is an exciting approach with some fantastic outcomes in recent studies.
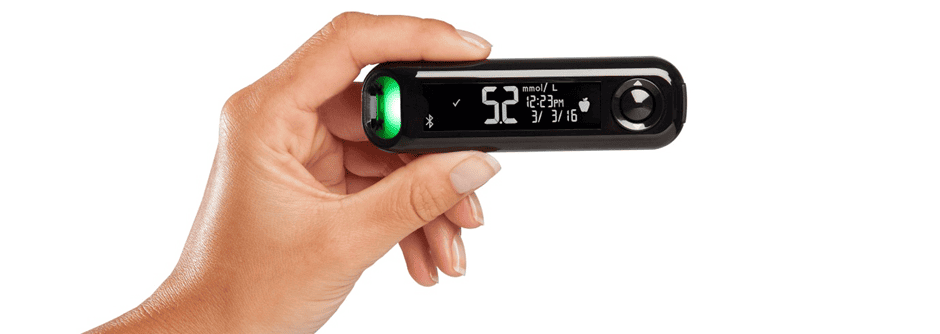
In her 2012 book, The Glucometer, Angela Ross recommended simply delaying eating if your blood glucose is above 5.0 mmol/L or 90 mg/dL (note: mmol/L are the metric units for blood sugar, while mg/dL are the imperial units used in the USA. To convert mg/dL to mmol/L, divide by 18).
A 2016 study from the University of Otago in New Zealand (Adherence to hunger training using blood glucose monitoring) found hunger training extremely effective, with obese people losing 1.5 kg on average over two weeks. Notably, the study also found it was more effective for people to have a personalised blood glucose trigger rather than simply reaching an arbitrary ‘optimal’ blood glucose level before eating.
In the subsequent study, published in 2017 by the same group (The Effect of Different Types of Monitoring Strategies on Weight Loss: A Randomized Controlled Trial), lead researchers tested hunger training against:
- daily weighing,
- calorie tracking with the MyFitnessPal app, and
- counselling sessions.
Hunger training using a personalised blood glucose target was the only scenario where people lost weight. Everyone else gained weight!
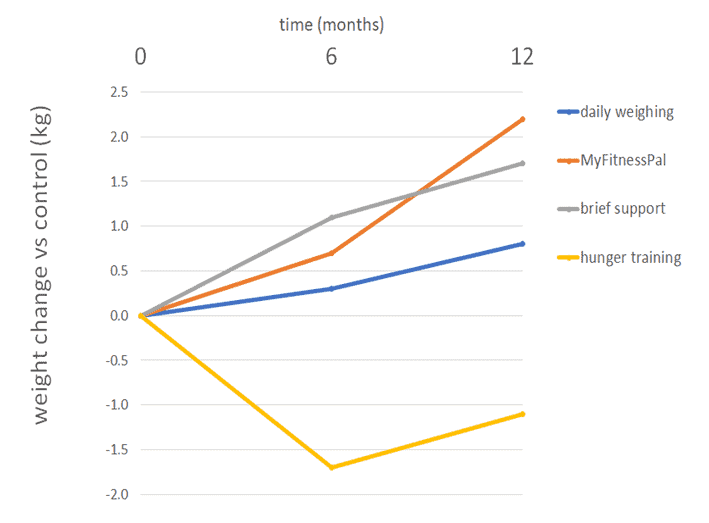
People did OK when they tracked their weight, which appears to have made them more aware of their eating. However, the best outcomes were achieved by study participants who used Hunger Training with their pre-meal blood glucose levels to validate their hunger signals and verify their actual need for food.
Counterintuitively, participants using the MyFitnessPal app saw the most significant increase in weight of the four approaches tested. People seem to lose touch with their true hunger signals when they outsource their satiety to a ‘smartphone’ app. The study also found that depression, anxiety, and stress worsened for participants who used MyFitnessPal.
Tracking blood glucose is empowering. It provides immediate feedback on whether you need to eat now or wait a little longer. Validating your food needs based on your blood glucose gives you greater control. But most importantly, hunger training allows you to reacquaint yourself with your healthy hunger signals.
When you see high blood glucose numbers, you can immediately reflect on your last meal and understand how your unique metabolism responds. You quickly learn which meals keep your blood glucose higher for longer and learn to avoid them in the future. Conversely, you also learn which meals keep you fuller for longer and allow your blood glucose to return below your trigger sooner.
This sets you up for long-term success once you reach maintenance. Participants in various studies and our Data-Driven Fasting Challenges find they can predict their blood glucose based on their hunger cues, particularly as their blood glucose decreases to healthy levels.
Hunger Training enables us to retrain our understanding of hunger based on our body’s actual need for fuel, and eventually without the need to be guided by our blood glucose meter.
For more details, see Hunger Training… How to Use Your Glucometer as a Fuel Gauge to Train Your Appetite For Sustainable Weight Loss.
The Data-Driven Fasting System
While the research is fascinating, we realised we could make improvements to make the process more practical and effective. So, we created a comprehensive system for sustainable weight loss and long-term maintenance, as outlined below.
- Identifying your initial pre-meal blood glucose trigger is critical to Hunger Training. In Data-Driven Fasting, we use your average blood glucose before you eat — calculated by the DDF app during your three days of baselining — to establish your personalised trigger.
- When you move into the Hunger Training phase, you only need to let your blood sugar drop slightly below your current average (rather than meeting some arbitrary target).
- You will progressively drain your stored energy as you delay your meals a little. Before long, you will find it easier to reach your initial trigger as your body adapts and you deplete your excess energy stores.
- To ensure progress, the DDF app automatically updates your trigger based on the average of your past seven days of premeal blood glucose values. This moving target ensures that you continue to move toward your goals, but not so fast that you wake your reptilian instincts and end up in a rebound binge.
- Data-Driven Fasting also shows you how your food affects your unique metabolism and how to make better food choices to see your glucose drop below trigger sooner.
Next Steps
- If you’re eager to get started, you can access the Data-Driven Fasting app here. All you need is a glucometer to check your blood glucose to find your premeal glucose trigger.
- Join our Optimising Nutrition Community here, where you can ask any questions and share your journey.
- Keep reading below to learn more about Data Driven Fasting. The FAQs in this manual are effectively a user guide for your metabolism that will show you how to manage your blood sugars, lose weight, reverse your diabetes and optimise your metabolic health.
- Join the next Data Driven Fasting Challenge, which will guide you through a structured process to tame your blood glucose for weight loss and optimal metabolic health.
This is a great article! I have been following the keto diet for a while now and I have to say that I really like the data-driven approach to fasting. I have been trying to use my blood glucose as a fuel
Awesome. Thanks. Glad you found it helpful. It’s been super cool to see so many people have success with DDF.
This sounds useful. I have tried a few fasting programs with little success because of Lizzy on the rampage.
DDF is great because it specifically manages Lizzy to help you avoid over fasting which leads to binging and stalling out. I love the great results we get after every challenge! https://optimisingnutrition.com/tag/data-driven-fasting-results/