Diet Quality and Weight Loss: A Deep Dive
Unlock the secrets of diet quality vs macros for satiety & weight loss with our in-depth analysis. Discover the best path to a healthier you!

Explore satiety: unlock the secrets to fullness & nutrient-dense diets on Optimising Nutrition. Dive into science-backed guides, tips & tools for sustained hunger control.
Unlock the secrets of diet quality vs macros for satiety & weight loss with our in-depth analysis. Discover the best path to a healthier you!

Explore how processed foods exploit our cravings and learn strategies for a healthier diet. Transform your eating habits now!

Discover the realm of optimal nutrient intake and its significant impact on satiety and overall health. Uncover the differences between recommended nutrient intake, optimal daily allowance, and optimum daily intake to harness the full benefits of nutrition.
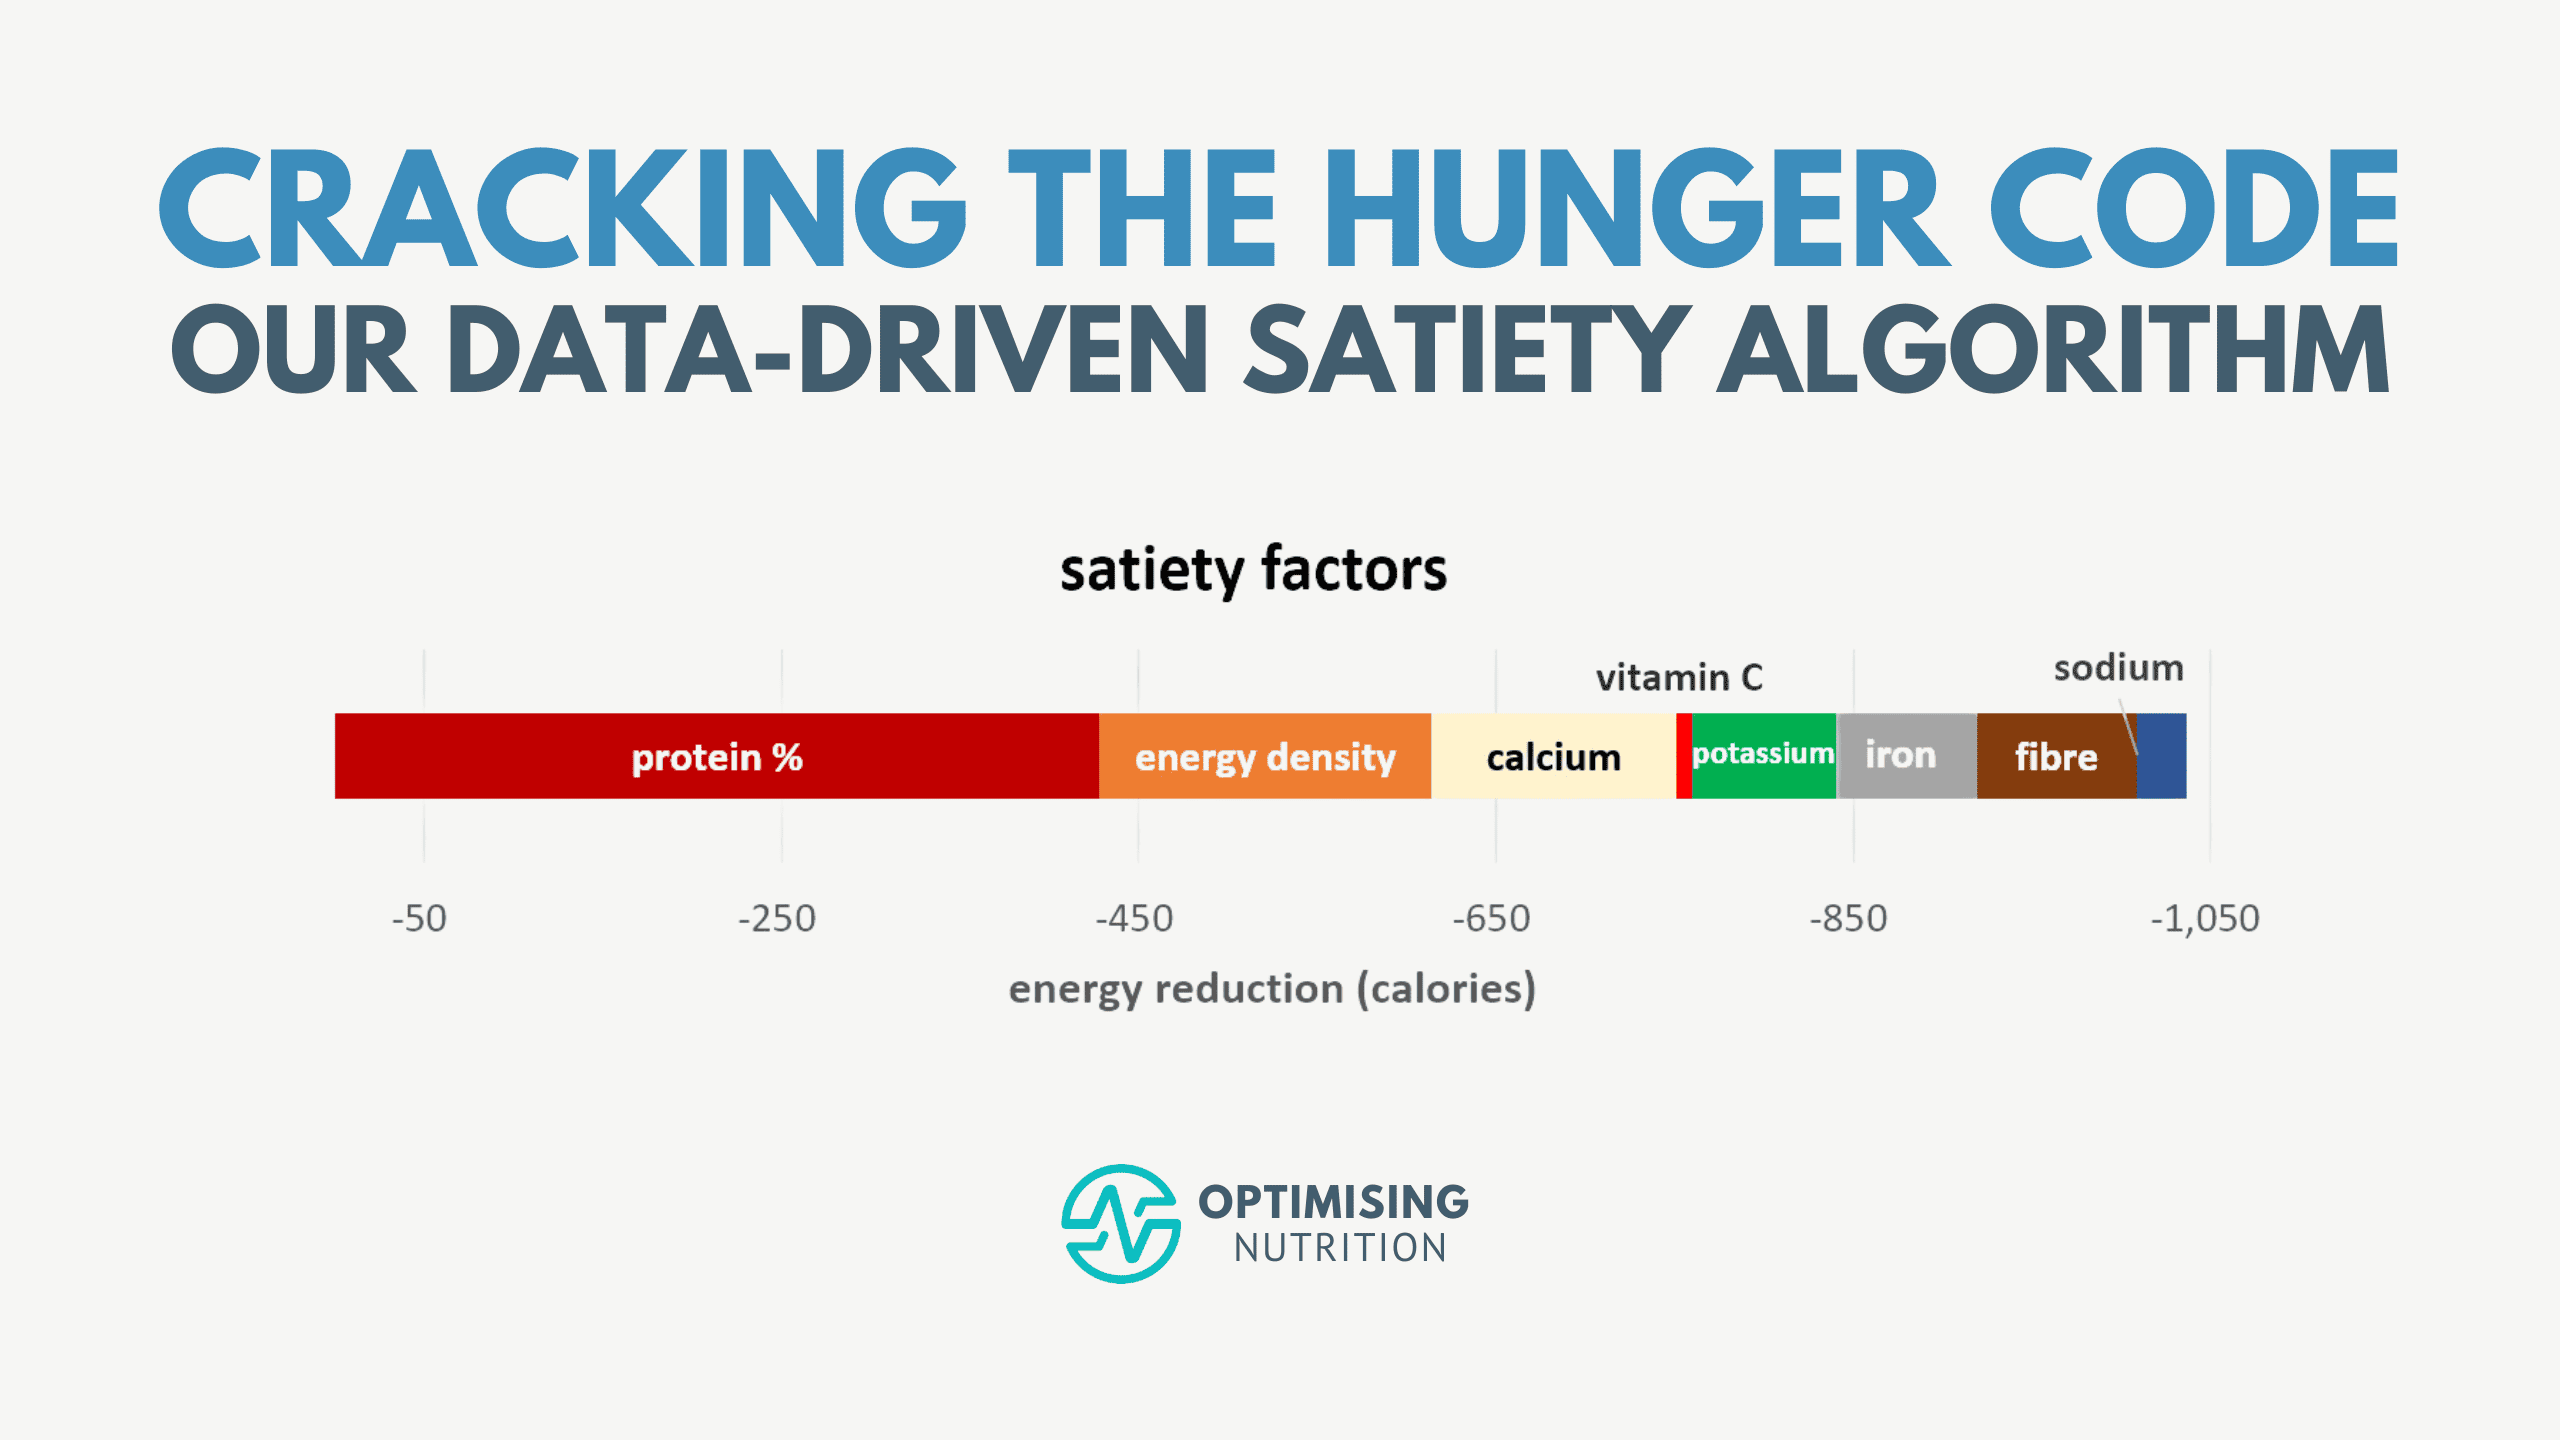
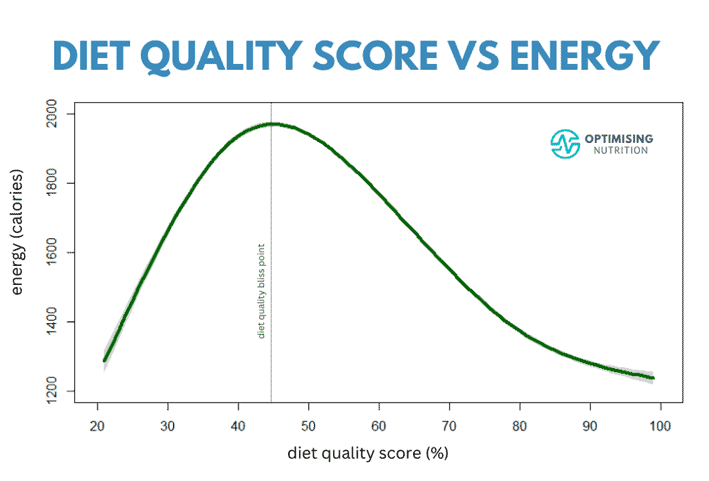
Crack the secret satiety code: Discover the data-driven formula to transform your eating habits & master fullness!
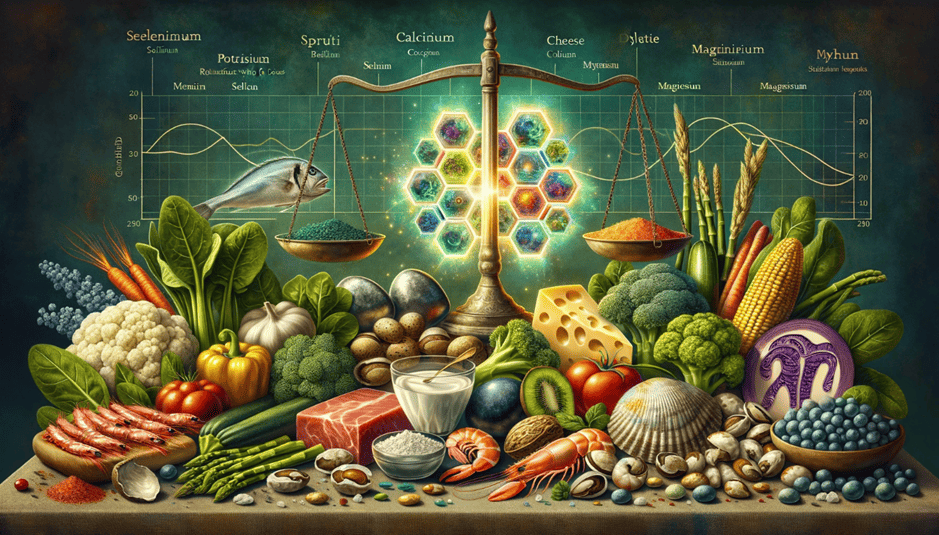
Explore the unseen influence of minerals on appetite and satiety and how they could be key players in shaping our dietary choices and health.

Unlocking the secrets of vitamins for weight loss: How nutrient-dense foods influence satiety and caloric intake.
Explore the synergy between macronutrients and micronutrients and their impact on health. Discover how a balanced approach to both can lead to improved diet quality and better nutrition.

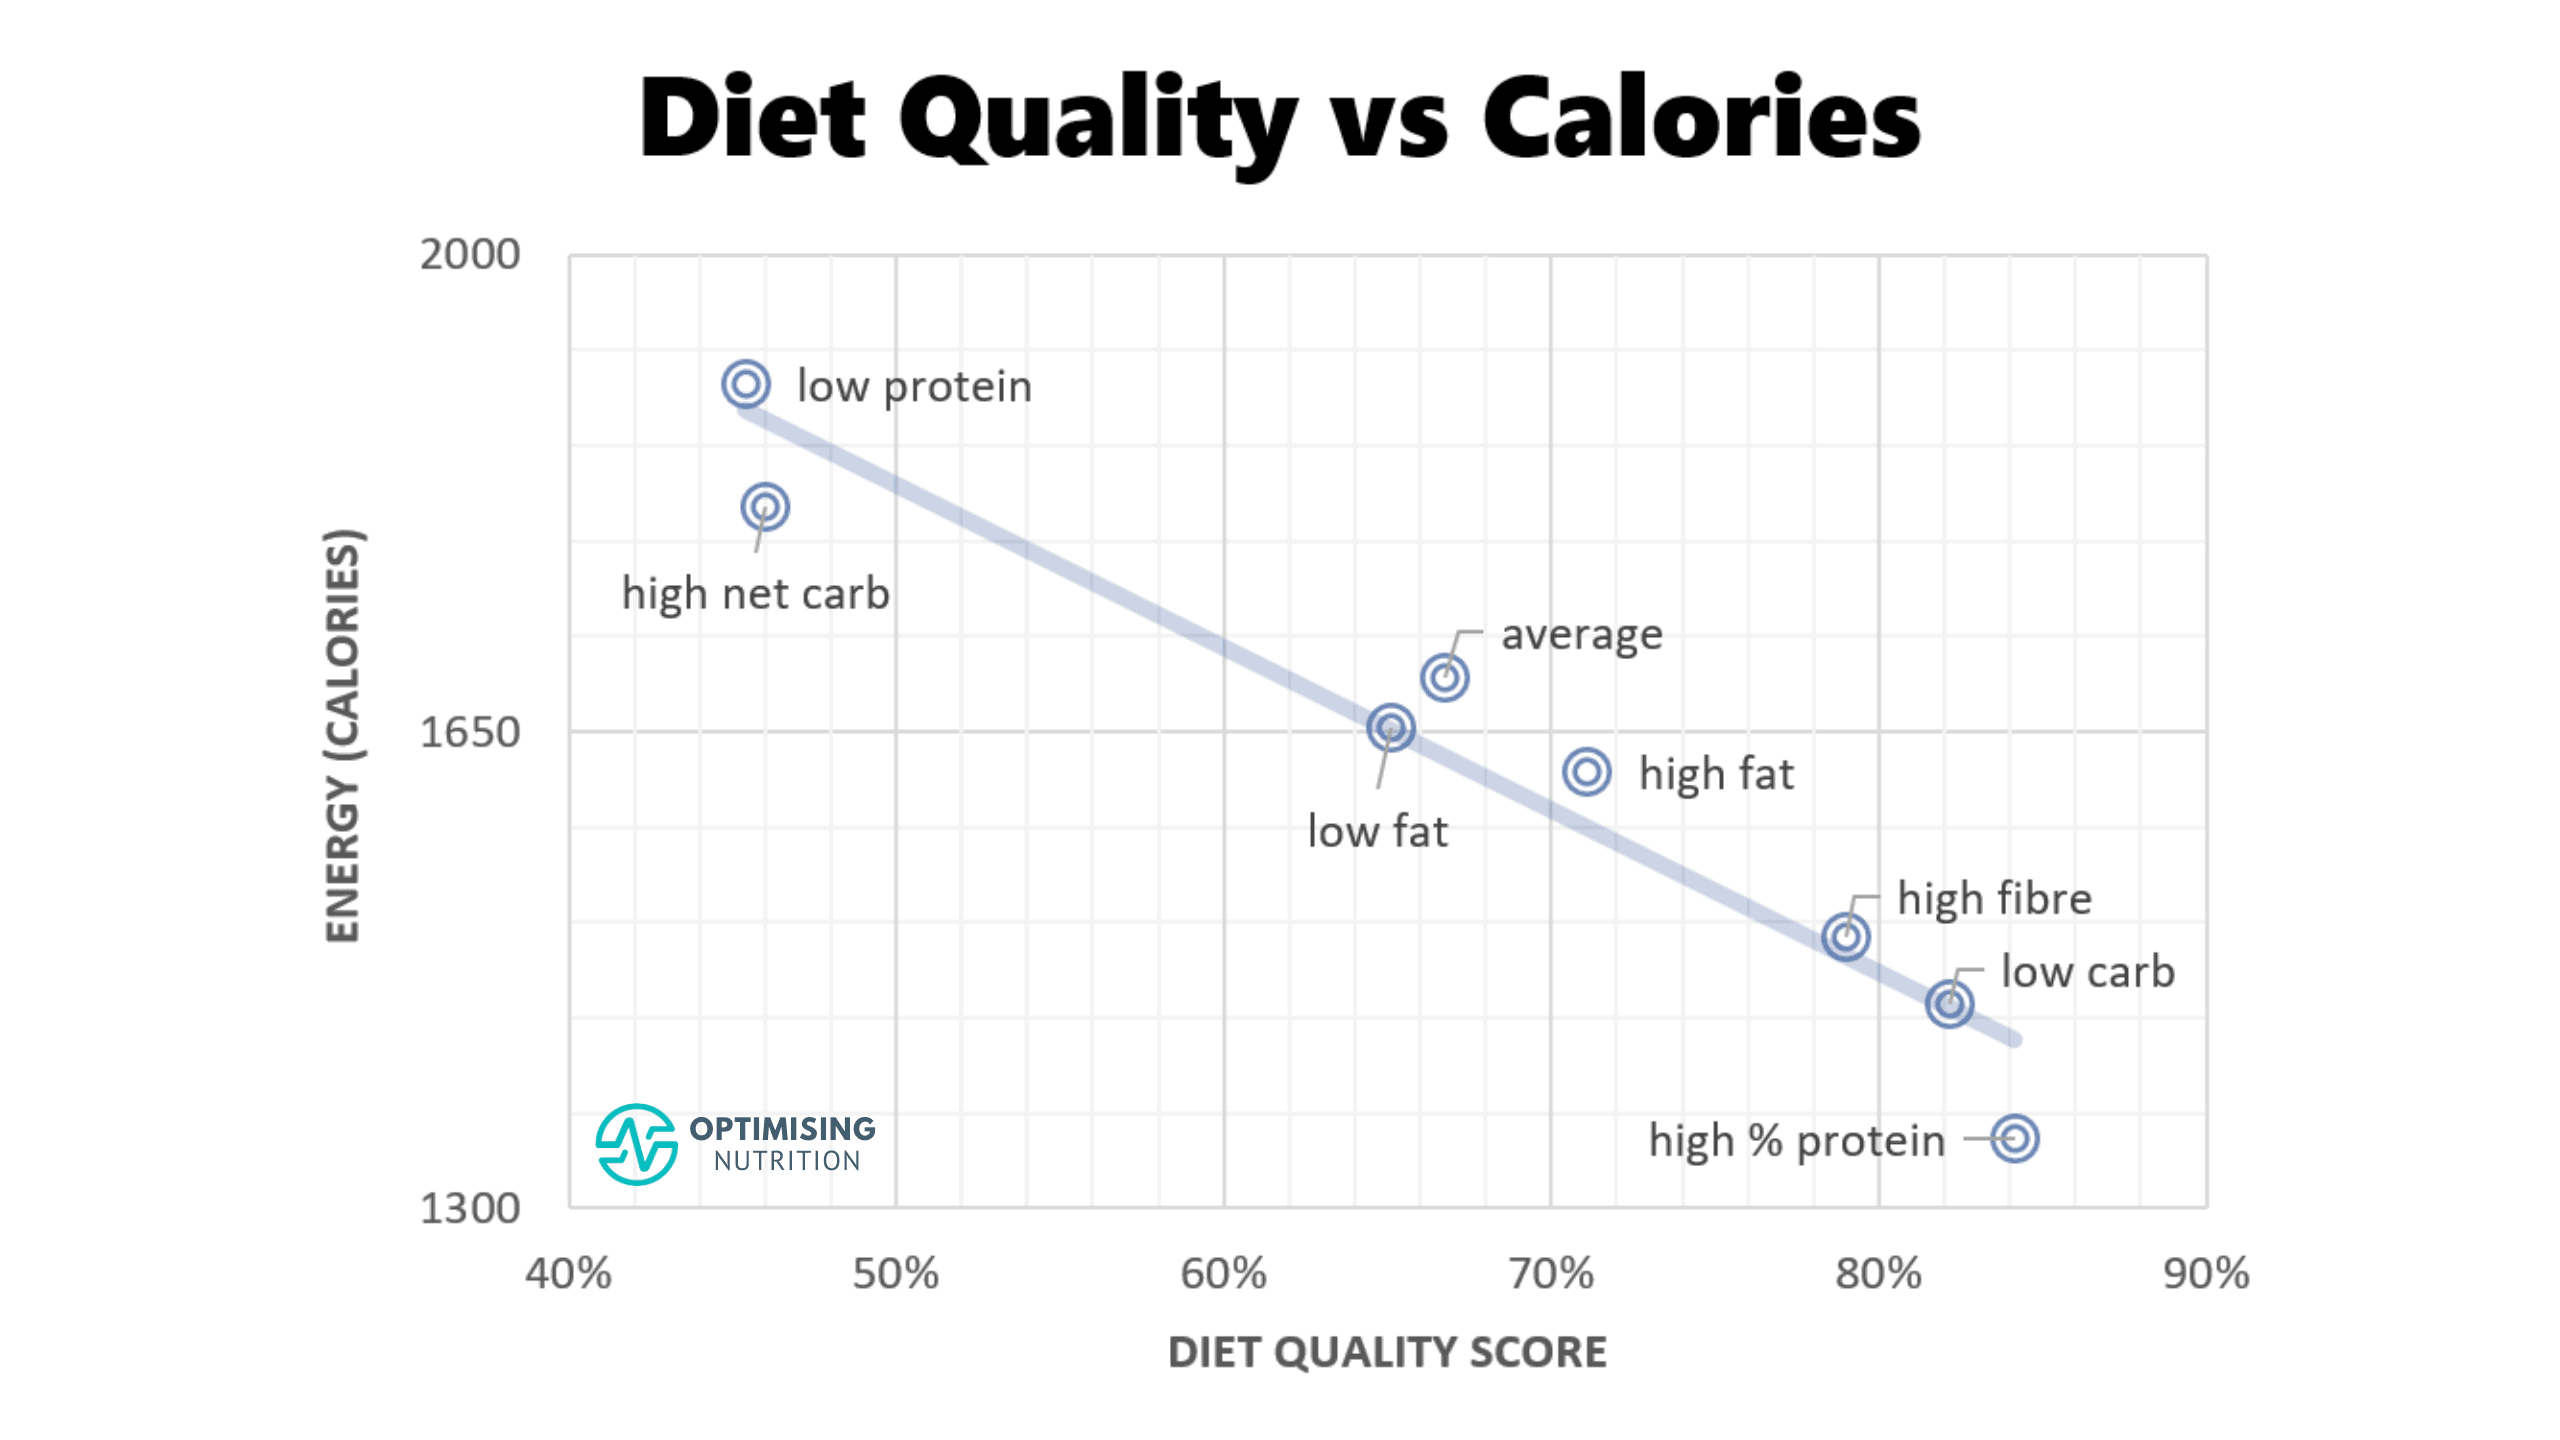
Explore the science of personalized satiety to successfully navigate low-carb or low-fat diets. Uncover how individualized satiety insights lead to effective weight loss, enhanced diet satisfaction, and sustainable health improvements.

Explore the multifaceted role of dietary fiber in human nutrition and health. Uncover the science behind its benefits and the myths surrounding its necessity in our diet.

Explore the groundbreaking approach of achieving satiety with fewer calories and how it challenges the traditional calories in-calories out model, paving the way for sustainable weight loss and improved metabolic health.