

Professors Stephen Simpson and David Raubenheimer have identified what appears to be the universal explanation for obesity – the Protein Leverage Hypothesis.
The Protein Leverage Hypothesis demonstrates how our appetite for protein will drive excess energy intake and, consequently, obesity when the proportion of protein in our diet is low.
However, counterintuitively, they also caution against swinging to extreme protein intakes and have concluded from their laboratory research in mice that high-protein diets may not be optimal for longevity.
Passionate debate aplenty surrounds this topic. However, particularly since the publication of Eat Like the Animals, the professors have been eager to join the public discussion. I’ve lined up a chat with David and Stephen (along with Dr Ted Naiman) to explore this topic further.
This article details some of my thoughts as I have been diving into the implications and application of this groundbreaking research, particularly around how and why protein might influence your lifespan.
What you will learn
- Raubenheimer and Simpson’s extensive work has demonstrated that a diet with a higher percentage of protein and fibre (i.e., less fat and/or carbs) aligns with greater nutrient density.
- Because we get the nutrients we need from fewer calories, our cravings are satisfied, and we eat less.
- Due to the increased satiety, a nutrient-dense diet with more protein and fibre and less fat and non-fibre carbohydrate will likely lead to weight loss.
- While being overweight is associated with many of our most diseases, being underweight (e.g., a BMI of less than 20) can also reduce short-term and long-term health.
- To gain weight, you should increase your energy intake from carbs and fat (thus reducing the percentage of protein in your diet).
- However, if you’re part of the growing majority of people who are overweight, reducing fat and/or non-fibre carbs will tend to lead to greater satiety and fat loss.
- Once you reach a healthy weight, you should re-introduce more energy from carbs, fats, or both to prevent excessive weight loss.
The table below shows how you can optimise your diet depending on your context and goals.
| Goal | What to do | How to do it |
| Stabilise blood sugars | Reduce carbs slightly | Incrementally reduce refined carbs until blood sugars after meals are in the healthy range (i.e., rise after meals < 30 mg/dL or 1.6 mmol/L). |
| Fat loss | Increase protein % gradually. | Dial back energy from dietary fat and/or carbs. Continue until waist: height ratio is < 0.5 and waking glucose is < 100 mg/dL or 5.6 mmol/L. |
| Maintain weight | Focus on nutrients | Add more nutrient-dense foods and meals. |
| Gain weight or support activity | Step down protein % by small degrees | Increase energy from fat and/or carbs. |
Read on to explore further the hows and whys of dialling in your macros and nutrient density for more optimal health and longevity.
- What you will learn
- What is the Protein Leverage Hypothesis?
- Markers of longevity in humans
- Why do the ripped and shredded mice die earlier?
- When should humans avoid high-protein diets?
- Where did the low protein messaging for longevity messaging come from?
- Population vs. Personalised Nutrition
- What is driving the diabesity epidemic?
- It’s about protein percentage, not more protein
- How much protein should I eat?
- Protein vs. nutrient density
- Obesity: Nutrient Leverage Hypothesis
- How much protein do you need?
- How to optimise your diet in an unnatural environment?
- What to do
- Protein and nutrient leverage – tailored for your goal
- Summary
- How Can I Calculate My Nutrient Intake?
- Level Up Your Nutrient Density
What is the Protein Leverage Hypothesis?
Over decades of systematic research researching the eating behaviours of a range of organisms (including slime, insects, mice, primates, and humans), entomologists David Raubenheimer and Stephen Simpson identified a robust common appetite for protein in all living things.
They also isolated separate appetites or cravings for other macro and micronutrients. Thus, beyond protein leverage, there appears to be a micronutrient leverage effect. More on that later.
In the wild, organisms seek out food until they get the protein they need. Animals tend to prioritise protein and then go in search of energy (and other nutrients). When we can’t access adequate nutrients from the available food, we over-consume energy in the pursuit of adequate protein and nutrients.
Given access to a wide variety of species-appropriate foods, our sophisticated instincts and appetite solve the complex nutritional puzzle. Thus, we obtain enough of all the nutrients we require over the long term.
Every living organism has a unique and variable optimal target for nutrients, depending on life stage, activity levels, and goals. Raubenheimer and Simpson recently summarised this concept in their book, Eat Like the Animals.
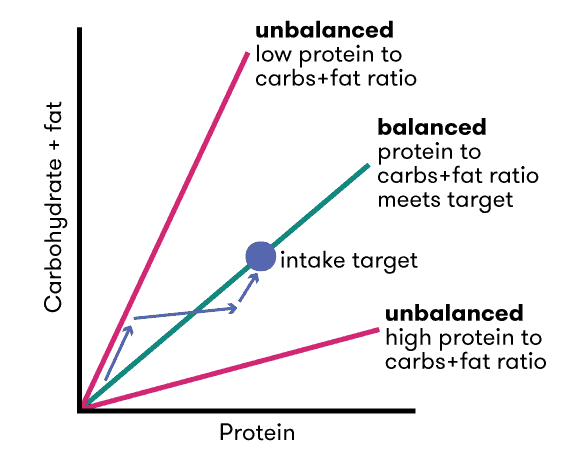
The chart below, reproduced from their 2005 paper, Protein Leverage Hypothesis of Obesity:
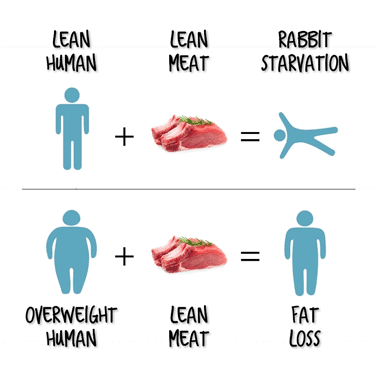
- if we only have access to higher protein foods, we undereat energy (and lose weight); however,
- if we only have access to low-protein % foods, we eat more energy than we need (and gain body fat).
Hyper-palatable, high-profit margin, ultra-processed foods tend to combine carbs and fat with low protein. The reason we eat more than we need to is not due to the carbs or the fat, but rather the dilution of nutrients (particularly protein) in our food system.
The inference of the Protein Leverage Hypothesis is that:
- If we have excess body fat, prioritising protein (by reducing foods that are a mixture of carbs and fat) leads to greater satiety per calorie, decreased appetite, and, eventually, weight loss.
- Conversely, if we are lean and active, we would benefit by adding energy from carbs and fat, reducing the percentage of protein in our diet, thereby preventing excessive weight loss and promoting maintenance.
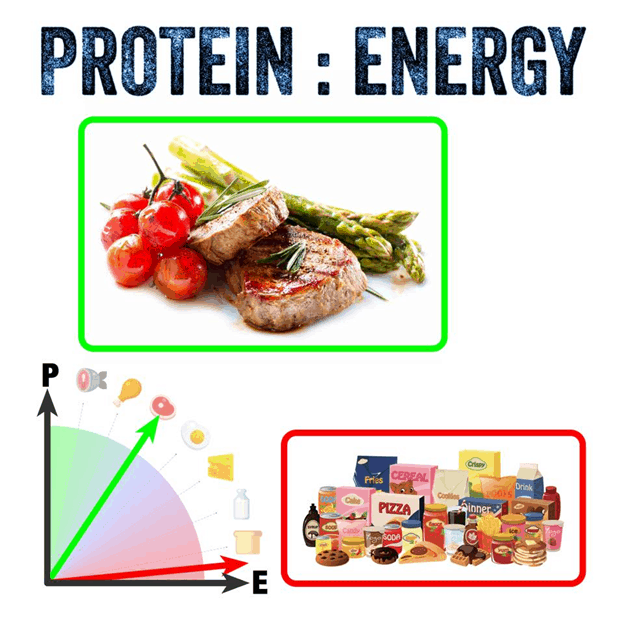
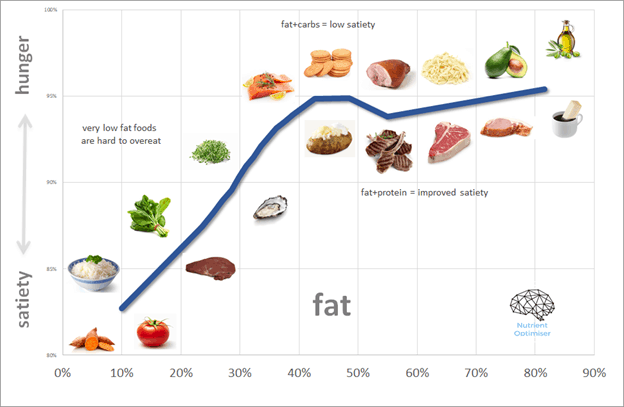
Optimising Nutrition advisor Dr Ted Naiman has done some brilliant work simplifying and popularising the P:E ratio.
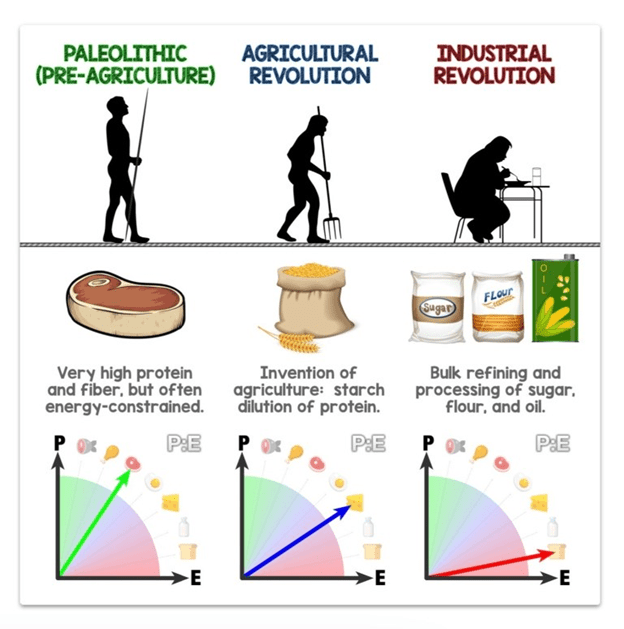
The P:E concept empowers us to cut through the “good” vs. “bad” beliefs about food and rank all foods on a spectrum of satiety.
- At one end of the spectrum, we have obesogenic croissants and doughnuts (which provide energy in a combination of refined fat and carbs).
- At the other extreme, we have chicken breast, egg white, and broccoli (i.e., a typical high protein and fibre diet used by bodybuilders to lean out).
Markers of longevity in humans
While Raubenhiemer and Simpson have compiled an impressive body of research, their studies are somewhat murky regarding minimising protein for longevity, especially without offering quantitative guidance for humans. Unfortunately, it’s difficult to apply research in slime, apes, and mice directly and correlate it to optimal protein consumption in humans.
We often hear that high protein diets could reduce the lifespan in mice and worms, and our kneejerk reaction is to switch to a high-fat keto or low-fat plant-based diet (or worse, double down on ultra-processed low-protein high-profit margin foods).
Inflammatory sound bytes and headlines often provoke interminable debate and palpable angst on social media from the equally passionate high-carb vs. high-fat vs. high-protein camps.
In humans, excess body weight strongly correlates with decreased longevity.
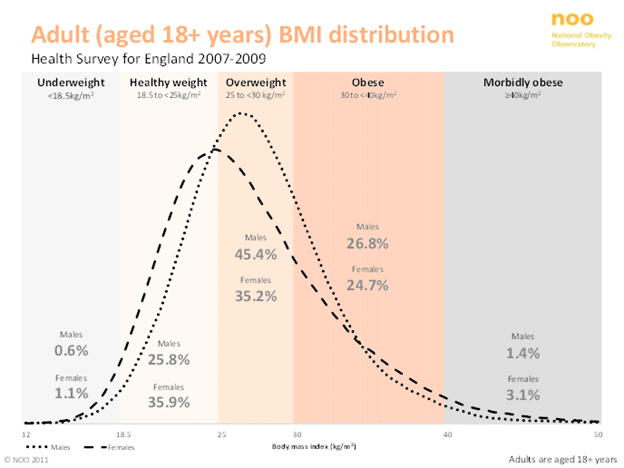
Body mass index vs. longevity
As shown in the chart below, a body mass index of between 25 and 30 seems to be the sweet spot to minimise your risk of dying from any cause.
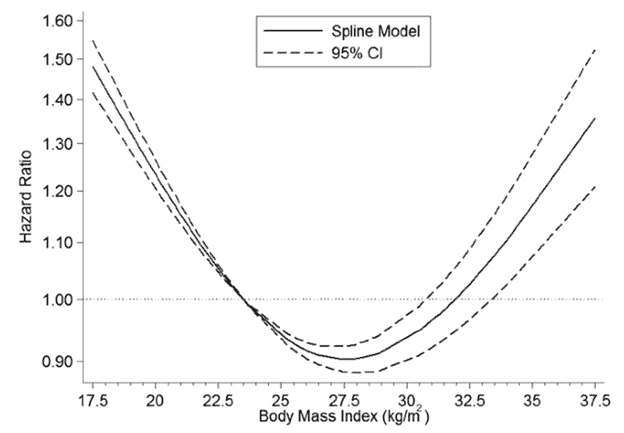
To avoid various types of cancer, you might even want to maintain an even lower BMI of around 20.
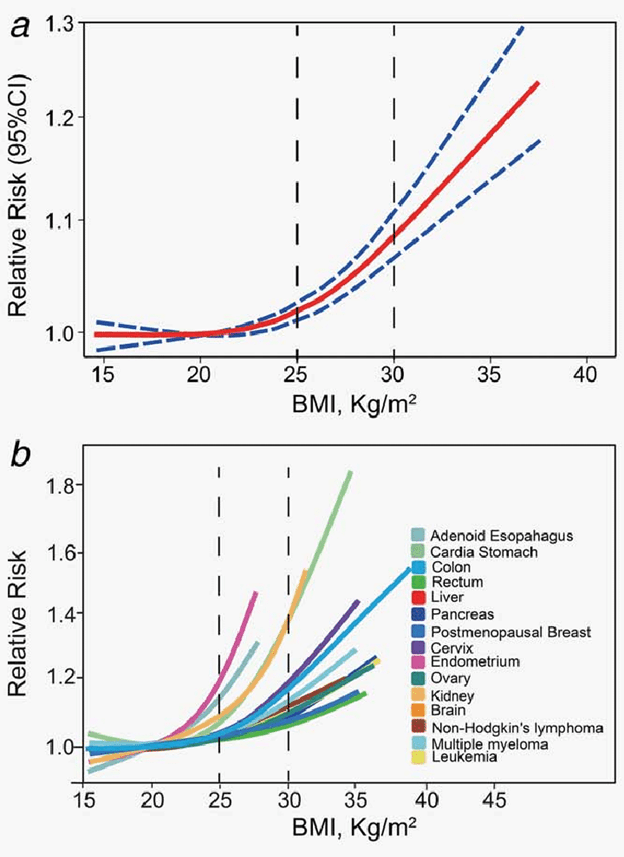
For more details on what to eat if you have been diagnosed with cancer, refer to this article written with Optimising Nutrition advisor and oncologist Dr Brian Lewnda, based on the fantastic work of Professor David Sabatini.
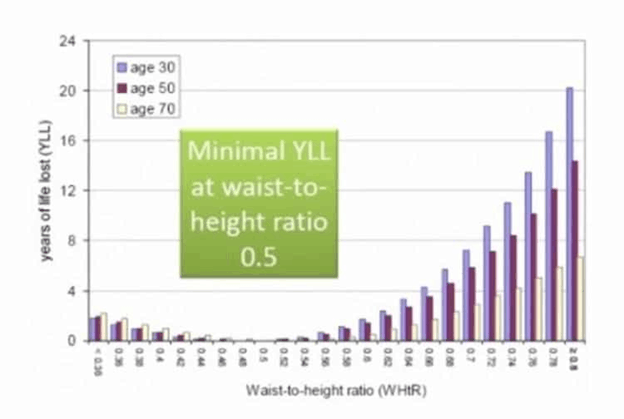
Waist-to-height ratio vs. longevity
While BMI is easy to measure and frequently used, waist-to-height ratio is an even more useful measure of your risk. A waist-to-height ratio of around 0.5 appears optimal to reduce your risk of dying of any cause. The chart below shows that someone at 30 years of age with a waist-to-height ratio of greater than 0.8 is likely to die 20 years earlier than someone with a waist-to-height ratio of 0.5!
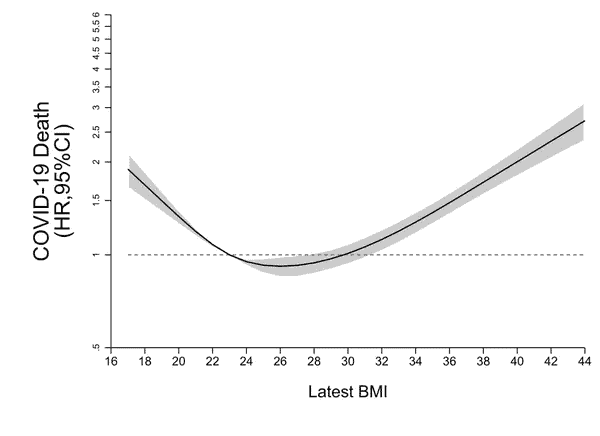
Immunity
Being overweight also reduces your immunity. A recent study published in The Lancet suggests that a BMI of 23 – 30 minimises the risk of death by COVID-19 in infected patients.
Blood glucose vs. longevity risk
The chart below shows that waking glucose of less than 100 mg/dL (or 5.6 mmol/L) also aligns with longevity.

An HbA1c (the average of blood glucose measures over approximately three consecutive months) of greater than 5.6% (i.e., prediabetes) aligns with a shorter life span. You will be diagnosed with type 2 diabetes once you reach an HBA1c of greater than 6.5%.

IGF-1/mTOR/insulin vs. longevity
Again, we see a similar trend with IGF-1, mTOR, insulin, etc.

Excessive growth-related hormones align with heart disease, cancer, Alzheimer’s, dementia, etc. Though often referenced as reducing longevity (e.g., too much protein drives mTOR/IGF-1/insulin, hastening death), these metrics are rarely measured in humans and are of limited use in guiding your everyday life health journey. The production of growth-related hormones is influenced by protein intake and overall energy consumption, which leads to obesity.
“The anti-IGF-1 (insulin-like growth factor) crowd confuses me. Lots = bad (cancer). Very little = also bad (sarcopenia and broken hips).” — Dr. Tommy Wood
While many people speculate that mTOR, IGF-1, and insulin accelerate aging, these are still only mechanistic theories. To my knowledge, there are no human studies to validate this theory.
Until scientists validate these mechanistic theories in humans, I believe your safest bet is to eat in a way that will:
- provide greater satiety, so you’re not always hungry,
- give you the nutrients you need without excess energy, and
- naturally, lead you to ideal body composition.
Fertility and attractiveness
Interestingly, we also see that fertility aligns with a BMI of between 19 – 25. Being overweight reduces your chance of conception. Your body doesn’t want to procreate if you’re overweight or underweight.

Note that perceptions of health and attractiveness also align with a BMI of around 20. We tend to be attracted to people who appear able to sire, bear, and raise healthy children.

The risk of being overweight or underweight
To summarise, most of us face diet-related risks due to energy toxicity (i.e., excess energy stored as fat or glucose).
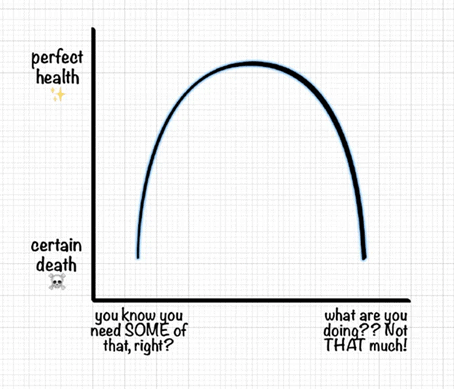
However, you may have noticed that optimal does not lie at either extreme in all of the above charts.
There are risks to being overweight just as there are risks to being underweight, including:
- sarcopenia (muscle loss in aging),
- frailty (leading to fractures and ongoing complications in old age),
- reduced immunity,
- reduced fertility,
- reduced muscle mass,
- reduced attractiveness,
- decreased glucose tolerance due to inadequate muscle to use the energy you consume, etc.
You need only increase the protein percentage of your diet until you achieve these healthy markers of longevity. Pushing even further to the point that you are underweight could be detrimental to both your long-term and short-term health.
Raubenheimer and Simpon argue that a diet with a high percentage of protein is a temporary “therapeutic” intervention. Once you reach a sustainable healthy weight and body fat percentage, you should bring back energy from fats and carbs.

Why do the ripped and shredded mice die earlier?
Raubenhiemer’s and Simpson’s research used mice extensively to understand appetite and in an attempt to understand how we can make changes to our nutritional guidelines at a population level. Unfortunately, studies in mice can be difficult to apply practically to humans with different contexts and goals.
As discussed in this previous article, Raubenheimer and Simpson’s first mega mouse study used their Geometric Framework (GF) analysis (shown below), indicating that the longest-lived mice consumed a low-protein, high-carbohydrate diet.
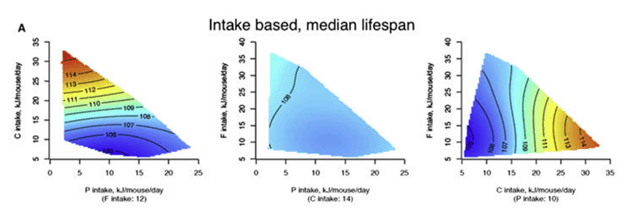
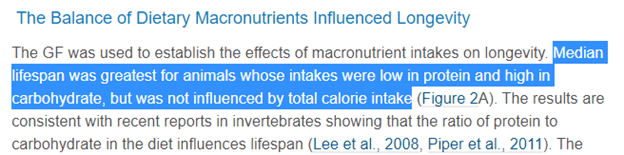
To better understand the impact of high-protein vs. low-protein, I re-analysed Raubenhiemer’s and Simpson’s data in terms of protein vs lifespan. As shown in the chart below, the mice on the highest protein diets didn’t live the longest. But the longest-lived mice consumed a relatively high protein diet (7 g/day), while the shortest-lived mice were the ones on the lowest protein diets.
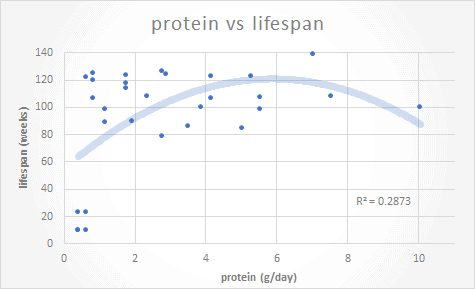
The following chart shows the data in terms of lifetime protein percentages for the mice. The mice who lived on a very high (60%) protein diet didn’t fare as well as the mice on a high-protein diet (42% protein). However, we need to remember that a typical protein intake for a mouse in the wild is around 23%.
To my eyes, the data doesn’t indicate that protein avoidance necessarily leads to longevity. However, it shouldn’t be too surprising that the mice who lived their whole life on a diet well above their typical protein percentage ended up significantly leaner than the others (i.e. underweight). As discussed above, being super skinny isn’t optimal for human longevity either.
When should humans avoid high-protein diets?
Q: What ramifications does the reduced life span of mice in captivity fed a 60% protein diet have for free-living humans with virtually unlimited access to cheap hyper-palatable ultra-processed obesogenic food?
A: Probably not a lot.
Let me explain.
Despite the media clickbait about “excess protein” and “decreased longevity,” no human studies validate the hypothesis that protein reduces lifespan.
A while back, a couple of experiments on monkeys in captivity generated substantive and passionate debate regarding the effects of calorie restriction on longevity.
- One study found that monkeys fed less zoo chow lived longer and looked much healthier.
- The other study fed the monkeys a more species-appropriate (nutrient-dense) diet and found no difference in either longevity or appearance.
It seems that the benefit lies in avoiding processed food rather than eating less.
The closest thing we have to caged humans living on high protein percentage diets is competition bodybuilders.

People who get to extremely low body fat levels are uncommon, and they often quickly regain body fat after these stage shows. Our intense cravings send us in search of energy-dense fat and carb foods to rebuild body fat.
The level of body fat shown in the photos above takes months of extreme discipline to achieve. And it doesn’t last for long either. Hours after the medals have been awarded, most competitive bodybuilders are face down in a box of doughnuts or at the ‘all you can eat’ burger joint. A few months later, many find themselves obese because their uncontrollable appetite relentlessly drives them to return to healthy body fat levels.
Symptoms of extremely low body fat levels in bodybuilders (as well as people with anorexia) include:
- low testosterone,
- loss of libido,
- depression,
- lethargy, and
- loss of menstrual cycle (for women).
But fortunately for them, bodybuilders are not locked in a cage with only protein powder, egg whites, and lean kangaroo steaks for food. If they were, they would continue to lose weight, including body fat and precious muscle mass, and would certainly be unhealthy.
When you reach a healthy level of body fat (i.e., 15% for men, 25% for women), waist-to-height ratio (i.e., 0.5) and waking blood sugar of less than 100 mg/dL or 5.6 mmol/L, for the love of all you hold dear, eat some carbs and fats, so you don’t starve death.!
But I don’t need to tell you that; your appetite will – it’s the reason (in the absence of anorexia nervosa or a bodybuilding competition) why people rarely attain the extremely low body fat levels that negatively impact health.
Where did the low protein messaging for longevity messaging come from?
In conjunction with their mechanistic understanding of excessive mTOR and IGF-1 growth pathways, many people point to long-lived populations like the Okinawans, Kitavans or the Seventh Day Adventists at Loma Linda (i.e. the “Blue Zones”). They conclude that, because of studies of c-elegan worms in Petri dishes and these longevity populations, “too much protein” must be bad and make you die earlier. This also makes sense because it is a common belief.
But you might also be interested to know that Adventist Health recently purchased the Blue Zones. So don’t be surprised if you start to hear more about protein and longevity based on the Blue Zones over the coming years.

While you may not have heard of them, the influence of the Seventh Day Adventist Church in our nutritional thinking and policy cannot be understated. This is a deep rabbit hole beyond the scope of this article, but it’s worth noting that their goal has to create processed foods (e.g. cornflakes, etc.) to avoid self-vice (masturbation) by avoiding animal flesh.
Their ‘medical evangelism’ is extensive and extremely well-connected across the global food and healthcare industries. Based on the teachings of their prophet, Ellen G White, they also believe that the Second Coming of Christ will not occur until enough people stop eating animal flesh.
Belinda Fettke has done some fascinating research into the influence of the SDA church on our current beliefs about food. It might sound like crazy conspiracy theory stuff to most people. But interestingly, my family were part of the SDA church until I was about 10, I went to an SDA primary school, and many of my relatives have worked for the Sanitarium or their hospitals for most of their life. I was the fat kid who grew up eating Weet-Bix and alternative meat products way before they were so trendy. Everything Belinda has dug up checks out with my experience. Interestingly, Dr Ted Naiman comes from an SDA family and went to Loma Linda University.
Belief-based nutrition is a powerful force and hard to stop with data or science. Beyond the SDAs, many people have ethical and financial vested interests in promoting the high-profit margin products of large-scale industrial agriculture. You need to take your nutritional advice with a grain of salt. For more on this, see The Perils of Belief-Based Nutrition.
Population vs. Personalised Nutrition
In nature, as with most things, optimal is rarely found at the extremes. While we all want rapid results, it’s usually better to make incremental changes that build sustainable habits.
In our Nutritional Optimisation Masterclass and Data-Driven Fasting Challenges, people build sustainable habits that make the best long-term progress. People who try to change everything at once find the process “too much” and ultimately “fall off the wagon.” They often “give up” after trapping themselves in a restrict-binge-restrict cycle they seemingly can’t escape.
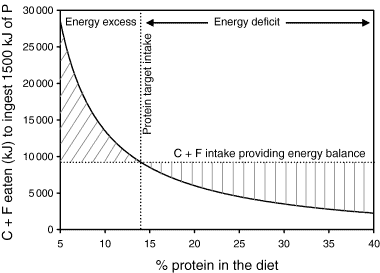
You only need to change enough to ensure you are moving towards your goals. As illustrated by the charts below from the original Protein Leverage Hypothesis paper:
- A modest decrease in protein intake from 15.5% to 14% will drive a 13% increase in energy from carbs and fats to compensate to obtain the additional protein.
- Conversely, increasing protein from 14 to 15.5% will cause an 11% decrease in energy from carbs and fat.

In their book Eat Like the Animals, Raubenheimer and Simpson point out that the amount of easily accessible energy from fat and carbohydrates has increased, which has led to a subtle dilution of the protein content of the food we eat.

What is driving the diabesity epidemic?
The chart below (created using data from the USDA Economic Research Service) shows that the amount of food available per person has increased by around 1000 calories per day since the green revolution in the 1960s.
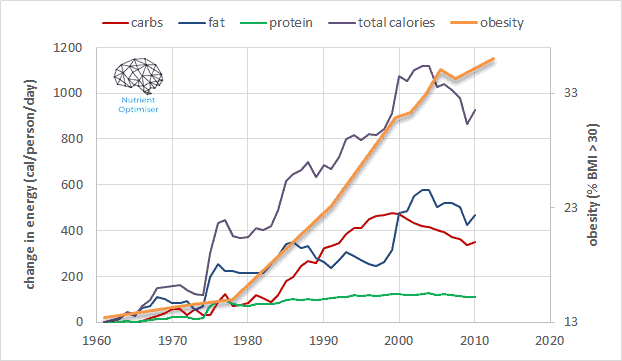
The majority of those extra calories have come from carbs and fats (fueled by synthetic fertilisers injected into our industrial, agricultural food system), with only a modest increase of energy from protein.
In their original 2005 Protein Leverage Hypothesis, Raubenheimer and Simpson hypothesised that as we become obese and insulin resistant, more of the protein we eat is lost to glucose (through gluconeogenesis) in the bloodstream. This deficiency drives us to increase protein consumption to compensate for the protein lost to excessive gluconeogenesis. Hence, the solution is not to lower protein but to reduce energy intake (from fat and carbs) to reduce body fat and thus restore insulin sensitivity. Later, once you become more insulin sensitive, you will require less protein.
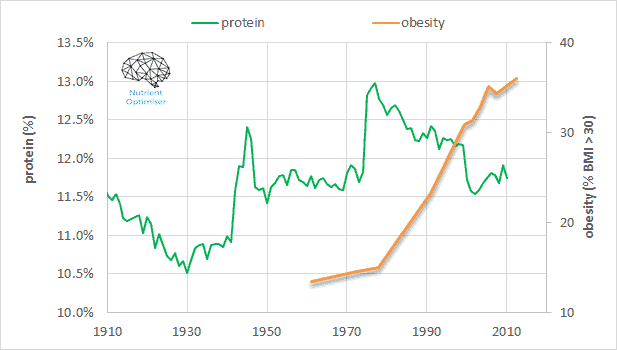
As shown in the following chart, protein intake has dropped from approximately 13% to about 11.5% since the 1977 introduction of the USDA Dietary Guidelines for Americans (published by the US Department of Agriculture). We now must now consume more energy at the risk of toxicity to get the protein (and other nutrients) we need to thrive. To reverse this situation at a population level, we needn’t make radical changes but minor adjustments to move in the optimal direction.
Professor Simpson recently stated in an interview that he finds the concept of “personalised nutrition” (e.g., measuring the gut microbiome to determine a personalised diet, or non-diabetics wearing CGMs) “uninteresting.” Instead, he prefers to focus on systemic changes that could make a difference for those who don’t want to be full-time biohackers.
While I largely agree with this sentiment, I believe we need to consider context and goals when creating public messaging about protein intake.
It’s about protein percentage, not more protein
One point that many people struggle to grasp in this discussion is that, when it comes to solving the nutrition puzzle, satiety is not simply about more protein – it’s about dialling back our intake of fats and carbohydrates, thus increasing protein percentage.
As shown in the chart below from our analysis of people using Nutrient Optimiser, protein tends to come packaged with fat, so simply eating MORE protein tends to lead to a greater overall energy intake.
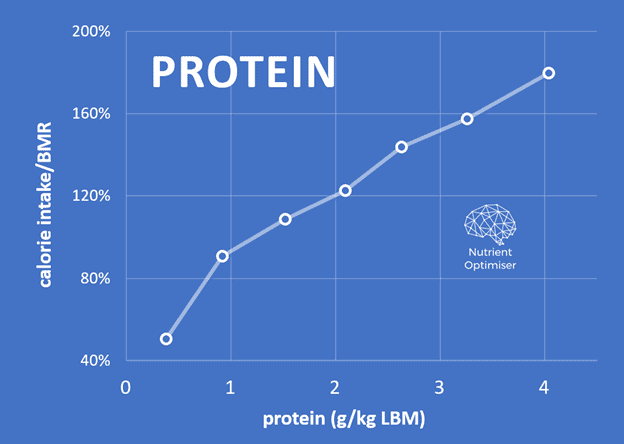
But as we dial back the fat and/or carbs in our diet, we tend to consume less energy.

Reduction in energy from carbohydrates and/or fats leads to a higher dietary protein percentage which aligns with a lower daily energy intake.
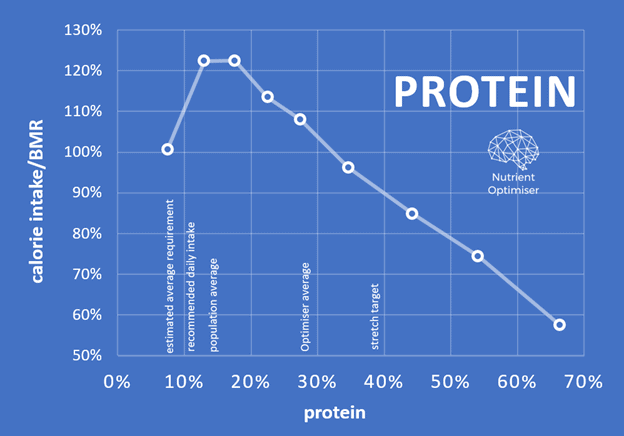
Although all vitamins, minerals, and essential fatty acids play a role, it’s the protein percentage that significantly impacts our satiety.
How much protein should I eat?
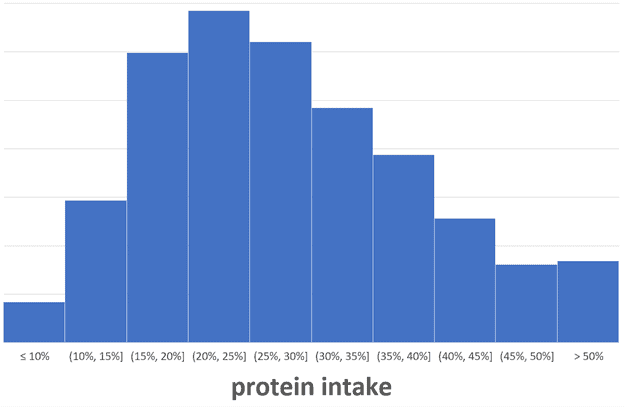
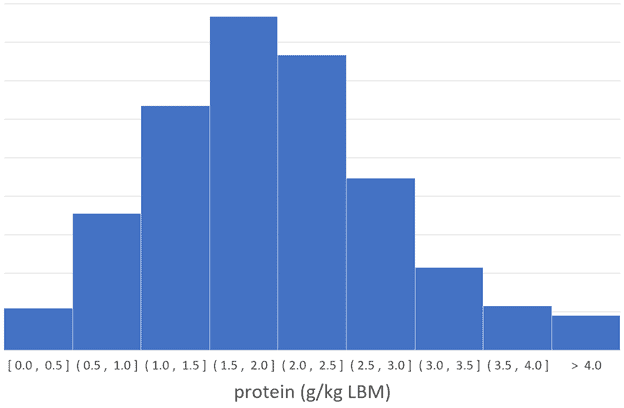
The chart below confirms that most people using Nutrient Optimiser derive about 20% to 25% of their energy from protein. Because we also crave energy from carbs and fats, it isn’t easy to consume a very high percentage of protein consistently.
Most people gravitate to an average protein intake of 2.0 g/kg LBM or 1.5 g/kg total body weight.
Protein vs. nutrient density
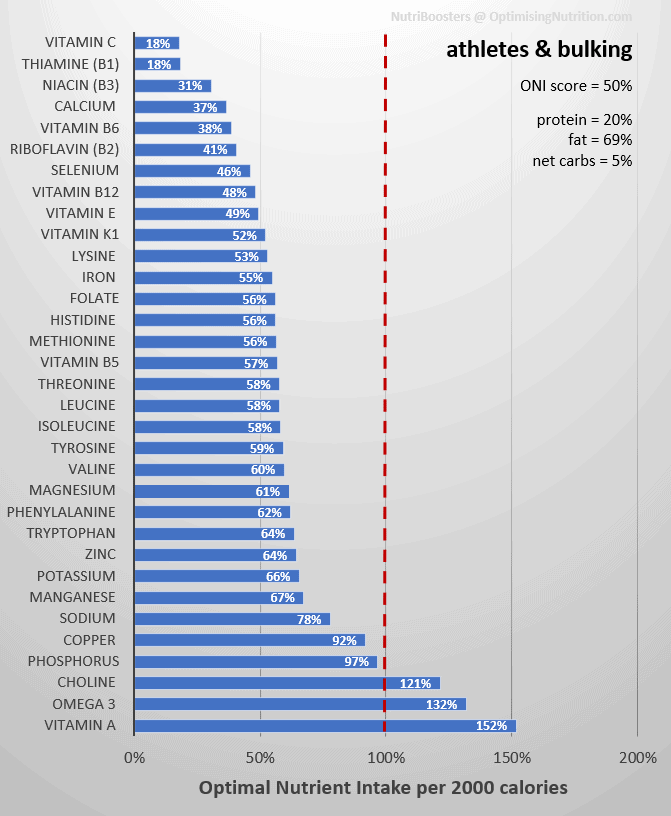
The chart below reflects our analysis of our NutriBoosters series of recipe books. A higher protein percentage aligns with greater nutrient density, peaking at about 50% calories obtained from protein.
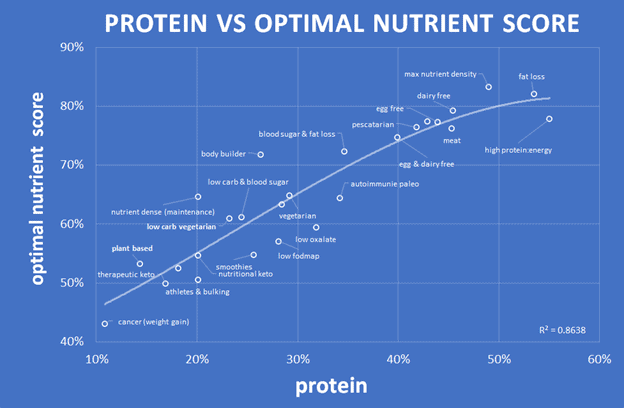
To the chart left, you can see that lower protein percentages lead to lower nutrient density. The chart below shows protein % vs the optimal nutrient intake score for all the recipes analysed for our NutriBooster recipe books.
Rather than taking a quantum leap from 10% to 50%, we encourage people to ensure they are getting adequate protein and then dial their energy from fat and carbs either up or down based on their goals (e.g., blood sugar management, weight loss, or fueling athletic performance).
Obesity: Nutrient Leverage Hypothesis
But beyond protein leverage, I believe optimal nutrition is really about nutrient leverage.
It appears that obesity could be explained as a response to a low-quality food environment. If your body senses there is a lack of quality food, it must store energy for the coming famine. However, if high-quality, nutritious food is always available, then there is no need to store fat for the coming emergy.
If we have excess levels of stored energy (i.e., energy toxicity), we need to find a way to increase the nutrients in our food and reduce the energy.
Beyond amino acids, Simpson’s and Raubehneimer’s work has identified mechanisms that drive our appetite for other nutrients (e.g. fat, carbs, calcium and sodium).
Unfortunately, other than our analysis of the satiety response to the essential vitamins and minerals used to develop the Optimal Nutrient Intake (ONI), there has been minimal study of the orchestration played by various nutrients to satisfy our cravings. Fred Provenza’s work on animals is probably the best available.

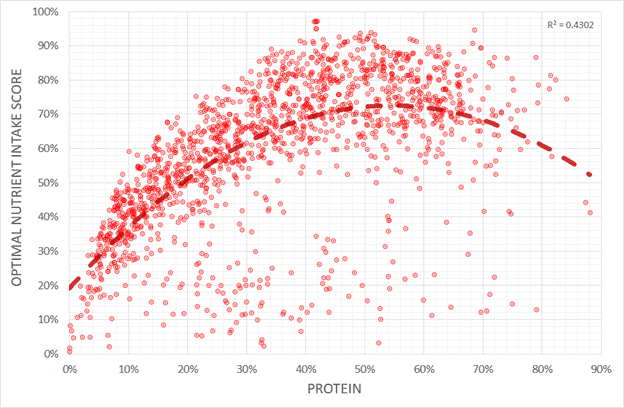
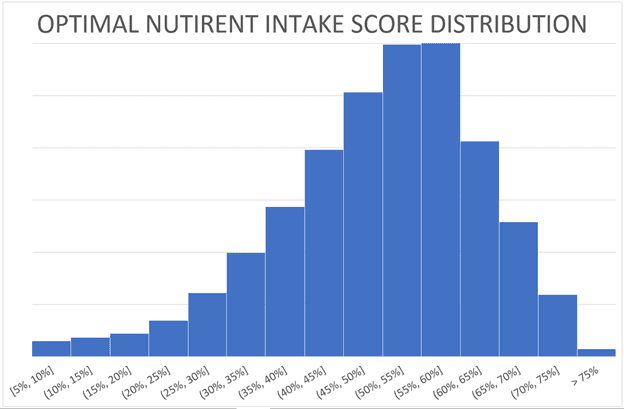
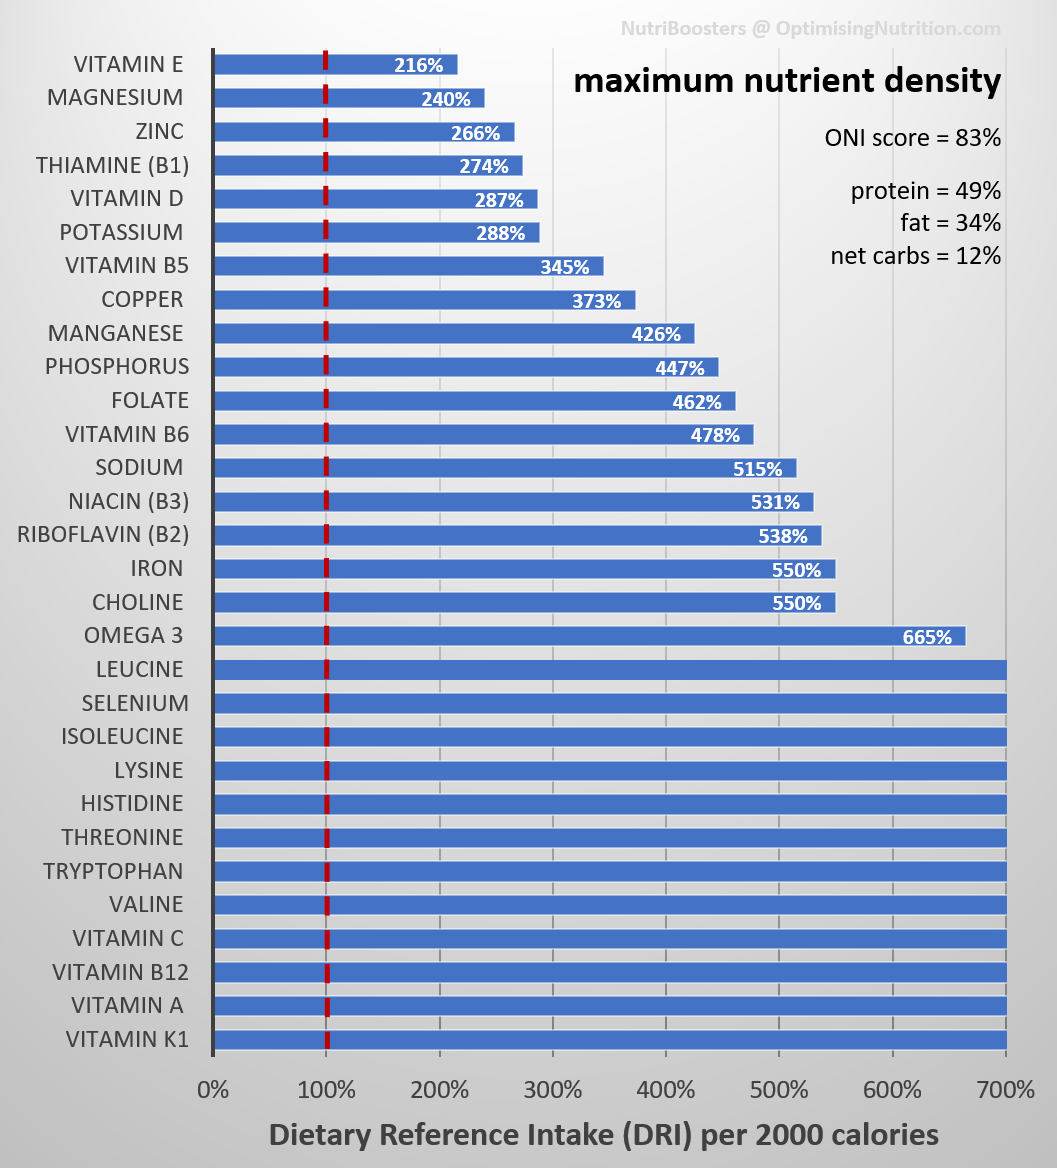
In the Nutritional Optimisation Masterclass, we guide people using Nutrient Optimiser to get all the essential micronutrients they require without excess energy. The chart below is from Karen, who topped our nutrient-density leaderboard. The x-axis is nutrients per 2000 calories, so the optimal nutrient intake score measures food quality, irrespective of quantity. If you fill in everything to the left of the black line, you get a perfect score of 100%.

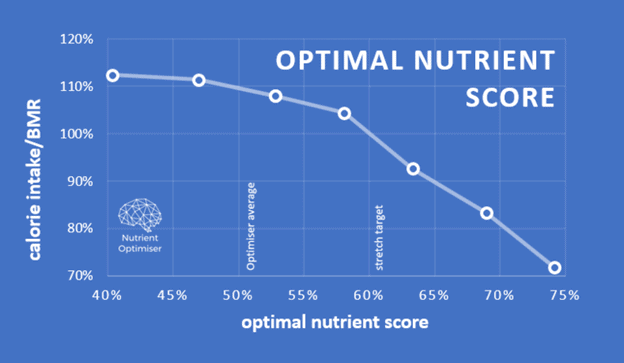
As shown in the chart below, a higher Optimimal Nutrient Intake Score leads to greater satiety and lower energy intake.
The following chart shows that most people have an ONI score that hovers around 50%. A score of 100% is very tough to achieve, but we regularly see perfect numbers in our Masterclassv as participants chase the foods and meals they need to solve their nutrition puzzle.
How much protein do you need?
Because protein strongly correlates with nutrient density and satiety, we encourage people to aim for a minimum protein intake of 1.4 g/kg LBM. If you want to see what this looks like for you, you can use our macro calculator.
To help understand whether more or less protein corresponds with solving the nutrient leverage equation, I dug back into our database of 36,969 days of data from more than a thousand people (not mice) using Nutrient Optimiser.
I suspected a very high protein intake might correspond with a slightly lower nutrient score. But as you can see in the charts below of protein (in terms of g/kg lean body mass and g/kg body weight), more protein (in absolute terms) corresponds with more nutrients per calorie.
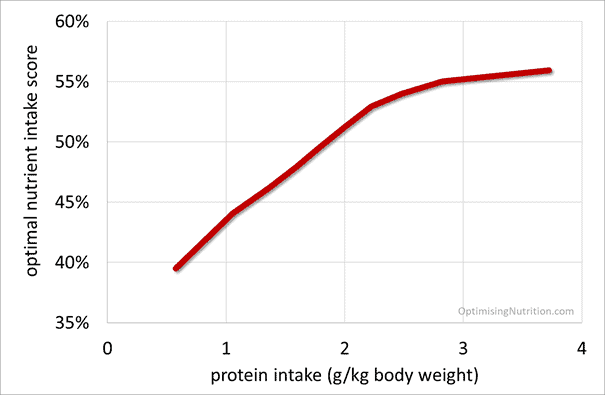
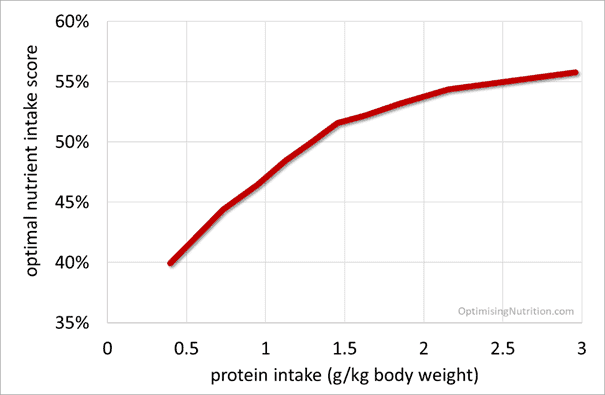
Keep in mind that while a very high protein intake may align with greater nutrient density and satiety, it’s challenging to achieve because it also requires a reduction in dietary fat to avoid energy toxicity. Not many people manage to consume very high protein intakes while also dialling back the dietary fat to allow body fat to be used for fuel.
To leverage the satiety effects of greater nutrient density, all you need to do is move a little bit from where you are now TOWARDS optimal until you get the results you want. Once you reach your goal, you can return to a more sustainable dietary approach.
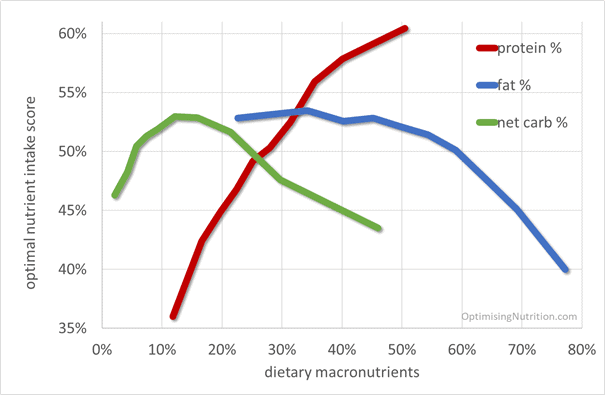
The following chart shows macronutrient intake vs. nutrient density, demonstrating that:
- a higher percentage of protein corresponds with a greater nutrient density,
- consuming more than 50% fat leads to a rapid drop in nutrient density, and
- nutrient density peaks at around 12% non-fibre carbohydrates (note: excluding all carbohydrates will exclude the nutrients in non-starchy vegetables, while a very high-carb diet tends to contain a lot of refined grains and sugars and little protein).
Finally, to understand the implications of a low-protein, high-carbohydrate diet (as recommended by many for longevity), I plotted net carb minus protein versus Optimal Nutrient Intake Score. It appears that consuming more carbs and less protein leads to a less nutritious diet. By contrast, increasing protein and fibre has the greatest potential to increase nutrient density, satiety, and reverse obesity.

If you happen to be part of the minority who are underweight and need to gain weight, it makes sense to consume more carbohydrates and reduce protein. To gain body fat rapidly, you should add refined fat to your carbs. But if you are a member of the overweight majority who needs to lose some body fat, you should prioritise whole food sources of protein and fibre.
How to optimise your diet in an unnatural environment?
Before we over-optimised our food system for energy availability and profit, we carefully selected our food sources to get the protein and other nutrients we needed to thrive.
Our energy intake oscillated with the seasons, with more carbs in summer and more fat in winter. Our natural environment limits the amount of food we can consume. There were periods of food scarcity that caused our weight to fluctuate.
However, in today’s environment of chronic energy abundance, it can be helpful to use some quantitative metrics to drive us back towards more optimal food choices.
When should I reduce carbs?
You don’t have to be a card-carrying keto zealot. But if you have elevated blood sugars, it makes sense to consume fewer dietary carbohydrates because your glucose fuel tank is already full.
While you shouldn’t aim for flatline blood sugars, it makes sense to have healthy glucose levels with a rise of less than 30 mg/dL or 1.6 mmol/L within an hour or two after eating. It’s not that carbs drive insulin and cause you to store fat, but rather that rapidly falling blood sugars signal the body to increase appetite to restore healthy glucose levels. If you are on a continual blood sugar roller coaster with constant dips below your healthy average blood sugar, you will overeat and gain body fat.

When should I increase carbs?
If your blood sugars are stable, you may need more carbohydrates, especially if you are lean and active. Your body CAN make all the glucose it needs from protein (but it doesn’t necessarily want to).
You may need less protein if you typically consume a higher-carb diet because you won’t need to rely on gluconeogenesis to create glucose from protein. But if you’re on a low-carb diet, you typically consume more protein, some of which produces glucose.
Gluconeogenesis is an energy-intensive and rate-limited process. Your body needs carbs to fuel many things, including intense activity. So you don’t need to worry about cutting back carbohydrates further if your blood sugars are already in the normal healthy range.
When to reduce dietary fat
Once you have reduced your glucose to normal healthy levels, your body starts using the fat in your diet or your body. If you are continually onboarding lavish amounts of dietary fat, you are unlikely to burn body fat.
Our satiety analysis demonstrates that eating “fat to satiety” is a bad idea if your goal is fat loss from your body and not your plate.
When you’ve dialled in your blood sugars, dial back dietary fat to torch the fat in your blood and on your body.

When to increase dietary fat
If you’re underweight or doing a lot of endurance activity (which doesn’t require a significant amount of glucose), there may be benefits in increasing dietary fat. However, most people needn’t add copious amounts of refined fat because protein is often fat-inclusive.
Less fat and carbs -> higher protein percentage
Once you reduce carbs to stabilise blood sugars and dietary fat to lose body fat, your diet will reflect a higher percentage of protein. You may eat a little more protein in absolute terms, but not necessarily. You’ll mainly be cutting back on refined energy from fat and carbs.
What to do
To summarise, increasing the protein percentage of your diet too high for too long may lead to being underweight, which has negative consequences on our health and longevity. However, because we have unlimited access to cheap, hyper-palatable, energy-dense foods, reduced longevity due to being underweight is uncommon.
The table below shows how you can dial in your macros based on your context and goals.
| Goal | What to do | How to do it |
| Stabilise blood sugars | Reduce carbs a little | Reduce refined carbs until blood sugars after meals are in the healthy range (i.e. rise after meals < 30 mg/dL or 1.6 mmol/L). |
| Fat loss | Increase protein % a little | Dial back energy from dietary fat and/or carbs. Continue until waist:height ratio < 0.5 and waking glucose < 100 mg/dL or 5.6 mmol/L). |
| Maintain weight | Focus on nutrients | Add more nutrient-dense foods and meals. |
| Gain weight or support activity | Decrease protein % a little | Increase energy from fat and/or carbs. |
Protein and nutrient leverage – tailored for your goal
Solving the nutrition puzzle using Nutrient Optimiser takes tracking and self-reflection. People who do this in our Nutritional Optimisation Masterclass tend to see excellent results. But not everyone wants to go to that effort.
To get you started, we created a range of nutrient-focused NutriBoosters Recipe Books tailored for different goals.

The table below lists our most popular recipe books tailored for a range of goals, from aggressive fat loss to bulking, diabetes management, and everything in between.
- The ‘metrics’ column show the blood sugar and waist: height ratio (W: H) that aligns with each goal.
- People who are overfat (with a waist: height ratio of greater than 0.5) require NutriBoosters with greater satiety and a higher protein percentage to empower them to eat less without excessive hunger.
- People whose blood glucose rises more than 30 mg/dL or 1.6 mmol/L require meals with a lower insulin load to help them stabilise their blood sugars. Avoiding blood sugar crashes helps normalise appetite and hunger.
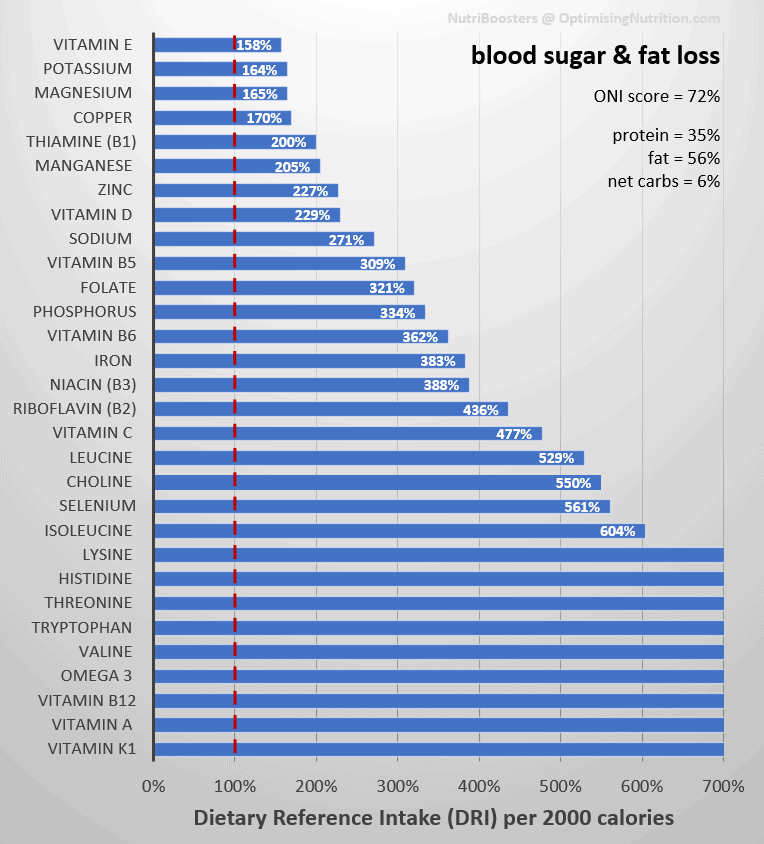
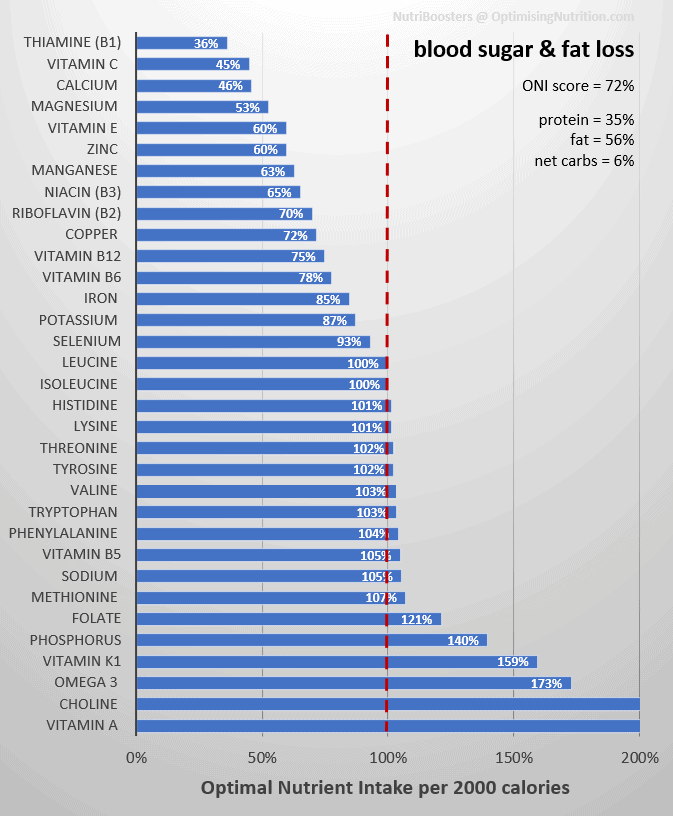
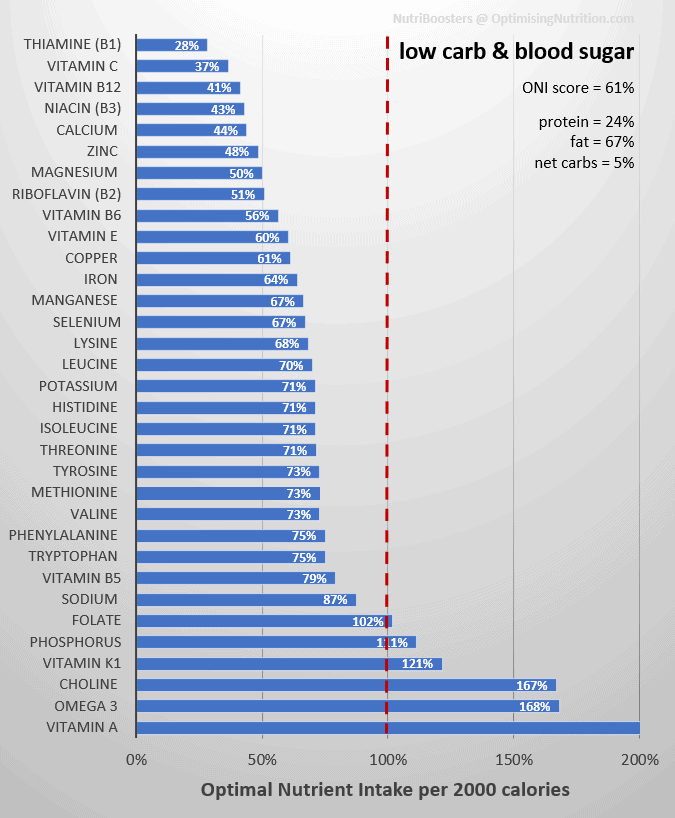
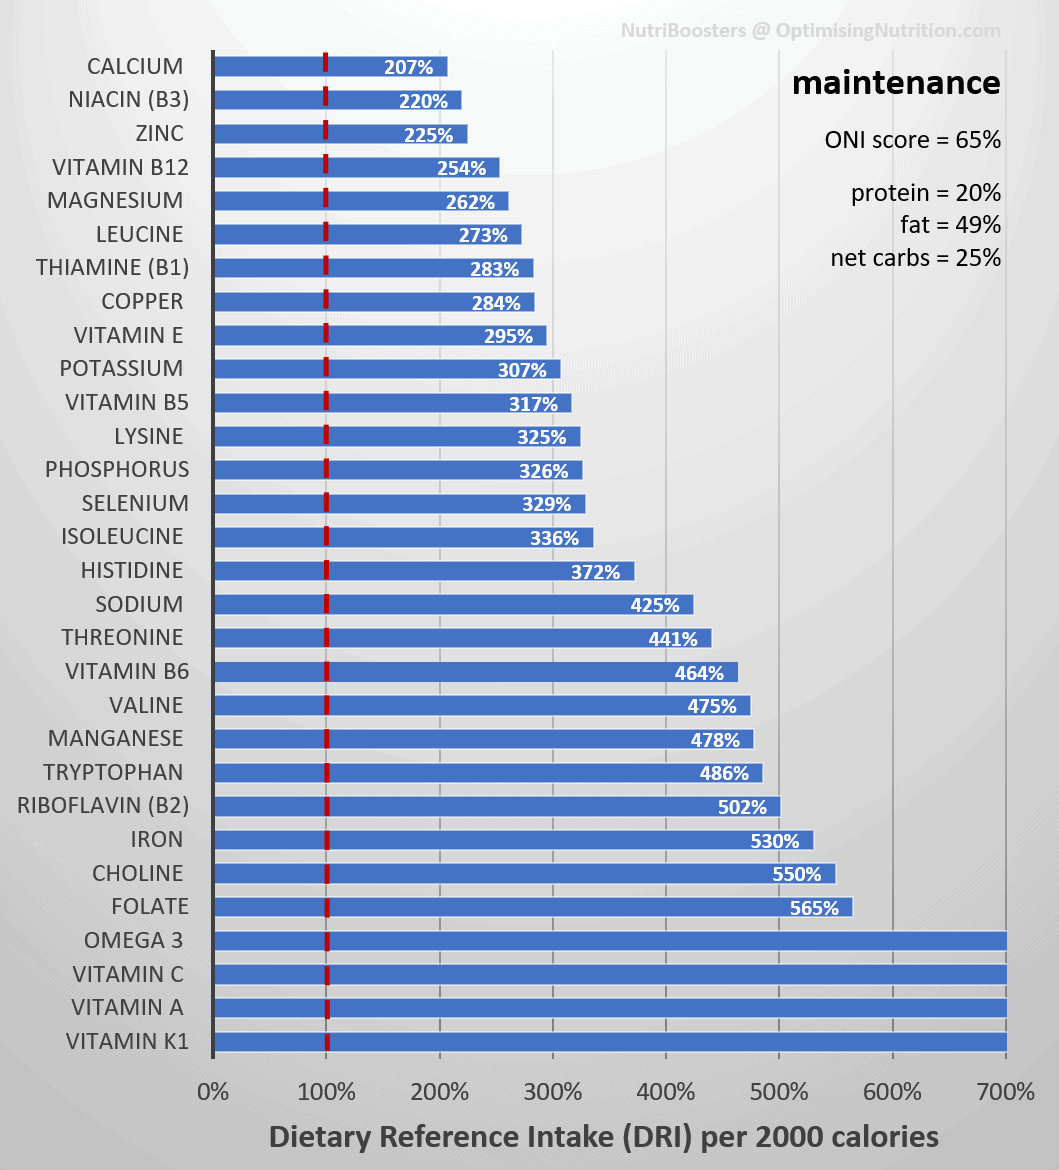
- Click on the ‘DRI’ and ‘ONI’ in the right-hand column to see the nutrient fingerprint of that recipe book (i.e., micronutrients and macronutrients).
- Click on the book’s name in the left-hand column to access more details for that specific book.
| Name | Goal | Metrics | DRI | ONI |
| Fat loss | Fat loss with greater satiety and less hunger and cravings due to nutrient deficiencies and adequate protein to prevent muscle loss. | W: H > 0.5 | DRI | ONI |
| Maximum nutrient density | Maximum nutrients per calorie. | NA | DRI | ONI |
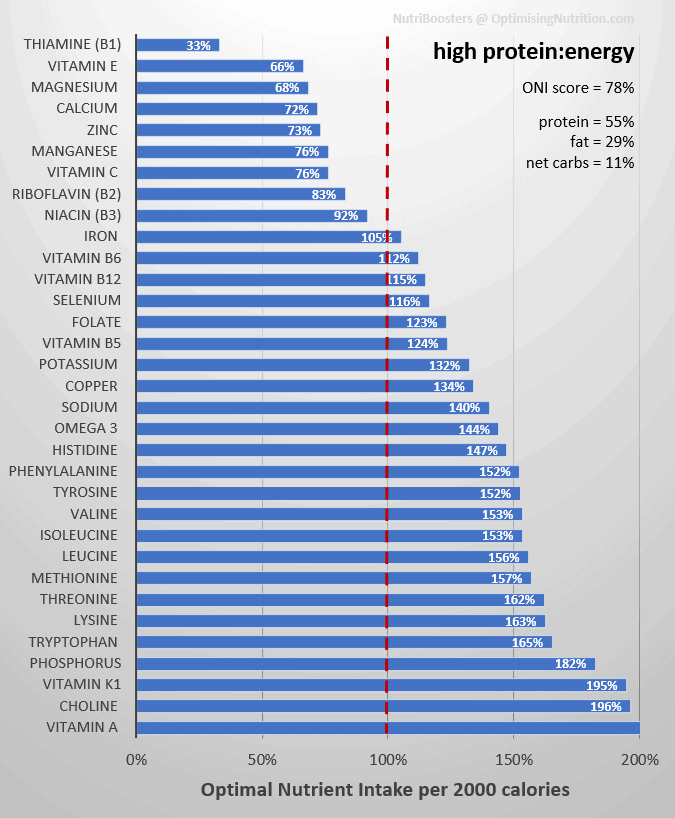
| High protein: energy | High protein: energy ratio for aggressive fat loss (i.e., PSMF or high P: E). | W: H > 0.5 | DRI | ONI |
| Blood sugar & fat loss | Designed for anyone with elevated blood sugars and body fat to lose. | W: H > 0.5 BG rise after meals > 30 mg/dL or 1.6 mmol/L | DRI | ONI |
| Low carb & blood sugar | Designed for stable blood sugars and weight maintenance on a nutritious low-carb diet. Ideal for someone with diabetes or anyone who enjoys a low-carb way of eating. | W: H < 0.5 BG rise after meals > 30 mg/dL or 1.6 mmol/L | DRI | ONI |
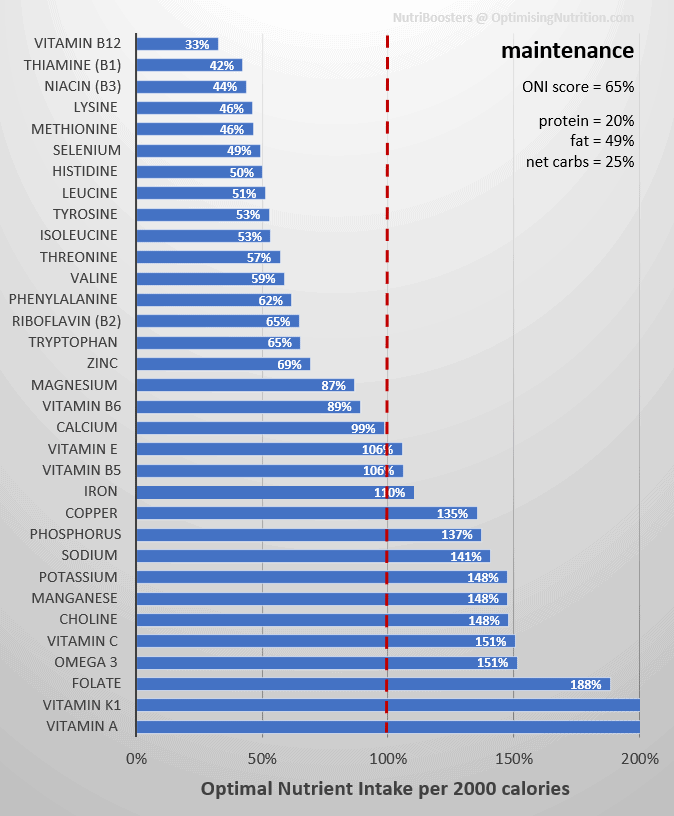
| Maintenance | Designed to help you maintain your body weight providing plenty of nutrients to live a healthy and energised life. | W: H < 0.5 | DRI | ONI |
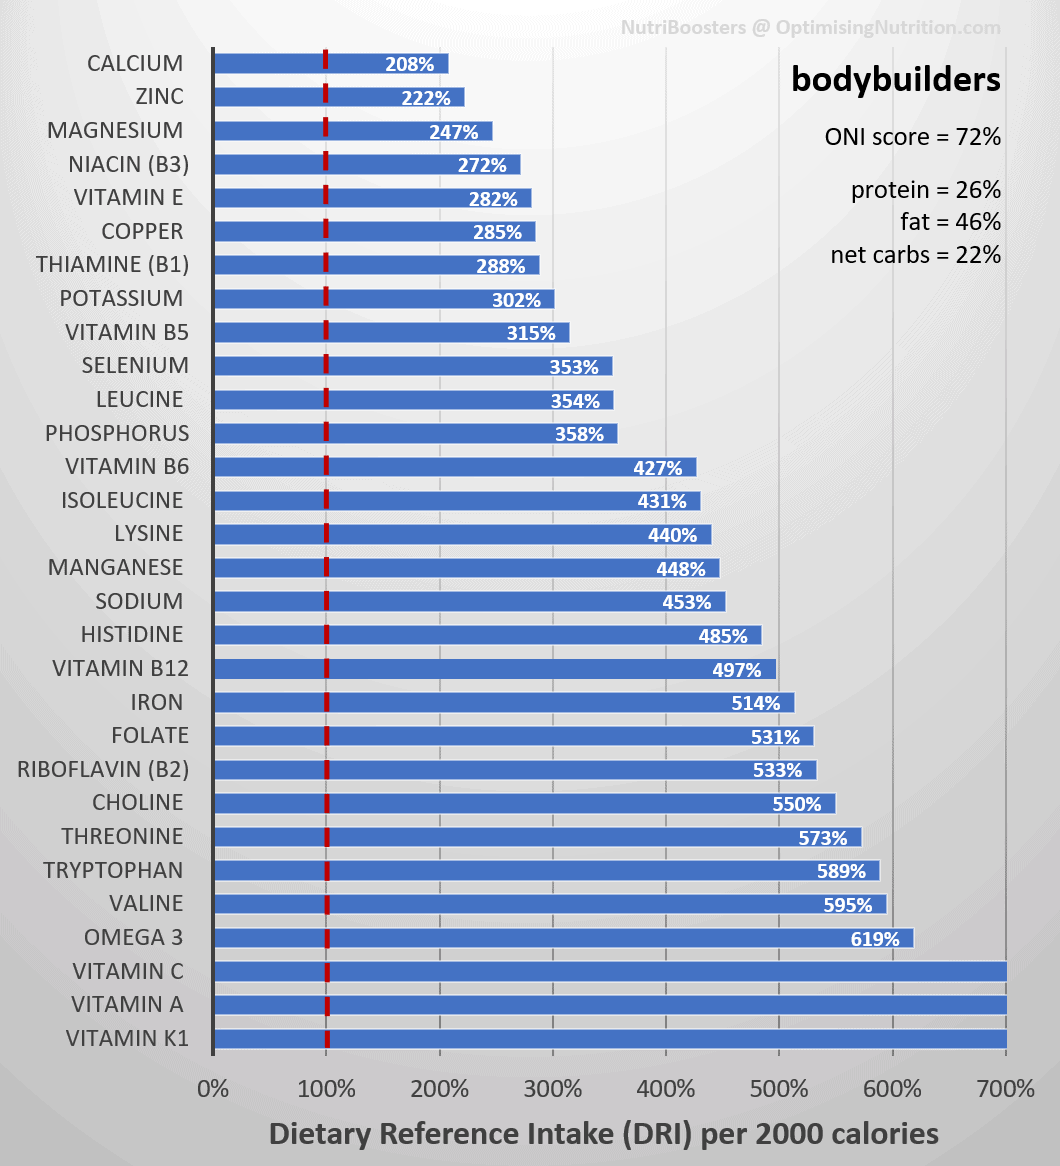
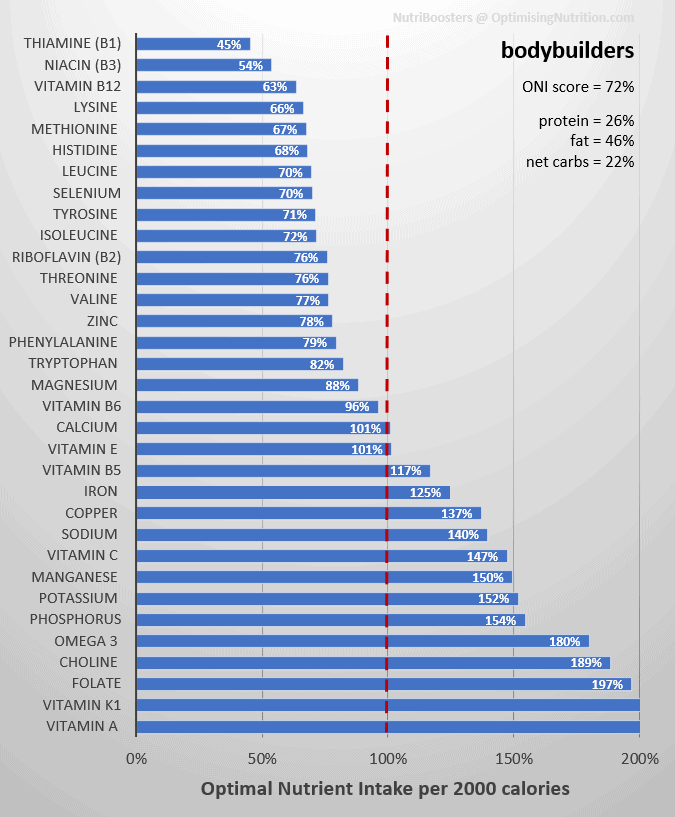
| Bodybuilders | Gain muscle without excess body fat. | W: H < 0.5 | DRI | ONI |
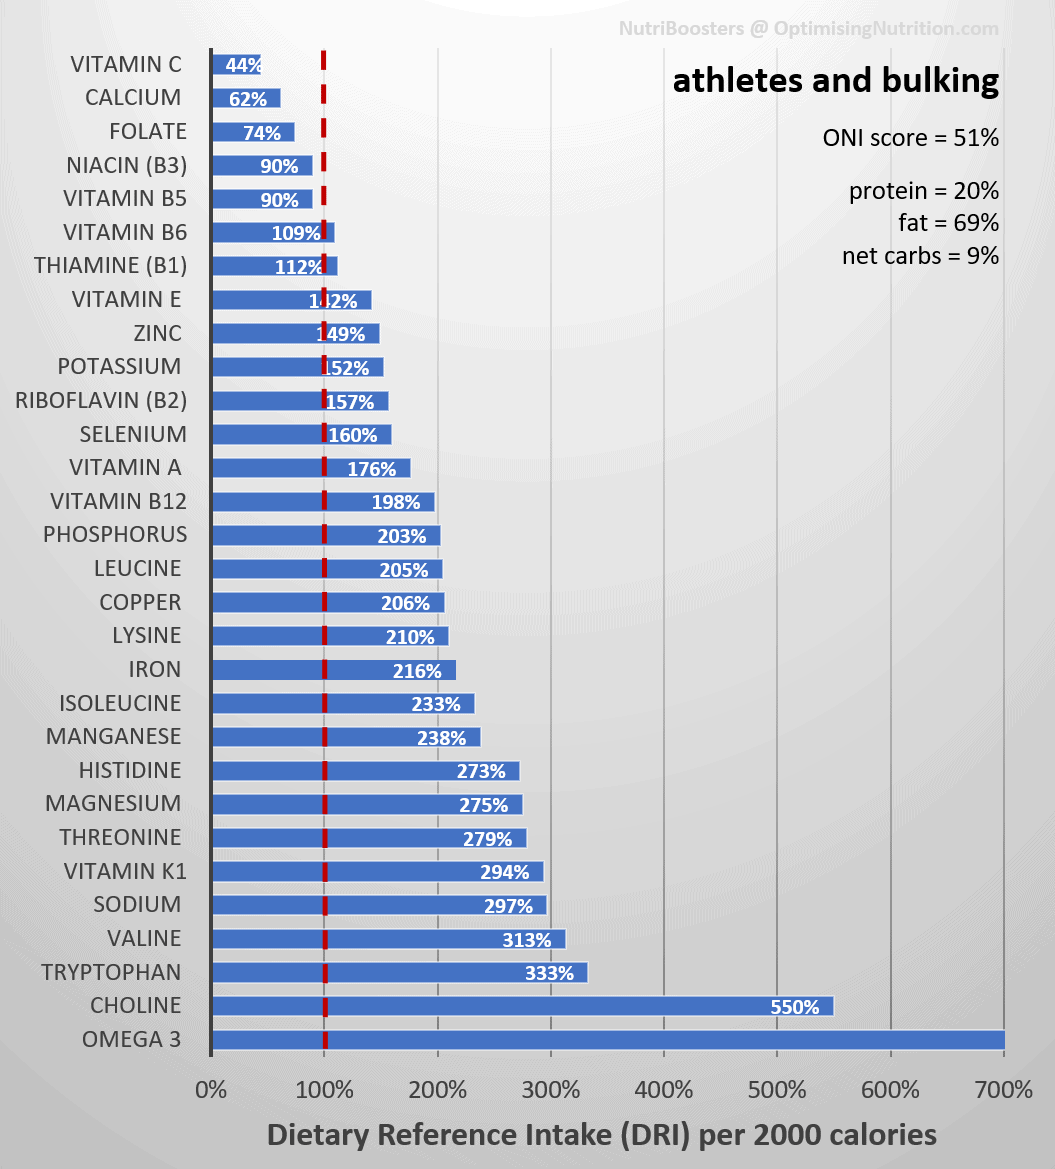
| Athletes & bulking | Designed to support activity or growth with an eye on nutrient density. | W: H < 0.5 | DRI | ONI |
Summary
- Raubenheimer and Simpson’s extensive work has demonstrated that a diet with a higher percentage of protein and fibre (i.e., less fat and/or carbs) aligns with greater nutrient density.
- Because we get the nutrients we need from fewer calories, our cravings are satisfied, and we eat less.
- Due to the increased satiety, a nutrient-dense diet with more protein and fibre and less fat and non-fibre carbohydrate will likely lead to weight loss.
- While being overweight is associated with many of our most diseases, being underweight (e.g., a BMI of less than 20) can also reduce short-term and long-term health.
- To gain weight, you should increase your intake of energy from carbs and fat (thus reducing the percentage of protein in your diet).
- However, if you’re part of the growing majority of people who are overweight, reducing fat and/or non-fibre carbs will tend to lead to greater satiety and fat loss.
- Once you reach a healthy weight, you should re-introduce more energy from carbs, fats, or both to prevent excessive weight loss.
How Can I Calculate My Nutrient Intake?
If you’re interested in checking if you have enough of all the micronutrients, you can check your nutrient profile using our Free 7-Day Nutrient Clarity Challenge.
After a week of tracking your current diet in Cronometer, Nutrient Optimiser will give you a prioritised list of foods and NutriBooster recipes that will help you plug your current nutritional gaps.
Level Up Your Nutrient Density
To help you level up your nutrient density, we’ve prepared a Nutritional Optimisation Starter Pack to ensure you are getting plenty of all the essential nutrients from the food you eat every day.
The free starter pack includes:
- Maximum Nutrient Density Food List
- Sample Maximum Nutrient Density Recipe Book
- Sample Maximum Nutrient Density Meal Plan.
To get started today, all you have to do is join our new Optimising Nutrition Group here.
Once you join, you will find the Nutritional Optimisation starter pack in the discovery section here.
Back to the longevity thing for a moment…after doing some of my own study into it I ran into the “lower protein means lower methionine” thing, over and over. To me, a 58-year old, this runs right in the face of sarcopenia/catabolism, whatever you want to call it, and consuming incomplete proteins for months on end JUST TO ACHIEVE SOME SORT OF “LONGEVITY” or healthspan. So how ARE we supposed to get adequate methionine? And the recommended use of collagen–how do we make up for the absence of tryptophan? Yes, collagen powders are not complete proteins–they lack tryptophan. Then we can’t sleep–how is this good?
And people complain that the keto diet avoids entire food groups!
Yes, there IS a lot of overlap within the keto/Mediterranean/longevity diets, but then there’s a lot to question about the things that remain around the edges of the Venn diagram. On one hand, the keto diet is recommended to reduce fat and weight, but then the consumption of fruits and beans is also recommended–there goes your fat loss! So if you combine the fruits, beans, and low protein, what are you left with? Not much to fuel the metabolic processes that clear our bodies of toxins/AGEs/other garbage (cellular and not-so-cellular).
After my dive into the longevity side of things, I’m left with these impressions:
1. Longevity “scientists” are not aware of nutrient density (hence the beans and fruit)
2. These same people are also not aware of using glycine to offset methionine intake
3. The whole longevity thing is seeming more and more like a scam (article: you can’t cheat death–https://www.eurekalert.org/pub_releases/2021-06/uosd-wcc061521.php)
All in all, I think I’ll do best to stick with you and the keto diet.
Back to the tryptophan thing–I just found this article today: Insufficient tryptophan levels alter gut microbiome and increase inflammation
https://www.eurekalert.org/pub_releases/2021-06/mcog-wai062321.php
So where does this fit into the whole longevity thing, I wonder…my personal scam alert alarm is going off again.
…and the scam alert is going off AGAIN!
Today’s deep dive into the whole methionine-glycine thing yields me this: the very foods that are recommended we avoid or reduce to restrict methionine intake are the very foods rated highest in glycine (with the exception of gelatin/collagen powders).
I think I’ll just go ahead and say what needs to be said out loud: THERE IS NO MIRACLE LONGEVITY POTION/SUPPLEMENT/TREATMENT AVAILABLE TO THE COMMON MAN! The only miracle to be found is right here scattered among all of Marty’s posts–past and present. Those who have money to throw away chasing a dream really only have unproven hi-tech treatments/procedures which will remain unproven in humans because there isn’t enough money IN THE WORLD to begin affording the research on this stuff.
The sheer size and scope of this scam rivals Scientology.
“I’ve lined up a chat with David and Stephen (along with Dr Ted Naiman) to explore this topic further.”
When is this happening? I’d really love to see this. I don’t see a conflict though, as a very high protein diet only need be used temporarily for fat loss. After, one could transition to a ~15% protein, whole food diet like our ancestors ate and should not in theory regain the fat. If one does regain a bit, then jump on another few weeks of high protein.
My question is, why does someone like Ted Naiman, who is already shredded, need to stay at a very high protein intake in order not to regain?
the chat with R&S was going to be this Wednesday, but it’ll be delayed due to lockdown in Sydney and a coffee accident with David’s computer. 🙁 hoping to re-schedule for next month.
I’m not sure what exact protein % Ted sits on, but once you reach your goals you will need to bring back some energy from carbs and fat, especially if you’re active. but if he went to eat eating doughnuts and pasta he’d quickly regain fat. you only need to modify your protein % enough to see the change you want to see.
Just finished a podcast with Stuart Phillips on muscle and protein. Many similarities and and some differences in the discussions about protein. At the moment I am a bit annoyed at the jumps to conclusions from any of these studies. Linking protein to longetivity is useless without knowing how the protein is disposed. Exercise and sleep are critical mediating factors…and of course age. Many giant conclusions coming from razor thin correlations. That said, the numbers in the tables above that come from good data sources are extremely interesting. The synthesis between the food intake comparisons above and Dr Phillips analysis are starting to open up our understanding about how we actually process protein. The interactions between amino acids and sulfates needs to be brought into the analysis. There is currently too much focus on the muscle’s use of protein.
A bone to pick on the Blood Glucose (BG) graph. I am not seeing that curve dip effect on my BG traces. I have spikes – sometime deliberate when I am testing foods – but my high rate-of-change curves are almost entirely induced by refined sugars. Such foods definitely kick off a craving response (for me it is a mild craving). However, I think you may be using the wrong input criteria for the craving. I don’t think it is absolute BG levels, I see it much more related to rate-of-change; high positive slopes and high negative slopes. Both of those seem to correlate with a desire to reach for more. My basal BG levels tend to bracket within times of day [early day, late day, late evening, and nightime]. Those averages and variances are only partially correlated to feeding. A BG of 50 at night does not give me a hunger signal. Yeah, I am a data geek so I got my spreadsheets.
Fantastic article Marty – I purchased your ‘Big Fat Keto Lies’ e-book a while back, and it is now required reading for all my clients (along with ‘The P:E Diet’)! The protein/ nutrient leverage hypothesis works a treat for my clients – although the biggest hurdle for me is often the mind-shift change required from the client’s perspective (I focus on 40-60 year olds and they often have great difficulty believing that they primarily need to look at ways to prioritise lean protein – until the results start to come in of course…)
For me, the theme of this article is the real frontline in the ‘diet wars’. If we are ever going to reach consensus, either Simpson & Raubenheimer or Ted are going to have to adapt their views – they can’t all be right. I read ‘Eat Like the Animals’ and on the one hand, I agree that the ‘excessive protein causes increased aging via raised M-TOR/ IGF-1’ is a very plausible theory, as also promoted via the work of Dr Valter Longo and supported by Dr Ron Rosedale. However, I don’t believe there is any evidence for this in humans, and as pointed out in your article (as well as a recent podcast I heard with Dr Stuart Philips) ‘wild’ humans are so different to lab-rats that even theoretically there is not much reason to believe the same effects would transfer to humans.
What I would love to see from Raubenheimer & Simpson in their upcoming debate with Ted, is a little more than just ‘excessive protein has been shown to age rats so therefore logically it must be the same in humans’. I want to see more evidence – at least in the absence of real-life human data – can they provide mechanistic processes for how this would occur in humans? Similarly for Ted, providing examples of how the mechanistic process might NOT transfer to humans. Otherwise, I feel that it will not be much of a debate, with both sides just stating their personal interpretations of animal data… Fingers crossed something worthwhile comes out of it!!
Protein Vs Lifespan Graph
When I eyeball the graph Marti provided, I conclude that protein intake does not affect lifespan. If you ignore the very early death of some low protein mice, I would bet the best fit would be an almost horizontal line with a much higher R^2.
I wander why the book’s geometrical color graphs look so much more convincing?