
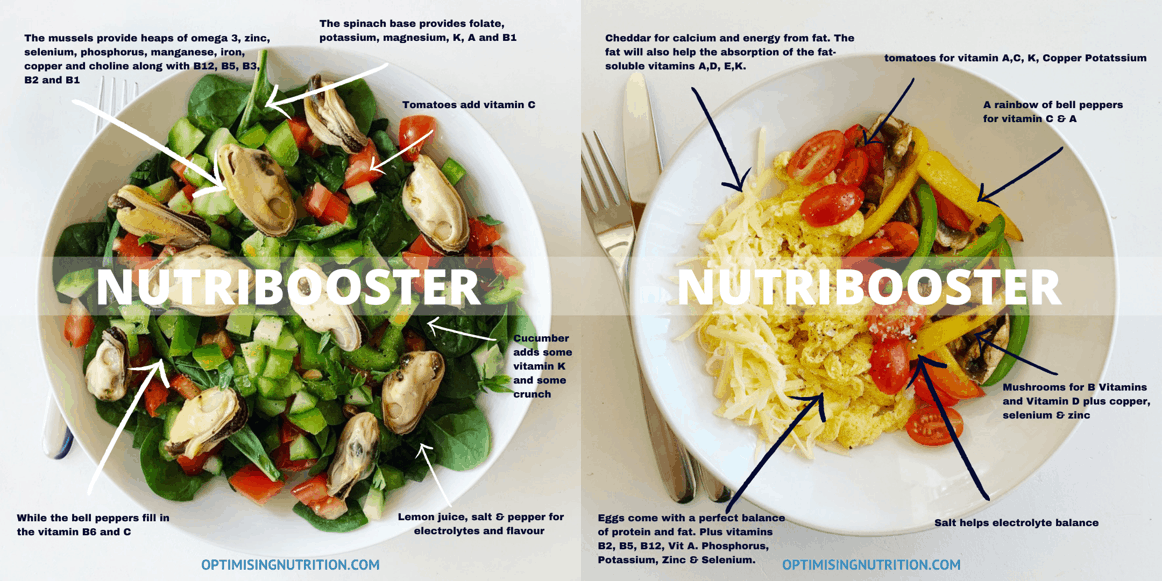
Team NutriBoosters has been hard at work cooking up a new batch of nutrient-dense recipes and tweaking your favourite golden oldies. From our recipe developer to volunteer prep-testers, tasters, food stylists, and photographers—our goal was to help you meet your goals, whatever they might be.
Nutrient Optimiser now offers 467 deftly curated, deliciously optimised recipes and 26 full-colour cookbooks. This article lends a deeper understanding of what to look for when choosing recipes to match your goals and identifies optimal suggestions for YOU.
With so many contexts, options, and goals represented, I decided to help you make sense of things by providing a few illustrative charts (as I sometimes like to do).
- The Optimal Nutrient Intake Score
- Protein vs Nutrient Density
- Fat vs Optimal Nutrient Intake Score
- Net Carbs vs. Optimal Nutrient Intake Scores
- Energy Density
- Carb + Fat
- The essential collection
- The other NutriBooster books
- NutriBoosters Recipe Group
- Macronutrient Comparison
- Protein vs. ONI Score
- Fat vs. ONI Score
- Carbohydrates vs. ONI Score
- How Can I Calculate My Nutrient Intake?
- Level Up Your Nutrient Density
- More
The Optimal Nutrient Intake Score
The vertical axis on the charts in the following section represents the Optimal Nutrient Intake Score (ONI). The higher the ONI score, the more nutrient-dense or nutritious your recipe choice, allowing you to thrive by eating more nutrients and fewer calories. We have also developed ONI stretch targets for each of the thirty-four essential micronutrients (i.e., vitamins, minerals, essential fatty acids, and amino acids) that align with greater satiety and optimal health.
Stretch target ONIs are typically well above the ‘official’ Recommended Dietary Allowances (i.e., RDAs, the minimum nutrient intake to prevent deficiency diseases over the short term). Rather than trying to eke by on RDAs, consider ONIs as a full coverage nutritional insurance policy that supplements your health no matter what situational crisis life tosses your way, be it good, bad, or indifferent.
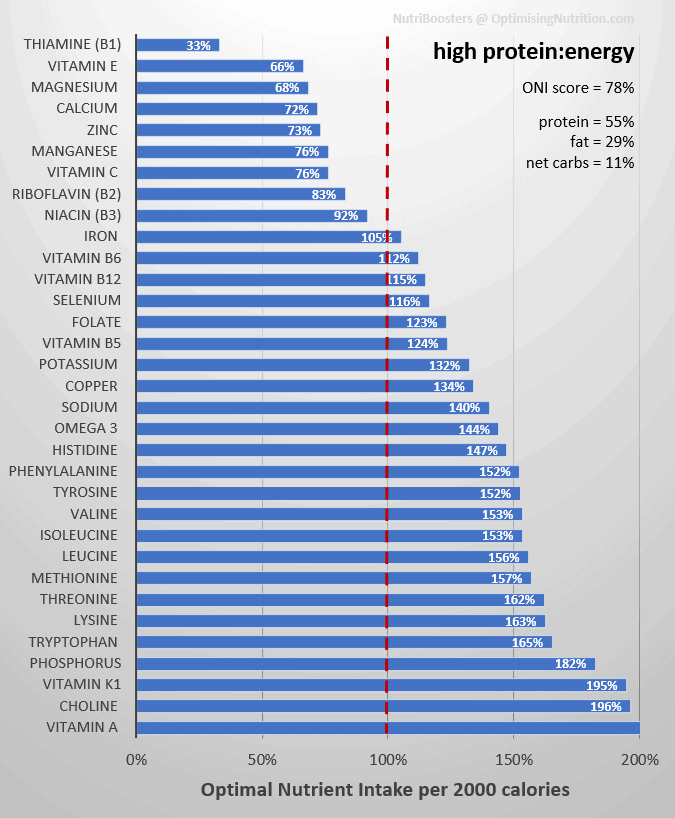
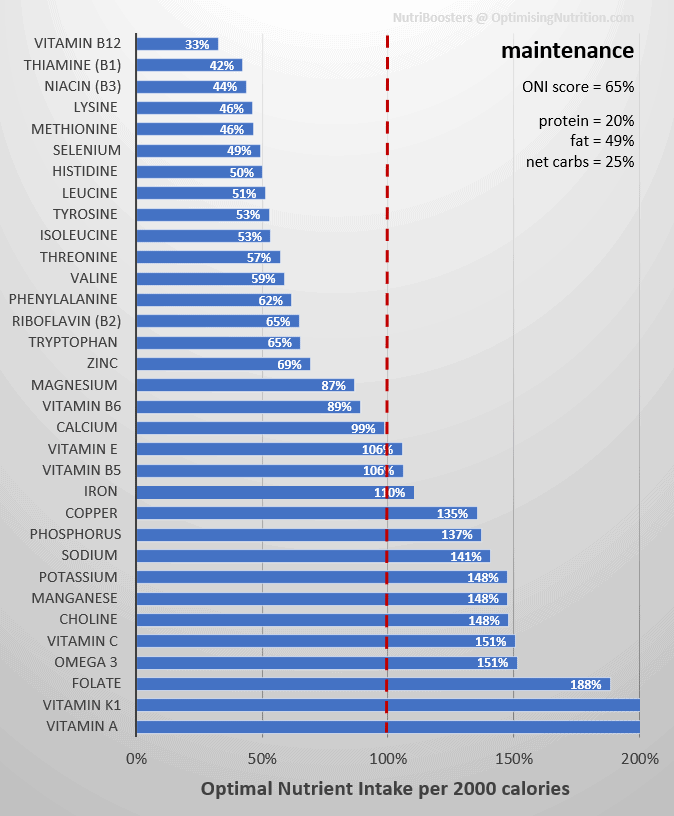
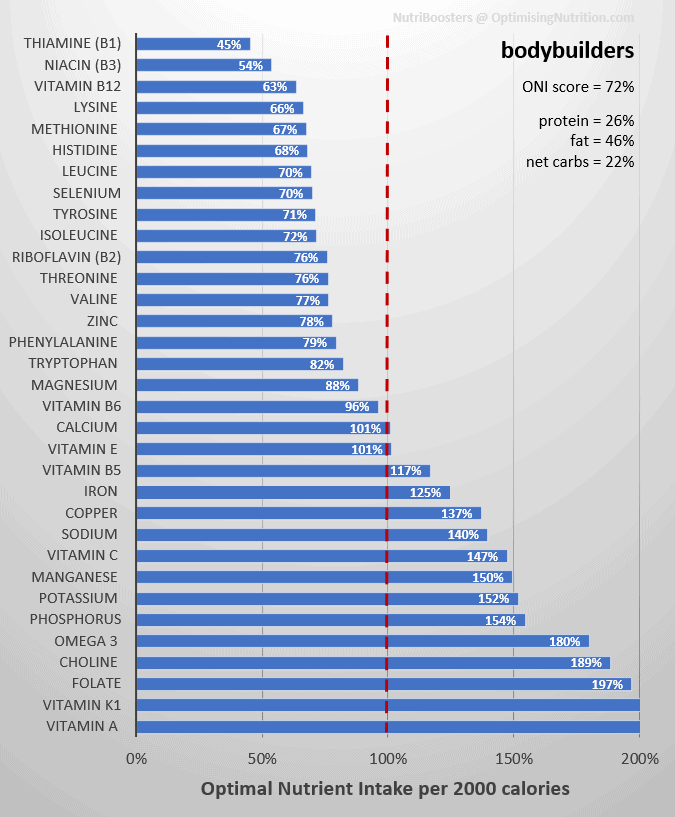
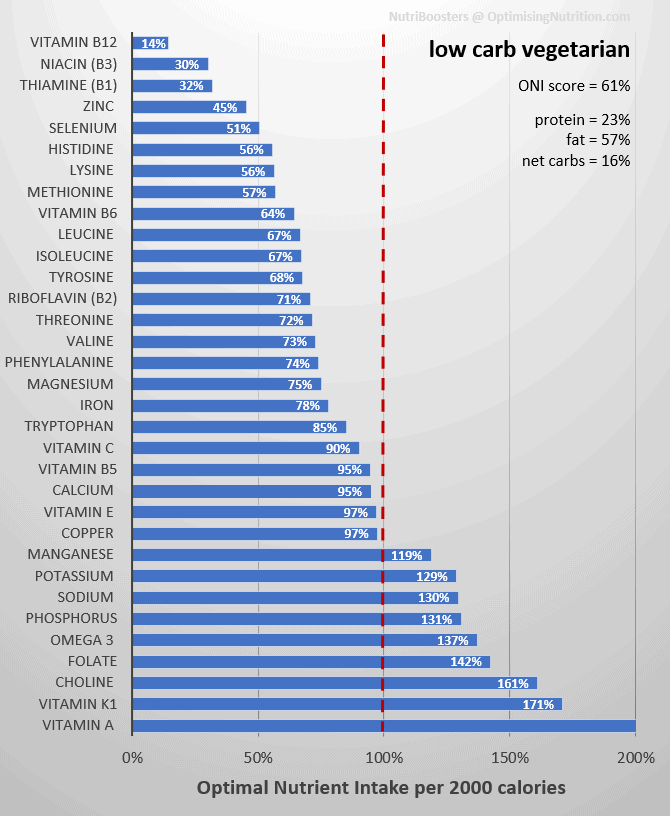
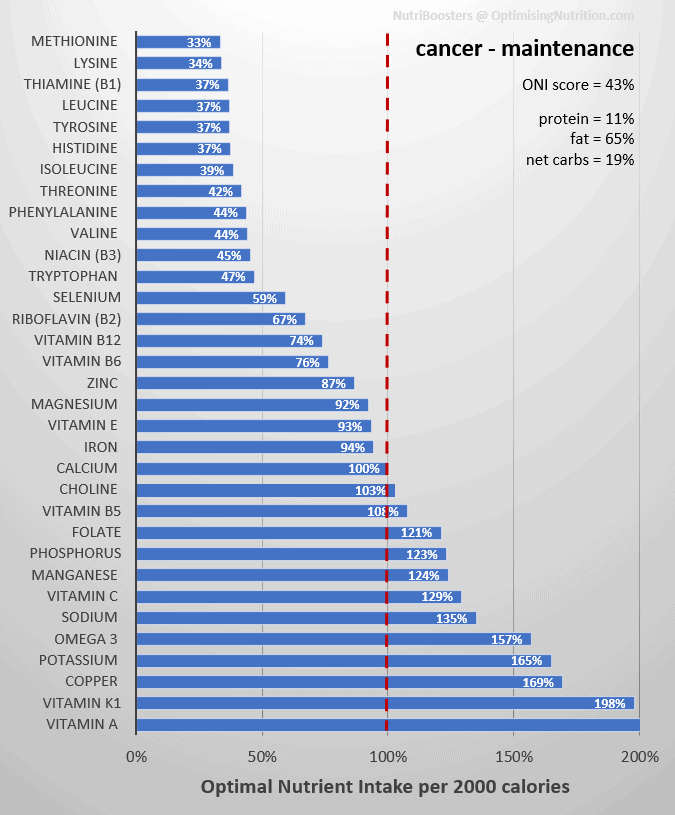
The following chart shows the micronutrient fingerprint of the recipes in our Maximum Nutrient Density recipe book. The filled-in area left of the vertical intake line indicates a very respectable Optimal Nutrient Intake Score (ONIS) of 83% out of 100%.
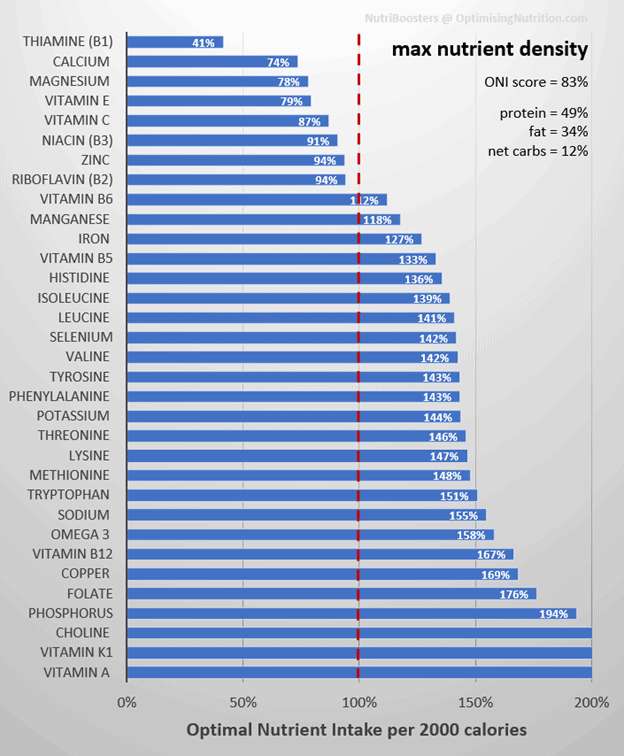
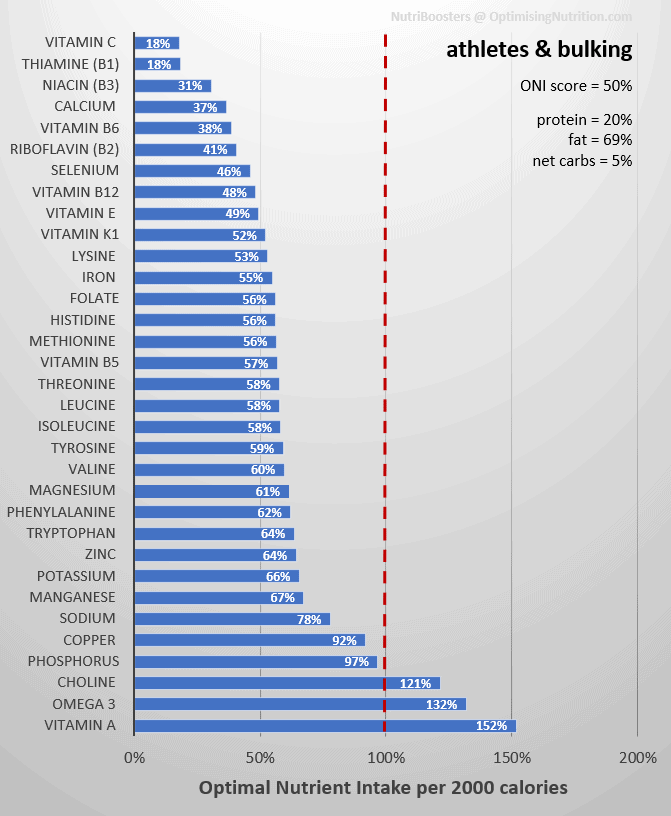
You can’t score bonus points for nutrients above 100% towards the bottom of the chart (e.g., vitamin A, K1, and choline). The only way to better your Optimal Nutrient Intake Score is to get more nutrients like thiamine, vitamin C, zinc, or magnesium (towards the top of the chart) from the food you eat without consuming more calories.
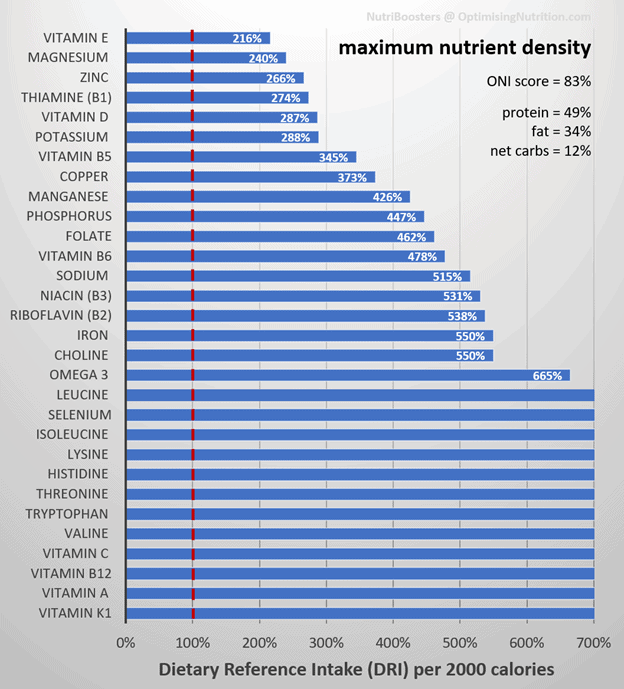
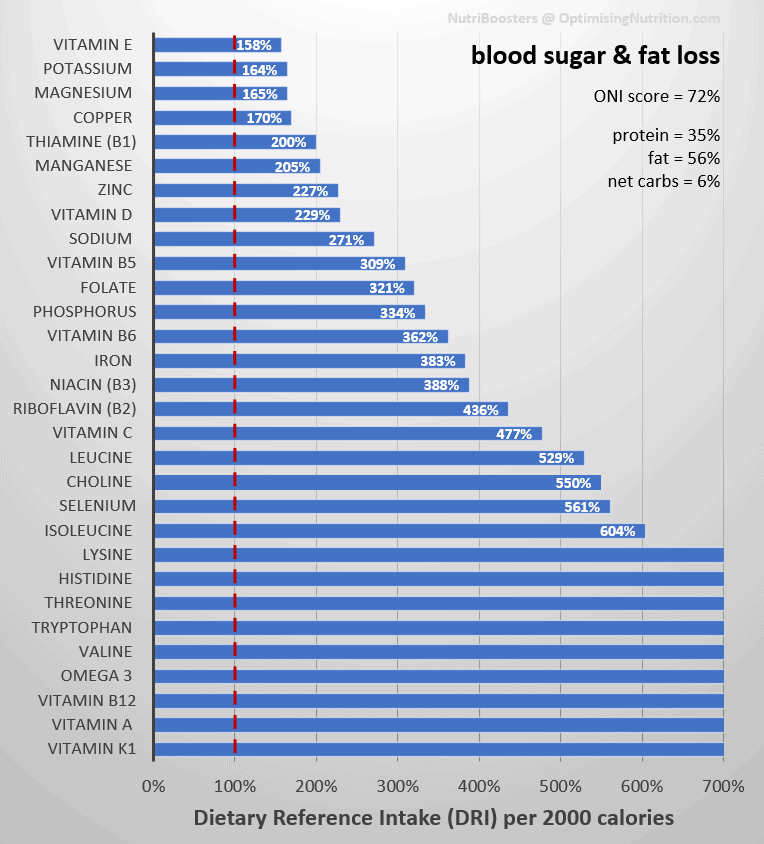
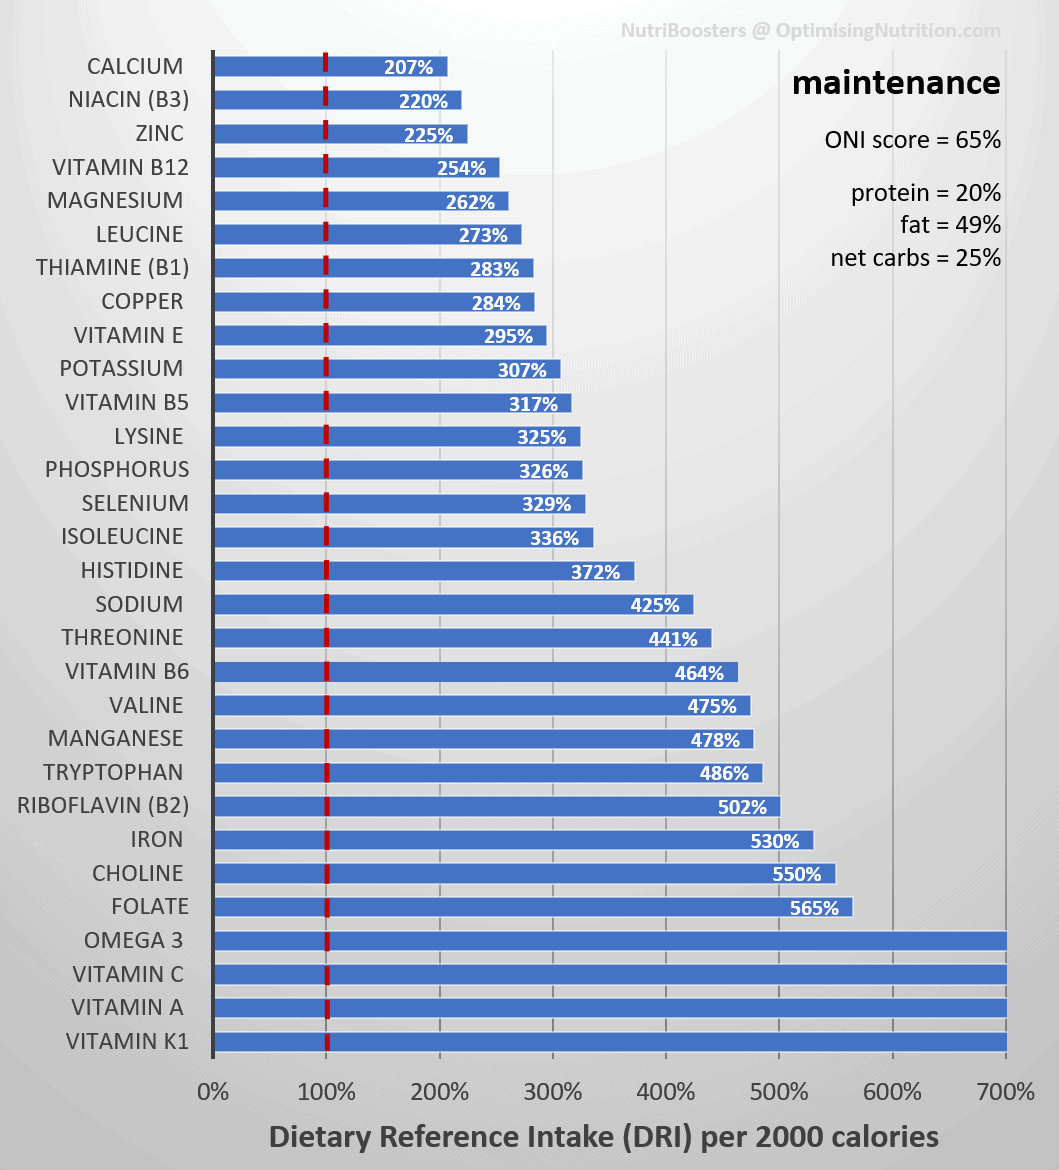
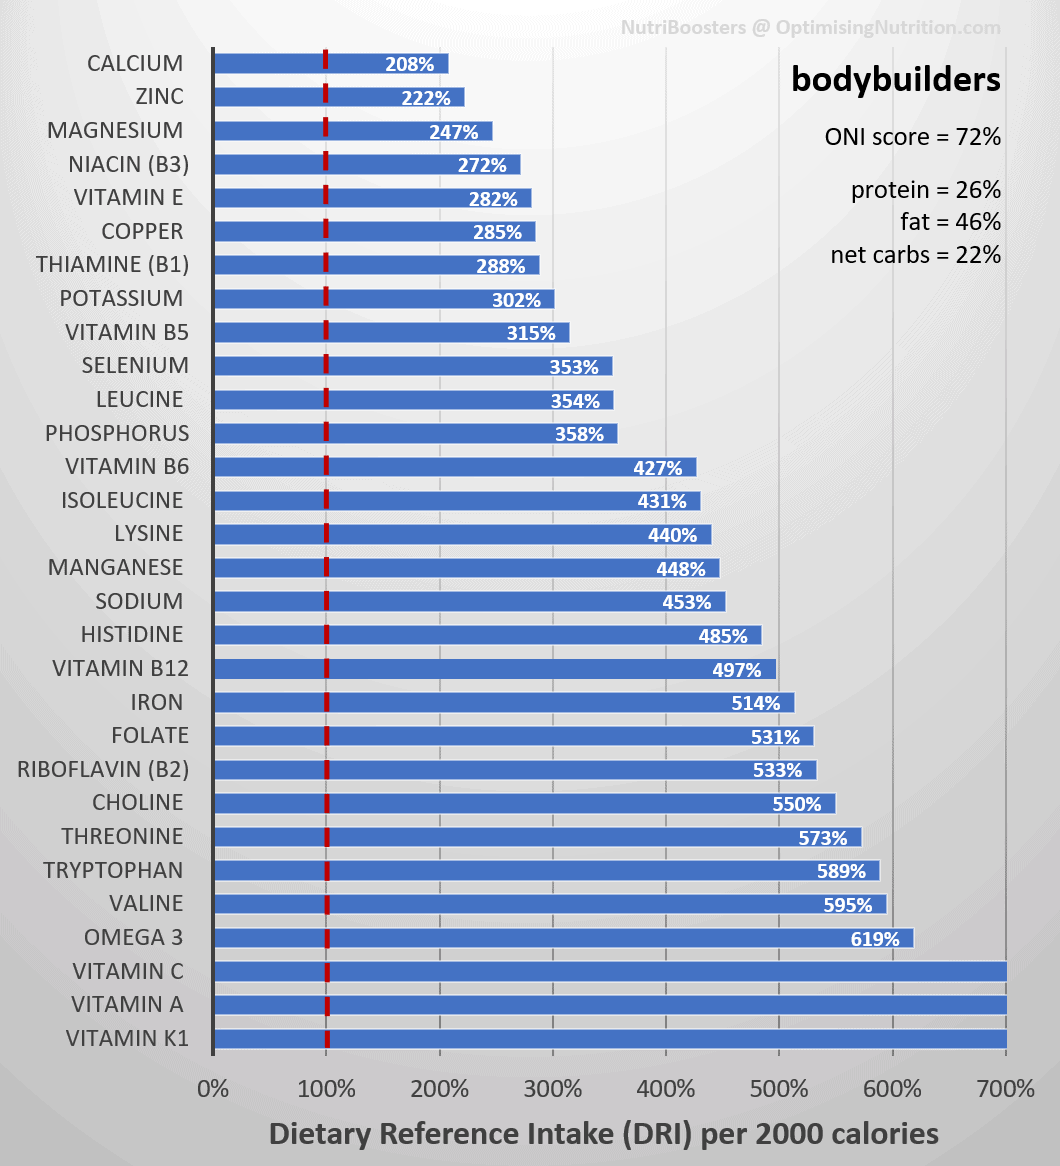
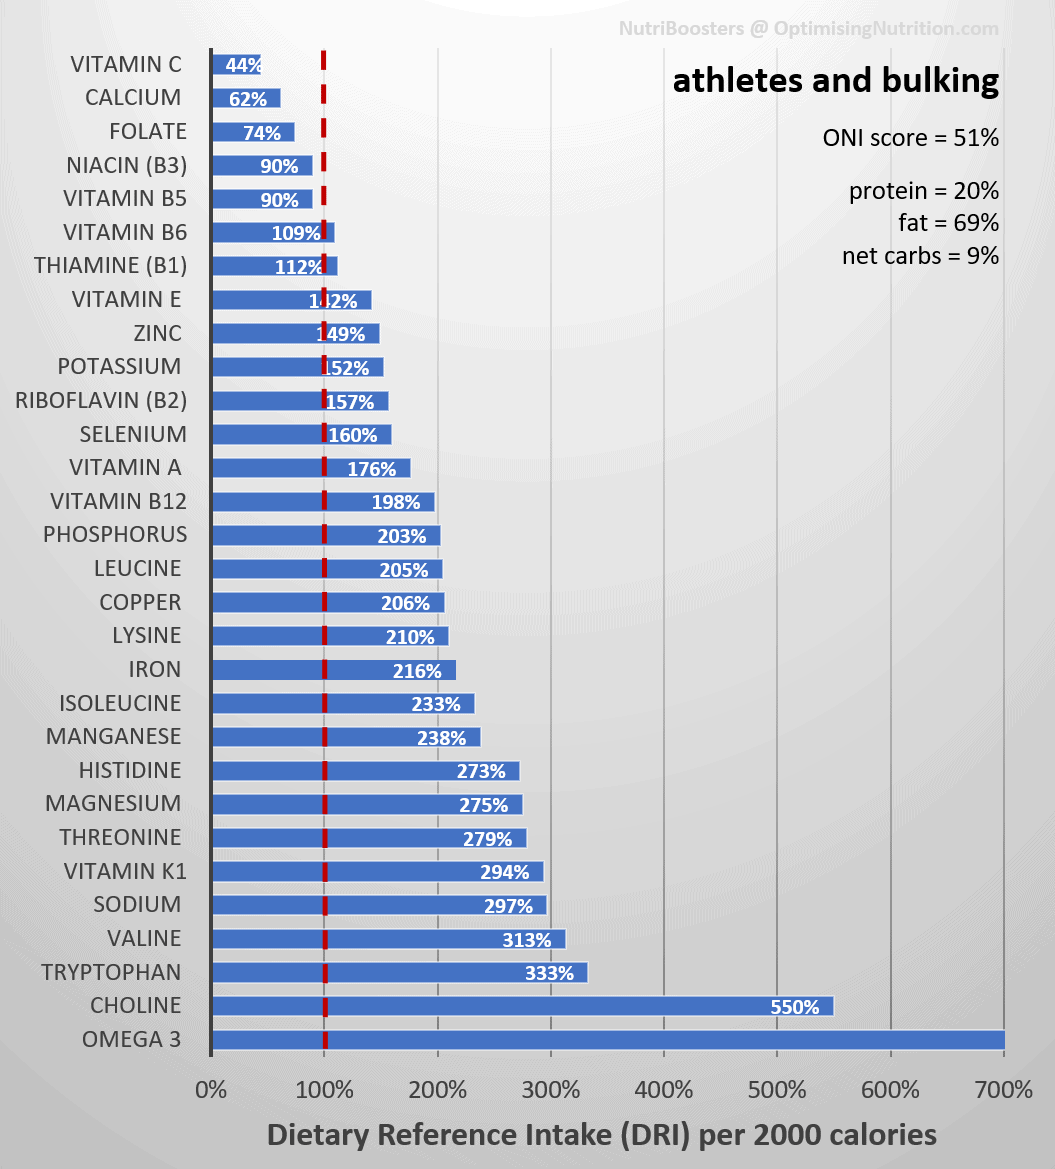
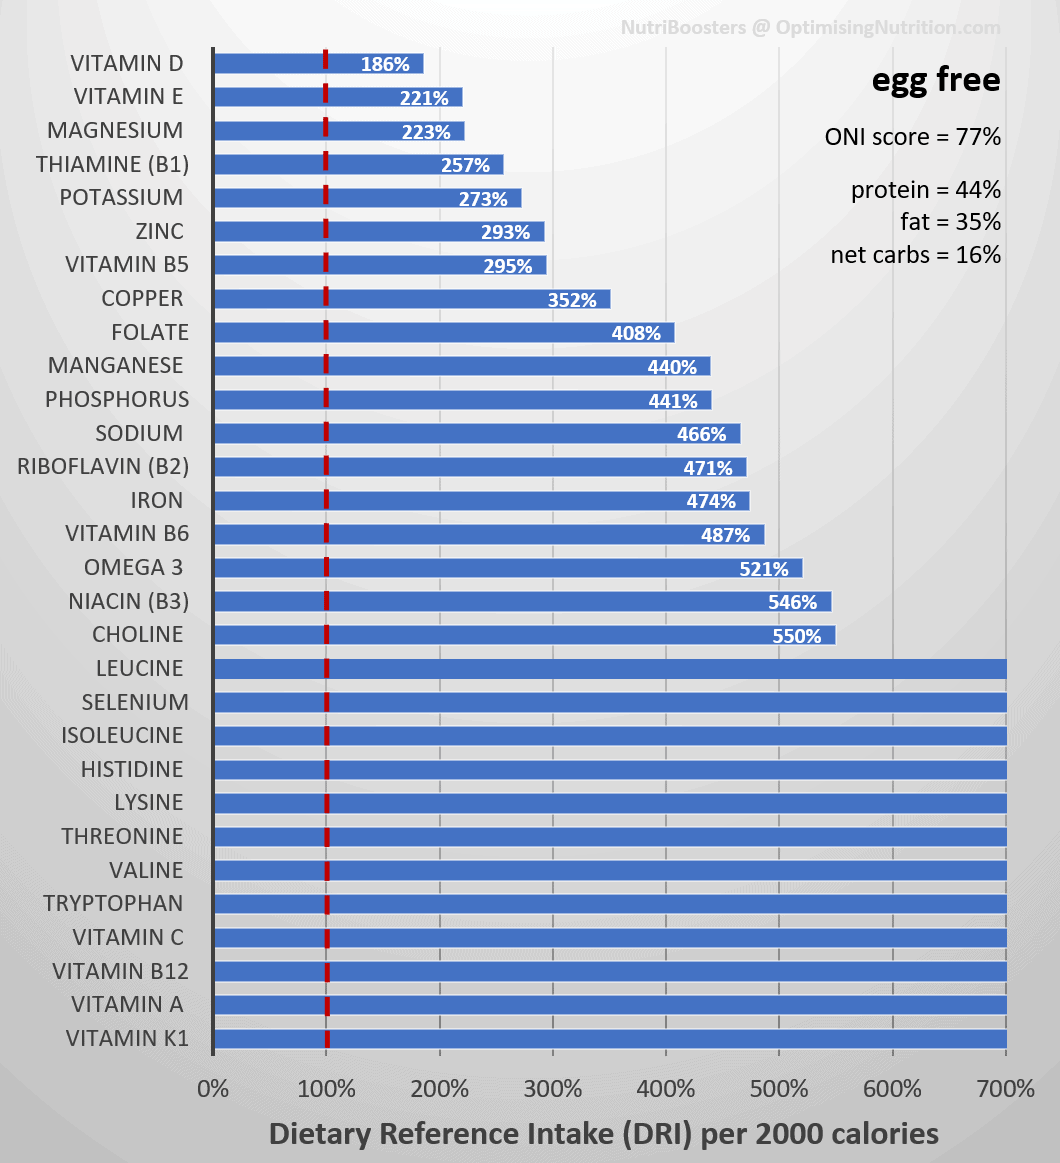
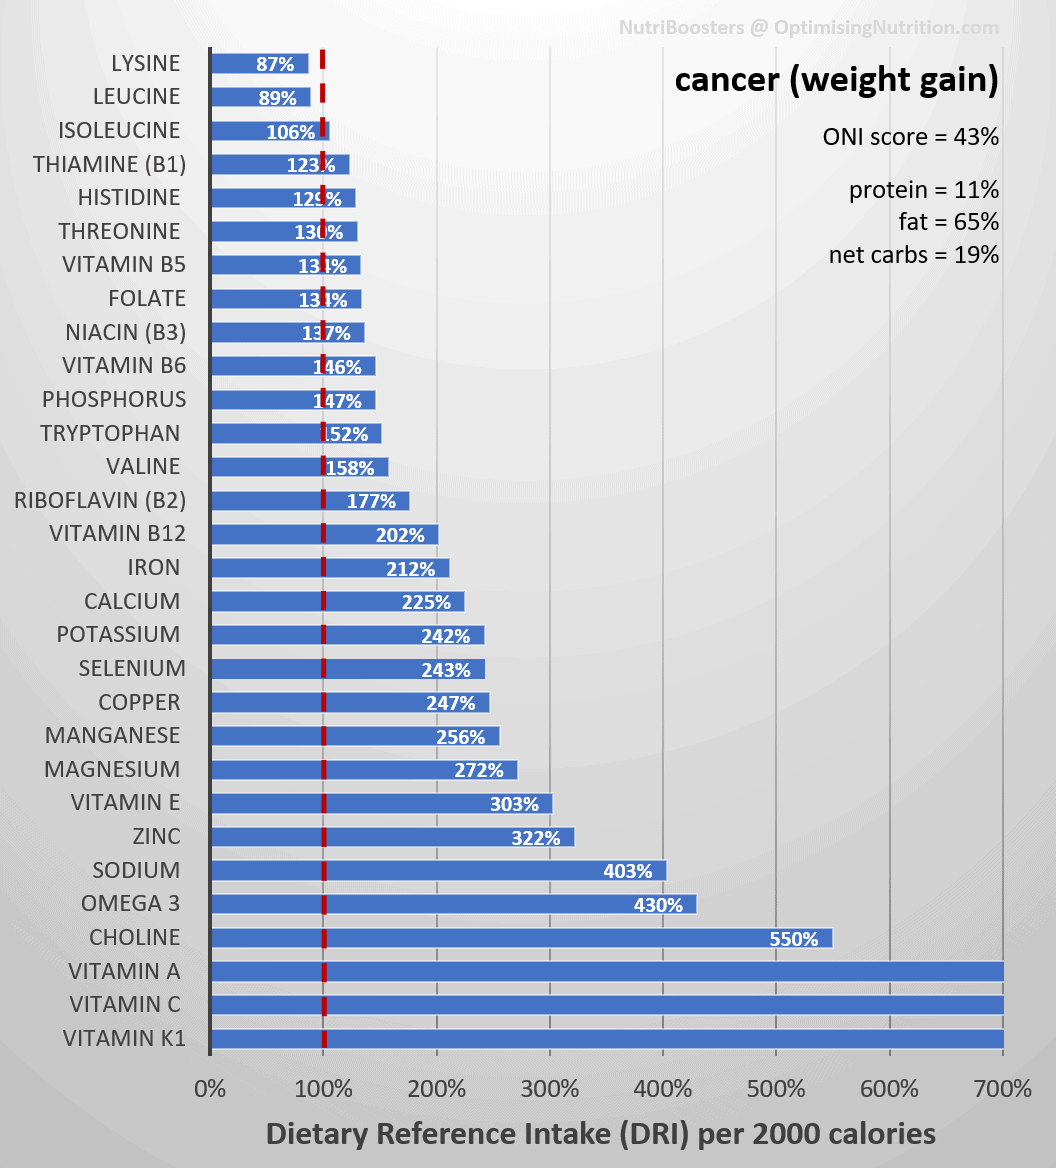
For comparison, the chart below shows the same recipes in the same Maximum Nutrient Density book scored by Dietary Reference Intake (DRI) per 2000 calories, rather than Optimal Nutrient Intake (ONI). A high DRI score is reasonably easy to achieve, but hitting ONI stretch targets requires a bit of extra time and sleuthing to find foods that correct your nutrient deficiencies and balance your diet at the micronutrient level.
Keep in mind that the ONI score is normalised to nutrients per 2000 calories, ensuring that the Optimal Nutrient Intake Score measures food quality, regardless of quantity. When people select more nutrient-dense foods, they typically eat less; they improve their ONI scores by eating foods higher in quality, not higher in quantity.
In its design stage, we envisioned a high or perfect ONI score as a virtually impossible achievement that would push people to reach their stretch goals. We should have saved our graph paper! Precocious Masterclass members quickly learned how to gamify the hunt for personal trophy numbers, and scores ranging from 90% to 100% began peppering the ONIS Leaderboard.
We were surprised, stunned, even, but NOT disappointed to see our original plan go up in a blaze of glory! Give people what they need to succeed, and they will.

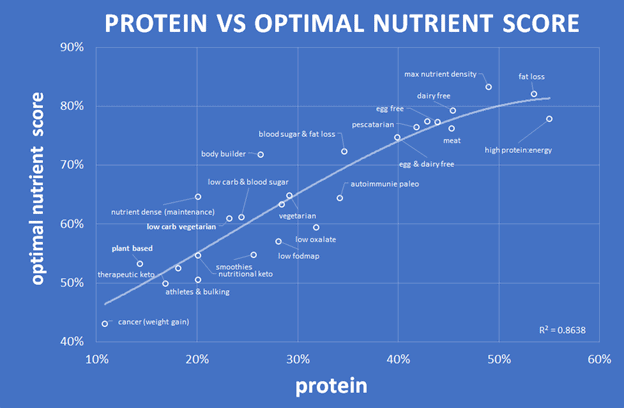
Protein vs Nutrient Density
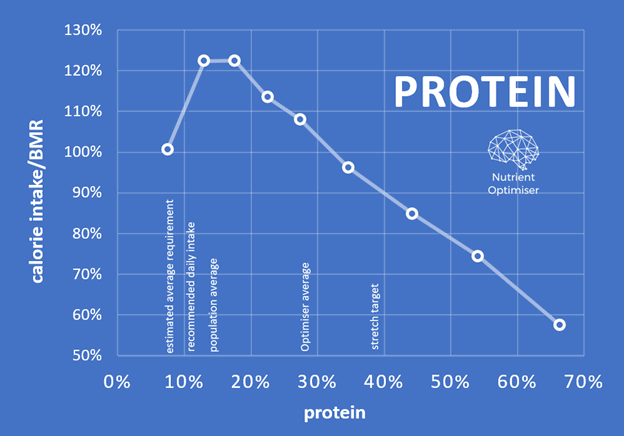
The chart below shows the winning 467 recipes we analyzed and curated for inclusion in Nutrient Optimiser, plotted in Protein Percentage vs. Optimal Nutrient Intake Score format. (For more detail, check out the interactive Tableau version of this chart here.) We discover that lower protein foods generally have lower ONI scores to the left of the chart and that nutrient density peaks around 50% protein toward the right.
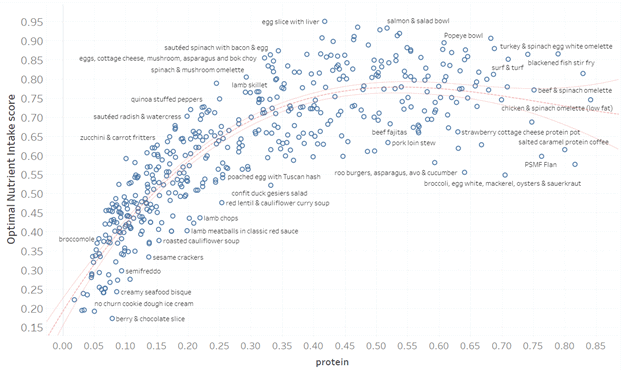
You might achieve greater satiety and preserve lean muscle more efficiently with a diet that derives over half its calories from protein. But you won’t score optimal nutrient density because you typically limit foods rich in minerals and Omega-3s. And let’s be transparent, a goal of 50% protein is hard to achieve, much less maintenance for an extended period. Most people barely manage to consume 11% to 13% of their calories as protein from modern processed foods.
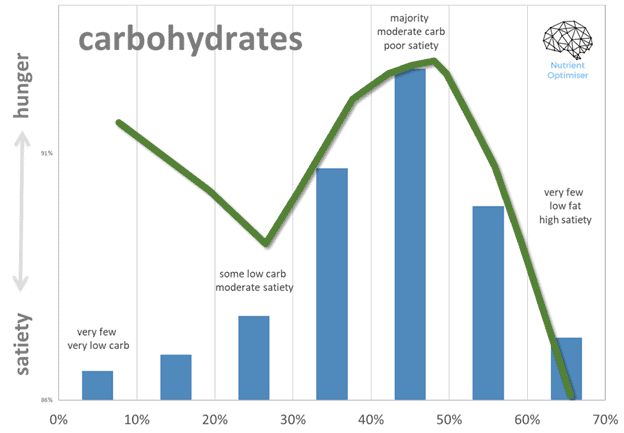
The chart below from our analysis of 587,187 days of MyFitnessPal data shows that when available, we tend to gravitate to hyper-palatable Frankenfoods that contain a similar mixture of carbs and fat but less protein (e.g., cookies, doughnuts, ice cream, and most highly processed food). The right side illustrates few people eat a very low fat/high carbohydrate diet (greater than 60% of energy from carbs), while the left indicates few people consume a low-carb diet (i.e., less than 30% energy from carbs).
The good news is that increasing the percentage of protein in our diet maximises satiety and empowers us to eat less without excessive hunger. Optimally nutritious foods tend to be flavourful, so we enjoy our foods without risking energy toxicity from overeating.
If you want to support higher levels of activity or maximise growth, then increase the amount of energy from fat and/or carbs in your diet. These foods typically are hyper-palatable and easy to overeat. Dr Mike Isratel refers to this as climbing up and down the Hedonic Staircase. Our NutriBoosters recipe books are purpose-written to help you identify meals that you will enjoy and align with your current goals.

Jumping from 10% to 50% protein overnight isn’t recommended because it’s challenging to do and nearly impossible to sustain. Progress over perfection! Ideally, increase your daily protein percentage slowly by dialling back refined dietary fats and carbs and progressing further down the staircase only if you’ve stalled or still have body fat to shed.
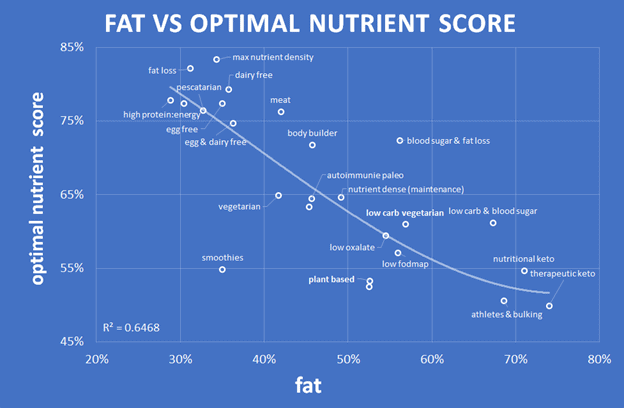
Fat vs Optimal Nutrient Intake Score
The following chart shows the relationship between fat and ONI scores for the 467 recipes in Nutrient Optimiser (check out all the details here). We see toward the right of the chart that very high-fat foods tend to be less nutritious.
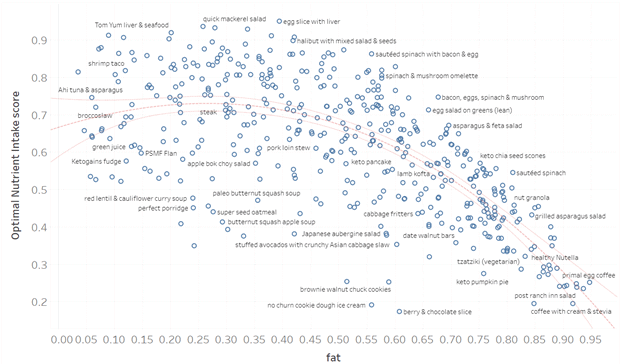
Moving towards the left, we discover that reducing fat tends to increase nutrient density and satiety (up to around 30%). Yet again, we suggest making incremental changes to fuel energy needs unless you’re supporting a super-aggressive calorie deficit for maximum weight loss.
Net Carbs vs. Optimal Nutrient Intake Scores
The following chart shows net carbs (i.e., total carbs minus fibre) vs. ONI scores (check out the details here). Recipes with fewer carbs trend towards slightly higher nutrient density, so we didn’t analyze those with lots of added sugar or flour (i.e., reducing carbs didn’t significantly increase nutrient density).
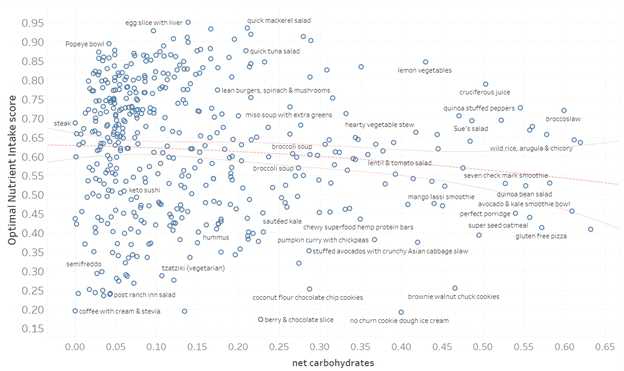
If you want to stabilise your blood sugars at healthy levels, reduce carbohydrates (ideally while keeping nutrient density high) by choosing recipes moving towards the top left of the chart. However, if you are active and your blood sugars are great, you may want to incorporate more carb-weighted recipes towards the top right of this chart. To learn more about dialling in your macros to suit your goals, check out Why Set and Forget Calorie Targets Will Always Fail You (and How Smart Macros Algorithm Can Help).
Energy Density
The following chart shows that recipes with a lower energy density (i.e., more weight per calorie) tend to be more nutrient-dense (check out the details here).
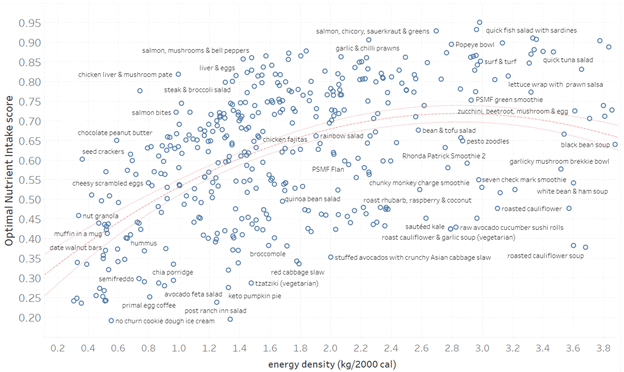
If you’re a lean and active athlete or a growing child, it may be helpful to focus on recipes towards the left of this chart with a higher energy density to enable you to consume more energy.
Towards the right, recipes with a lower energy density are harder to overeat. Ensuring you get optimal protein and keeping an eye on nutrient density means you needn’t worry too much about energy density.
Carb + Fat
Lastly, we have a carbs+fat vs. ONIS chart (check out all the details here).
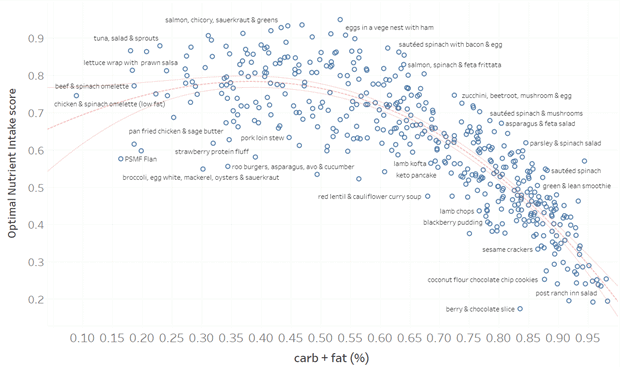
This chart is the reverse of the protein % vs. ONI score chart. If you want to increase nutrient density and satiety, choose foods from the left of this scorecard, with less energy from fat and/or carbs.
The essential collection
The table below lists our most popular recipe books tailored for a range of goals, from aggressive fat loss to bulking, diabetes management, and everything in between.
- The ‘metrics’ column details the blood sugar and waist: height ratio (W: H) that aligns with each goal.
- Overfat people (with a waist: height ratio of greater than 0.5) need NutriBoosters that provide greater satiety to empower them to eat less without excessive hunger.
- People with a blood glucose rise of more than 30 mg/dL or 1.6 mmol/L an hour or two after eating require meals with a lower insulin load to assist them in stabilising blood sugars, normalising appetite, and avoiding blood sugar crashes.
- Click on the book’s title in the left-hand column to access more details for that specific book.
- Click on the ‘DRI’ and ‘ONI’ in the right-hand column to see the nutrient fingerprint of that recipe book (i.e., micronutrients and macronutrients).
| Name | Goal | Metrics | DRI | ONI |
| Fat loss | Fat loss with greater satiety and less hunger and cravings due to nutrient deficiencies and adequate protein to prevent muscle loss | W:H > 0.5 | DRI | ONI |
| Maximum nutrient density | Maximum nutrients per calorie | NA | DRI | ONI |
| High protein: energy | High protein:energy ratio for aggressive fat loss (i.e. PSMF or high P: E) | W:H > 0.5 | DRI | ONI |
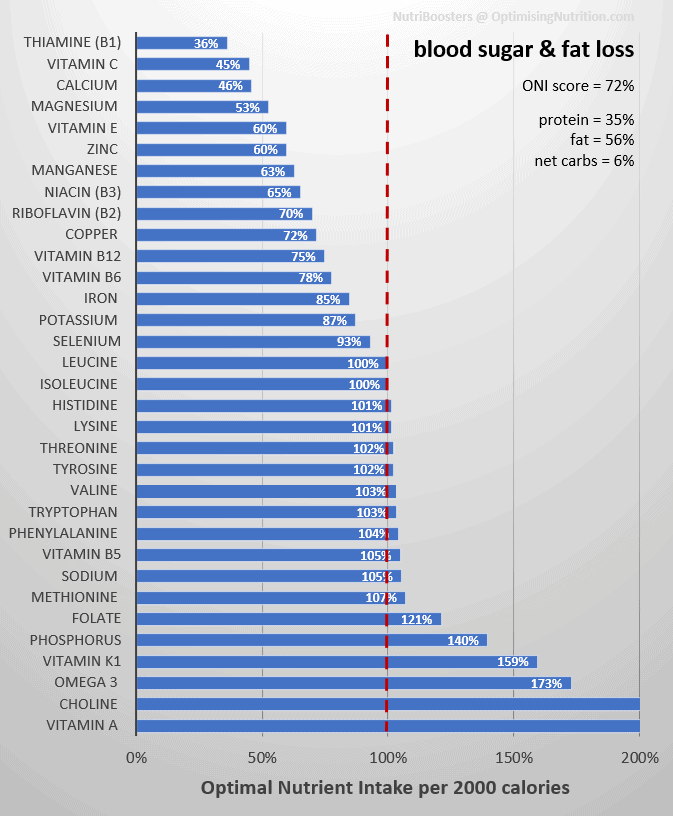
| Blood sugar & fat loss | Designed for anyone with elevated blood sugars and excess body fat | W:H > 0.5 BG rise after meals > 30 mg/dL or 1.6 mmol/L | DRI | ONI |
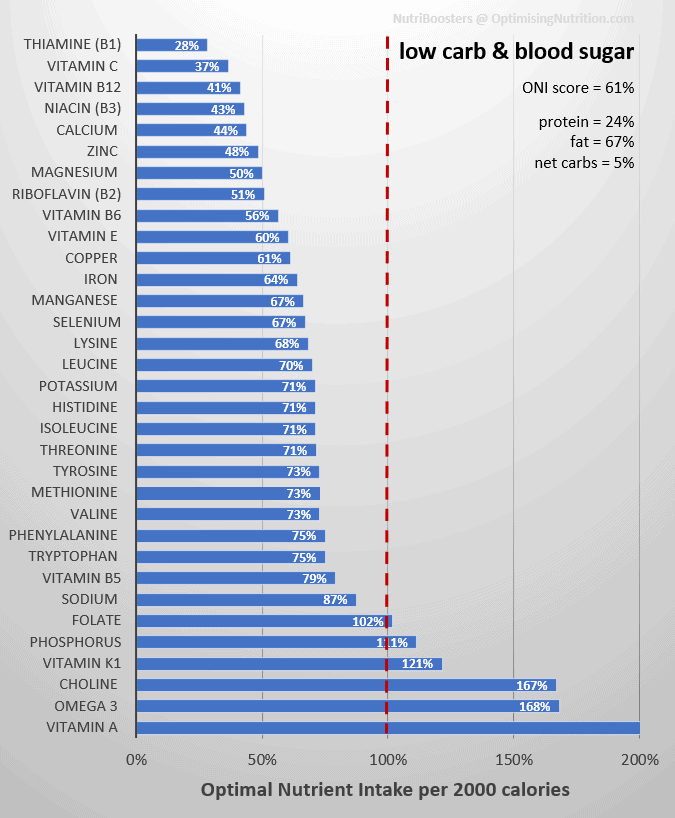
| Low carb & blood sugar | Designed for stable blood sugars and weight maintenance on a nutritious low-carb diet. Ideal for someone with diabetes or anyone who enjoys a low-carb way of eating | W:H < 0.5 BG rise after meals > 30 mg/dL or 1.6 mmol/L | DRI | ONI |
| Maintenance | Designed to help you maintain your body weight and provide plenty of nutrients to live a healthy and energised life | W:H < 0.5 | DRI | ONI |
| Bodybuilders | Gain muscle without excess body fat | W:H < 0.5 | DRI | ONI |
| Athletes & bulking | Designed to support activity or growth with an eye on nutrient density | W:H < 0.5 | DRI | ONI |
The other NutriBooster books
The table below lists the remaining books tailored for different preferences and goals. We have worked hard to create the best version of these dietary approaches based on science, preferences, and particular conditions. Each suite of recipes is optimised for nutrient density as much as possible while still aligning with each goal.
| Goal | Appropriate for | DRI | ONI |
| Nutritional keto | Ideal for someone who enjoys a ketogenic way of eating but does not require therapeutic ketone levels | DRI | ONI |
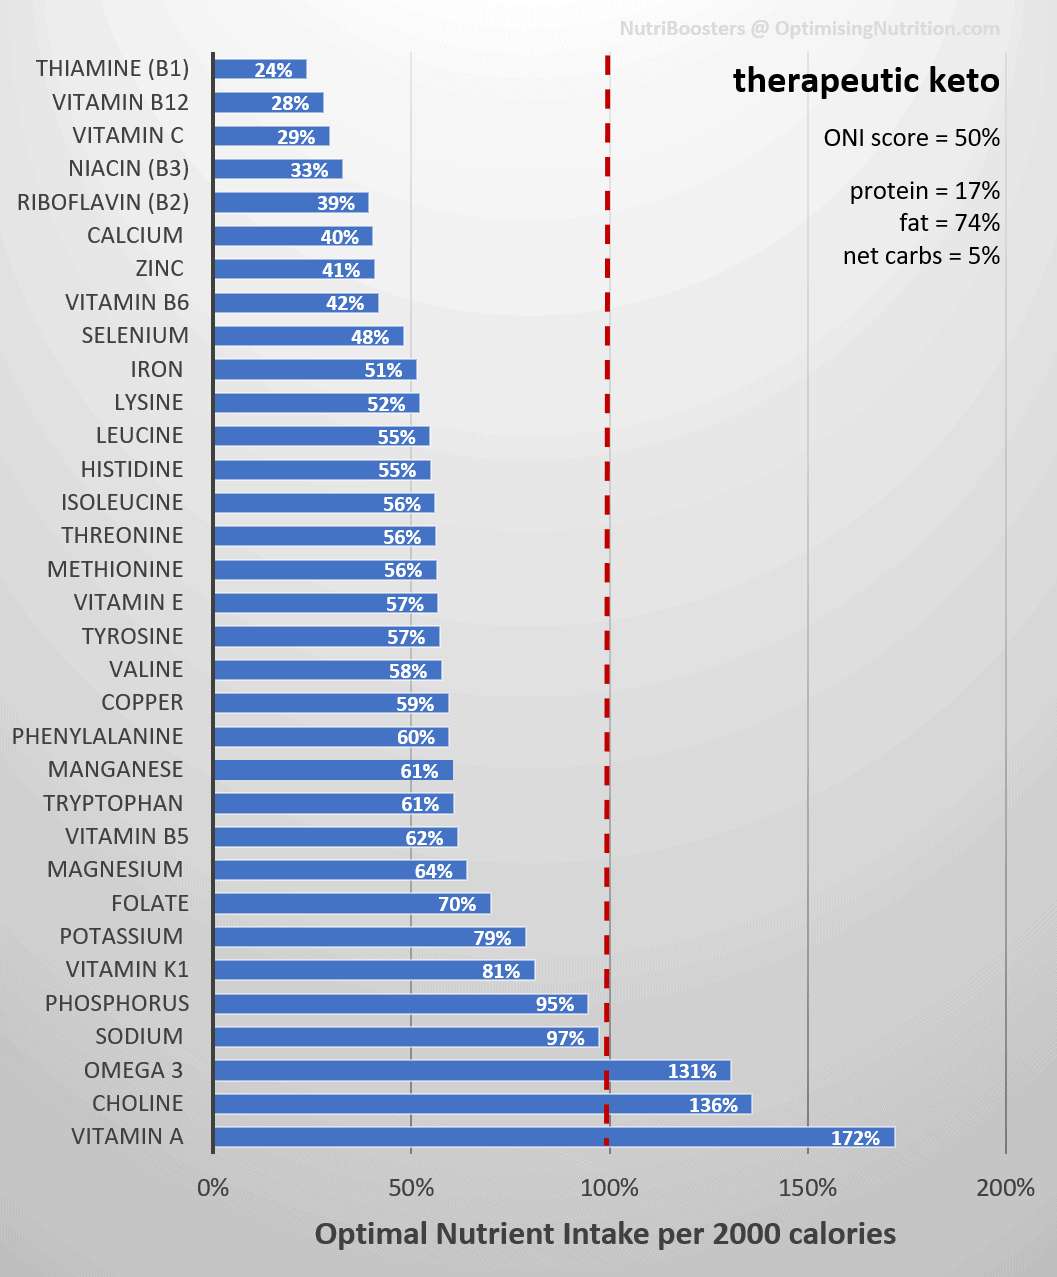
| Therapeutic keto | Designed for people who require therapeutic ketone levels (e.g., epilepsy, dementia, or Parkinson’s) | DRI | ONI |
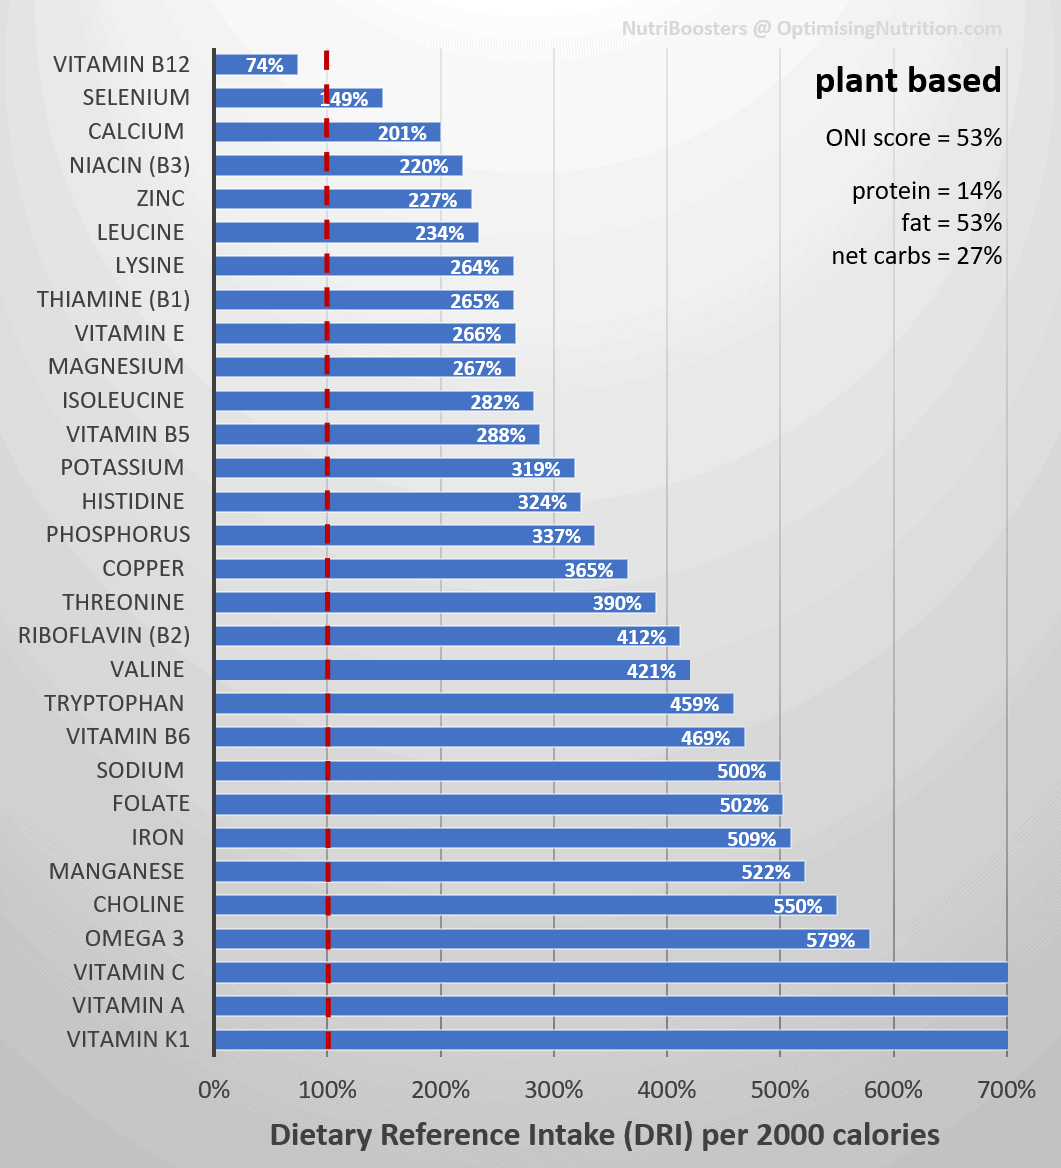
| Plant-based | These are the most nutrient-dense plant-based recipes available. | DRI | ONI |
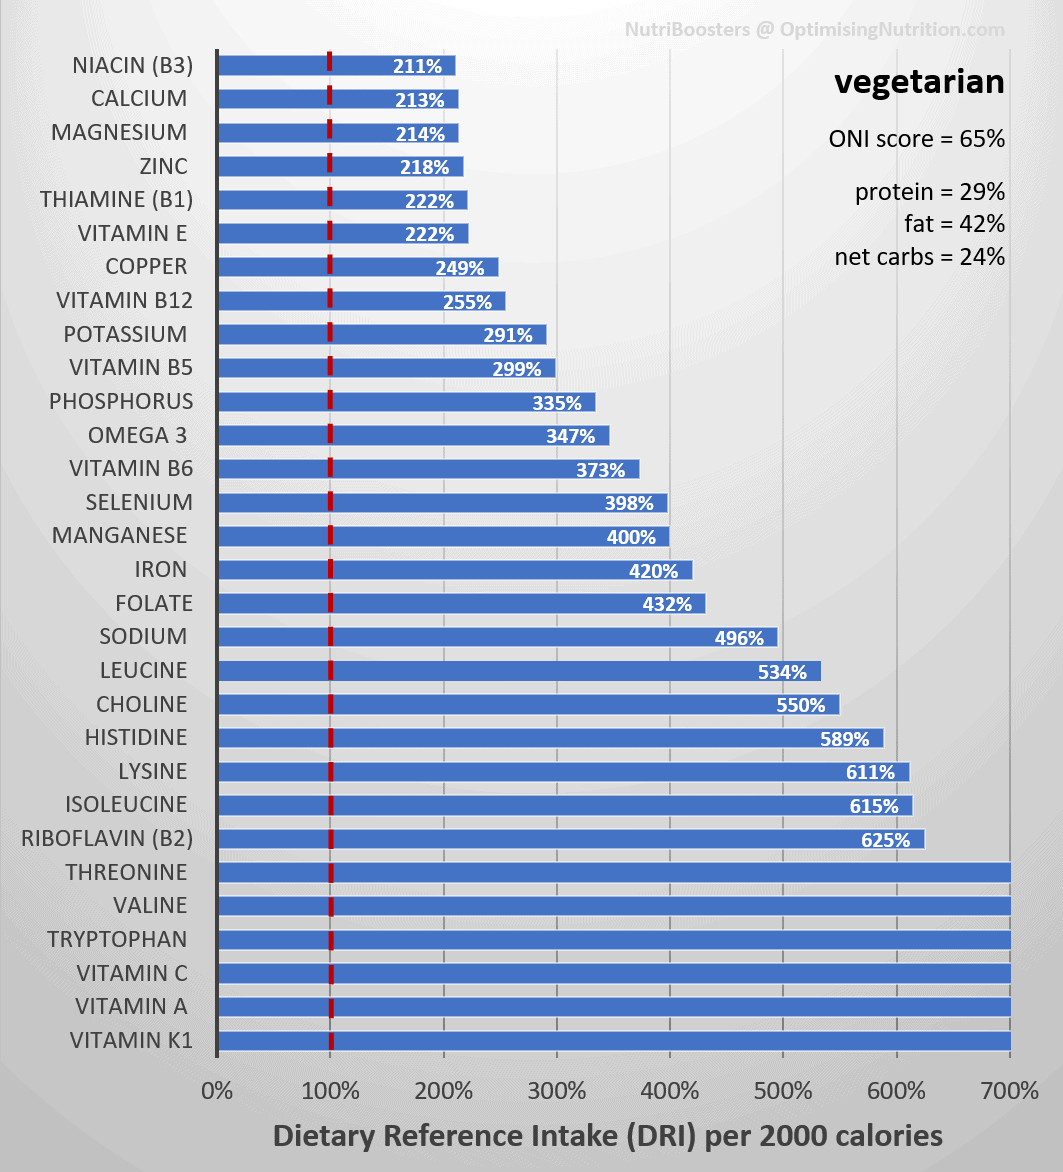
| Vegetarian | These are the most nutrient-dense vegetarian meals. | DRI | ONI |
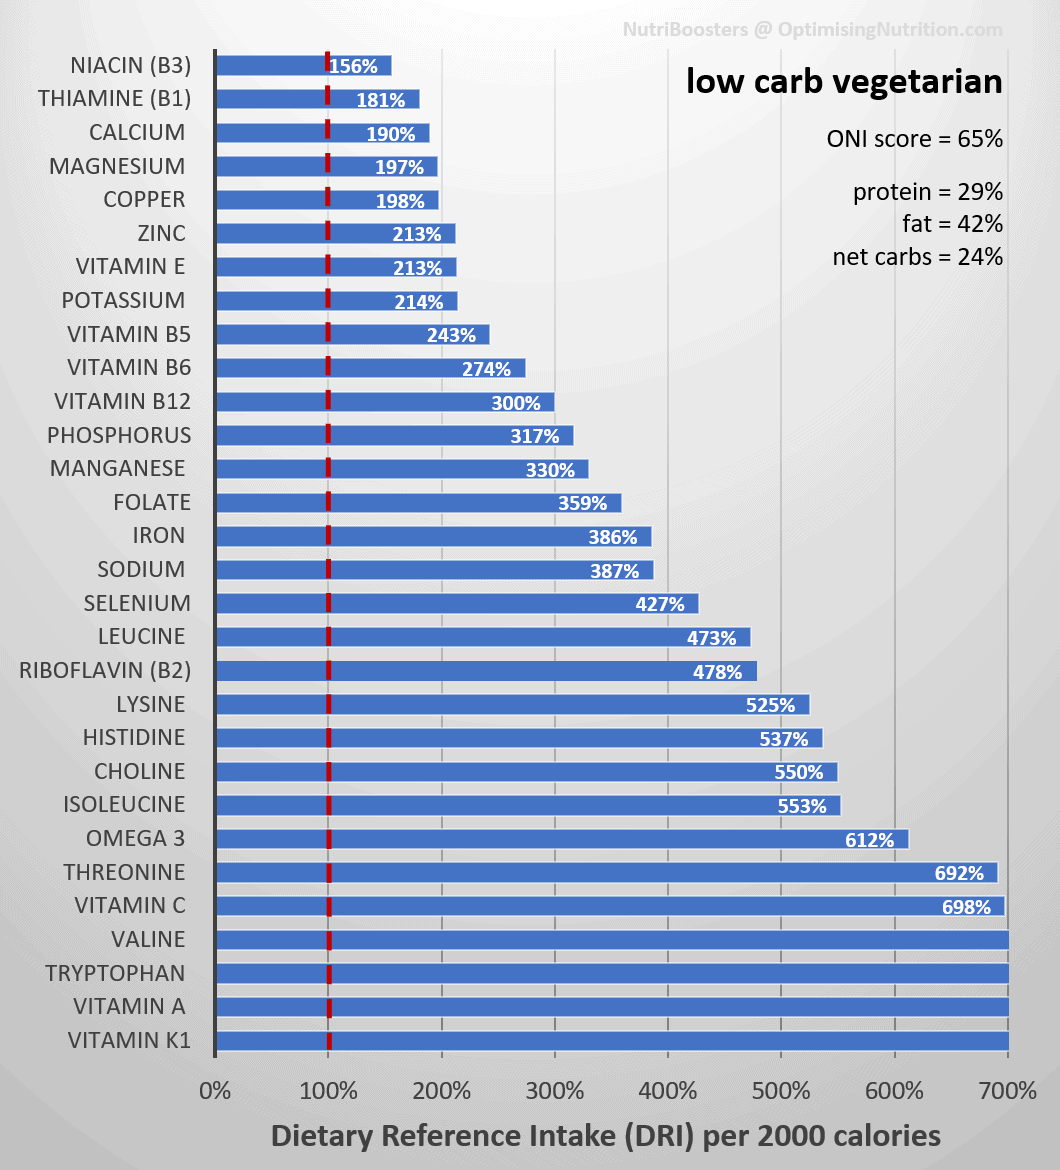
| Low carb vegetarian | Nutrient-dense low-carb vegetarian meals to help stabilise blood sugars | DRI | ONI |
| Pescatarian | These are the most nutrient-dense pescatarian recipes (i.e., vegetarian plus seafood) | DRI | ONI |
| Egg-free | The most nutrient-dense egg-free meals | DRI | ONI |
| Dairy-free | The most nutrient-dense dairy-free meals | DRI | ONI |
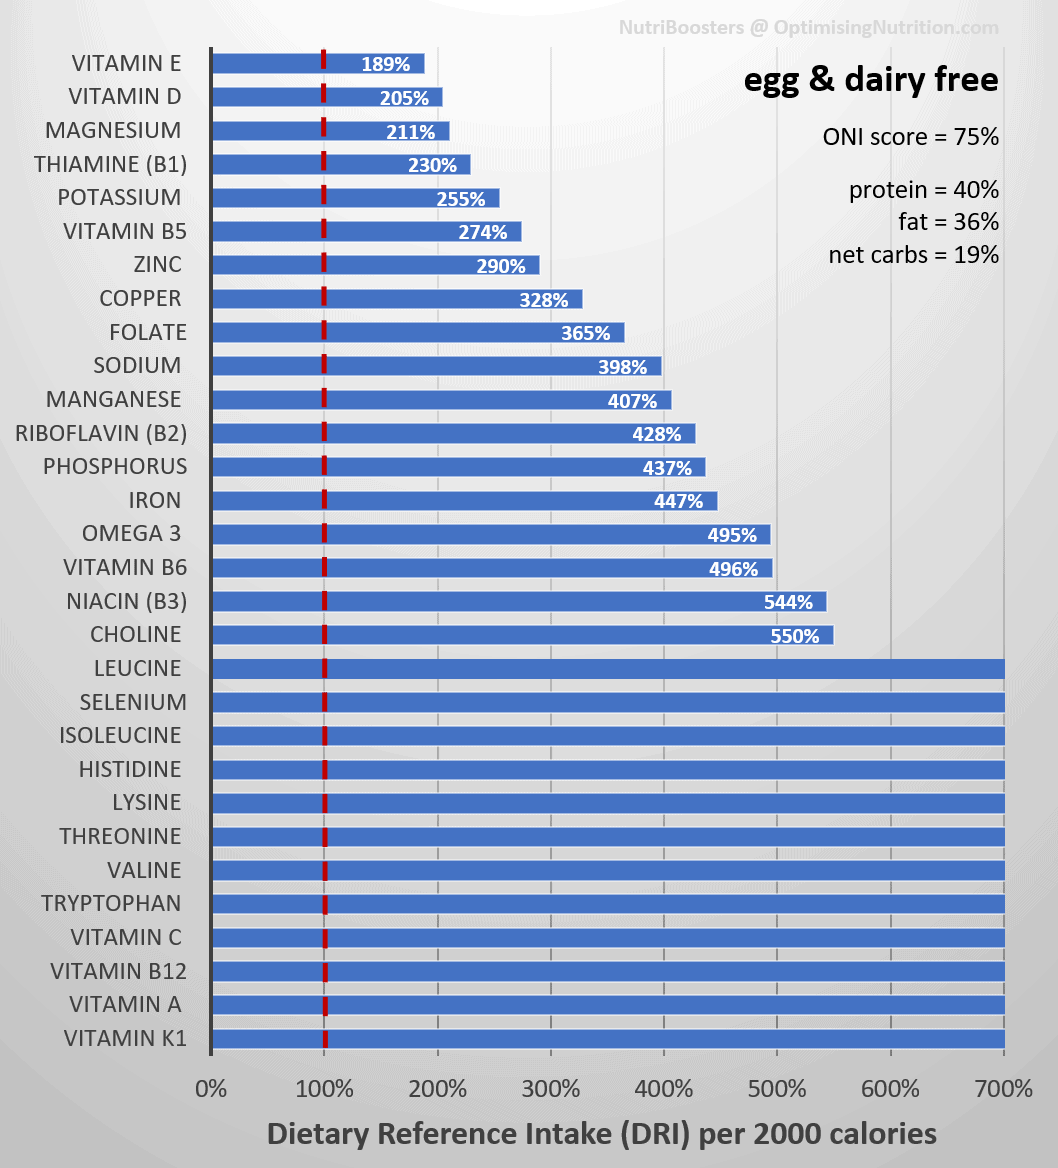
| Egg & dairy-free | The most nutrient-dense meals without eggs or dairy | DRI | ONI |
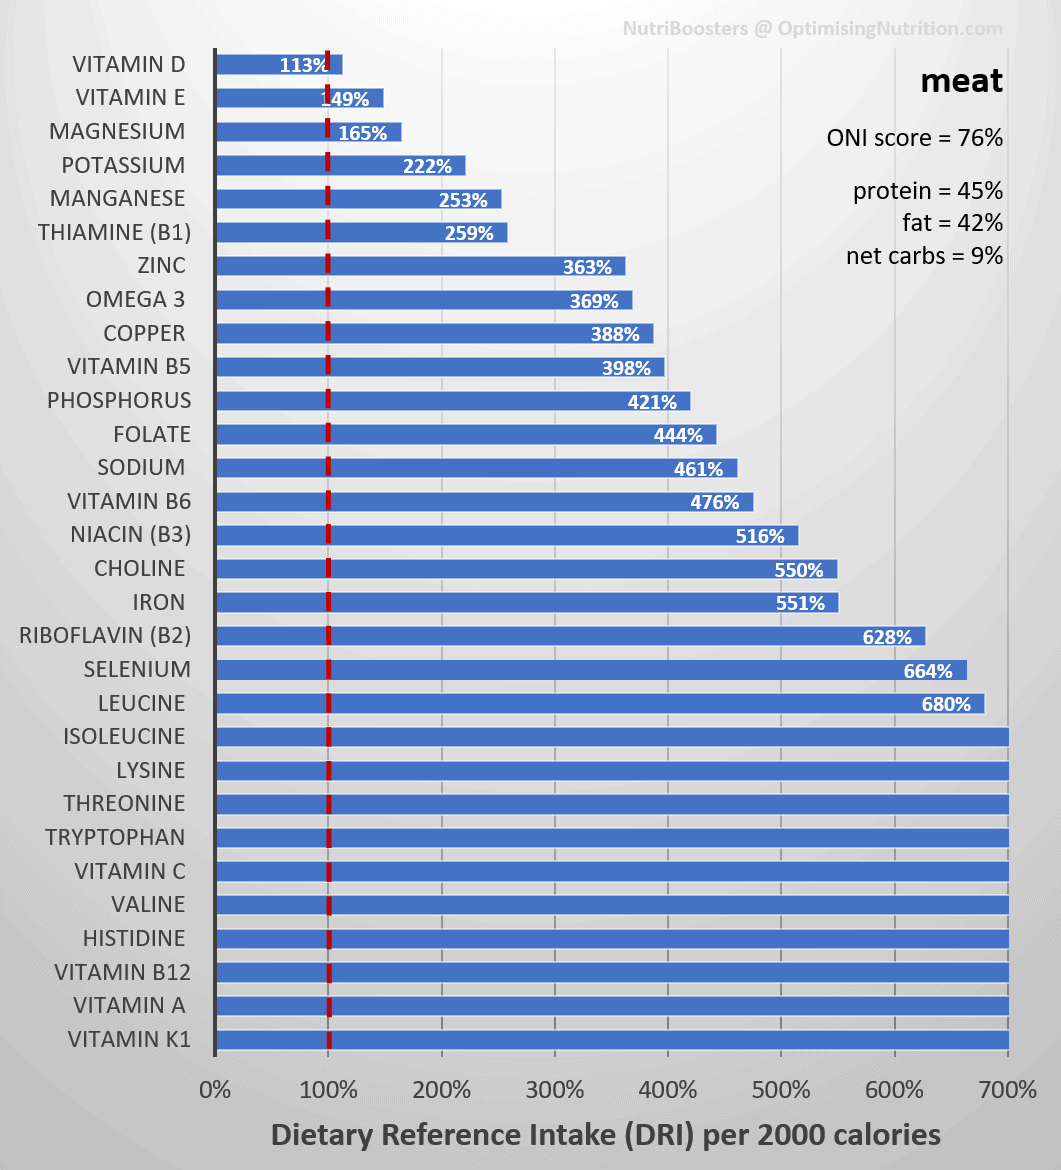
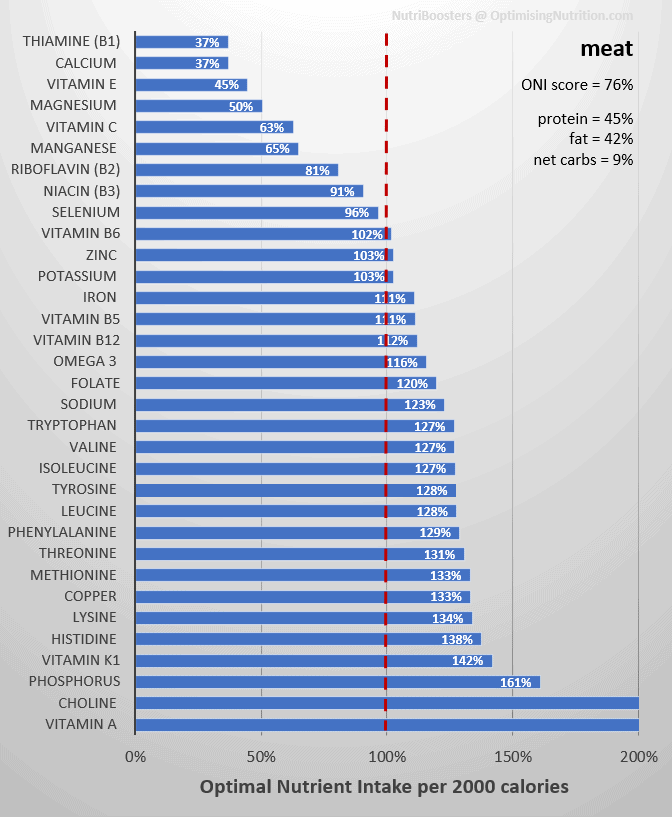
| Meat | These are the most nutrient-dense meals that contain meat (i.e., beef, pork, chicken, etc., without seafood). | DRI | ONI |
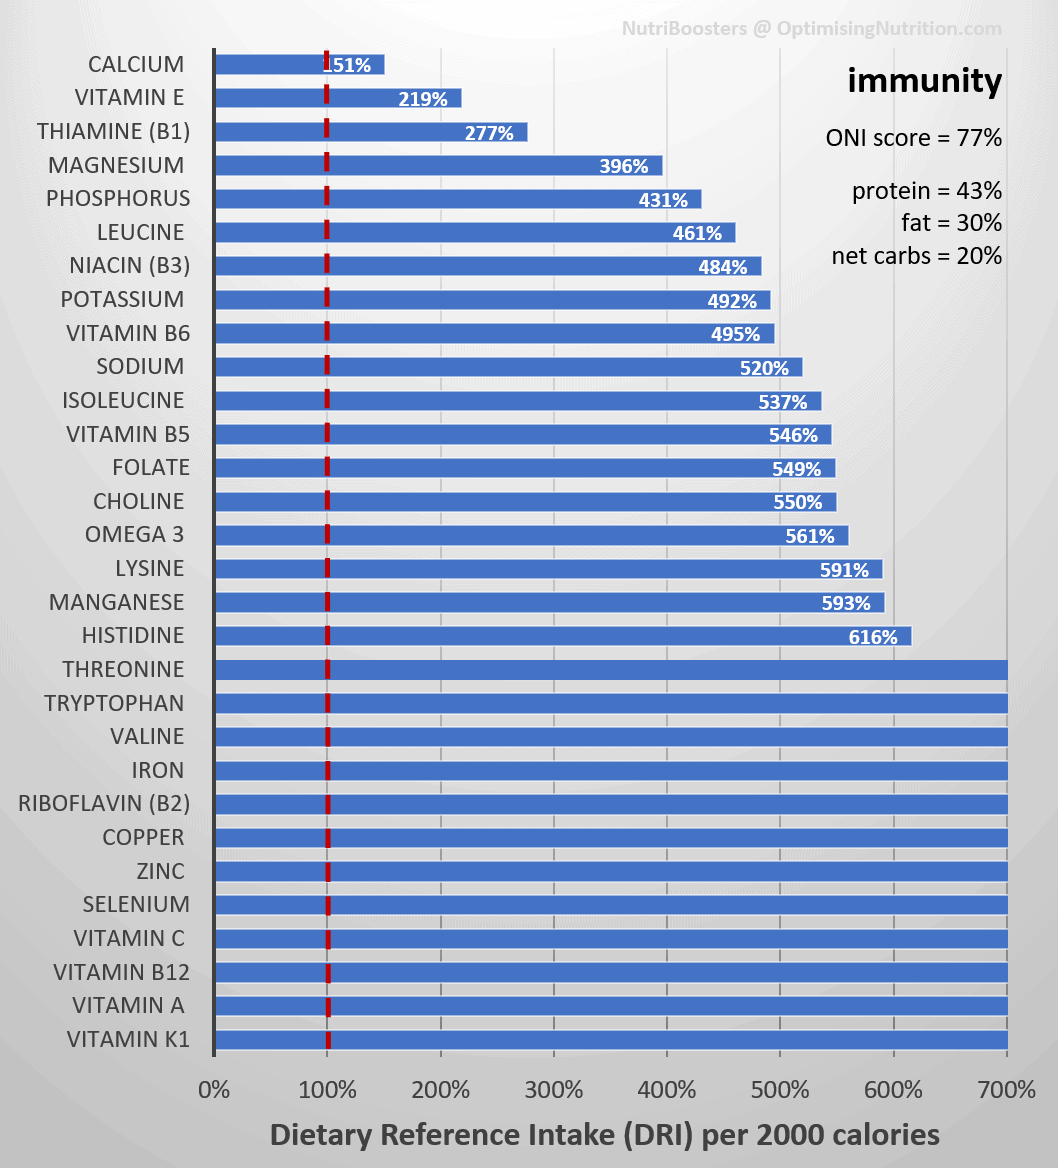
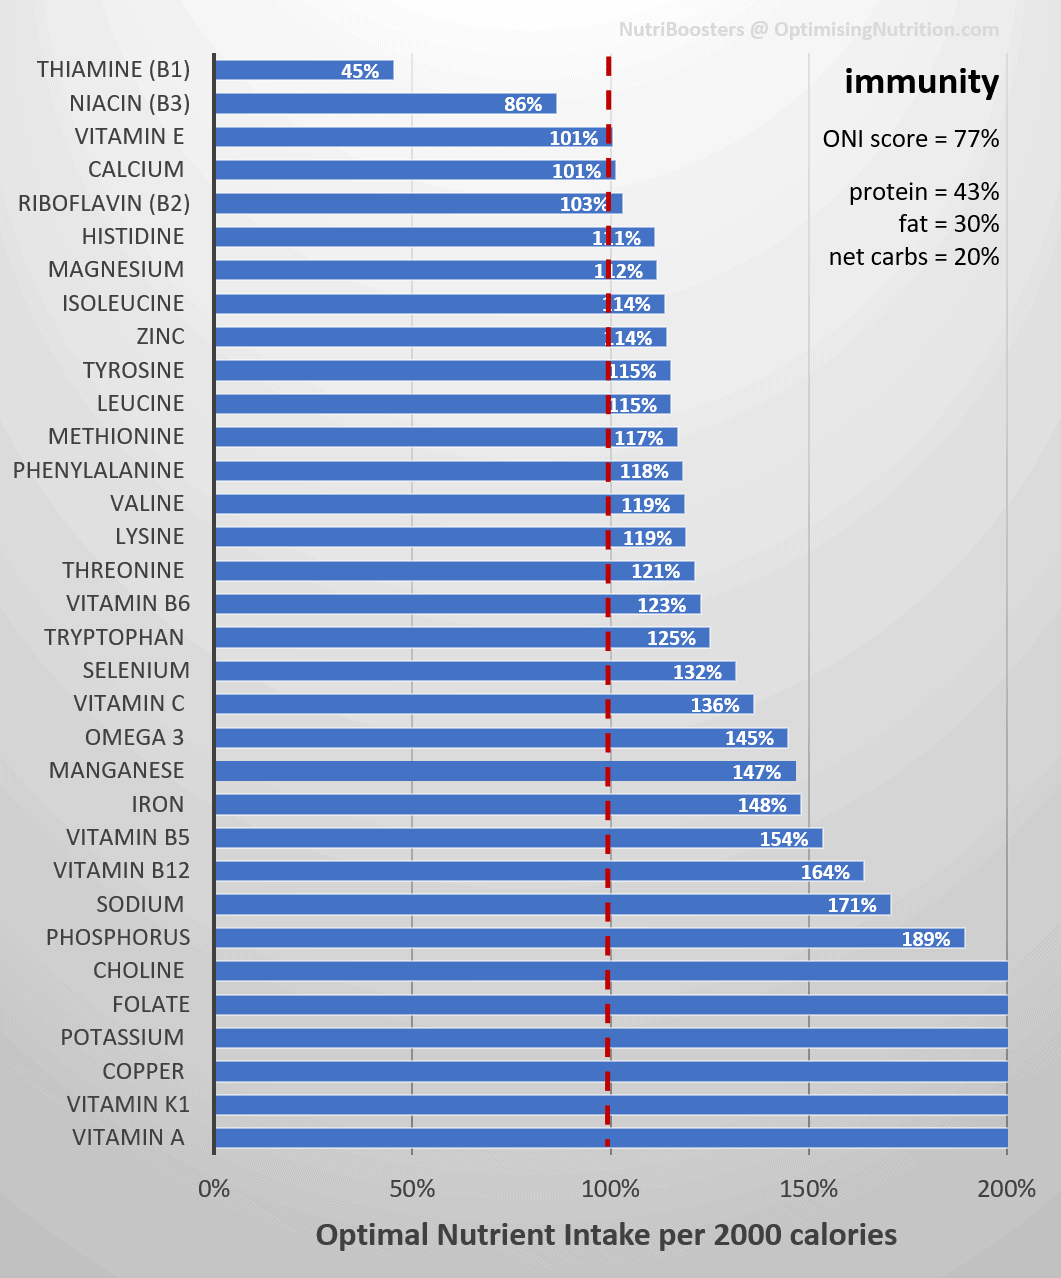
| Immunity | These recipes prioritize the nutrients that support healthy immune function (i.e., vitamins A, C, and D, iron, selenium, zinc, and potassium). | DRI | ONI |
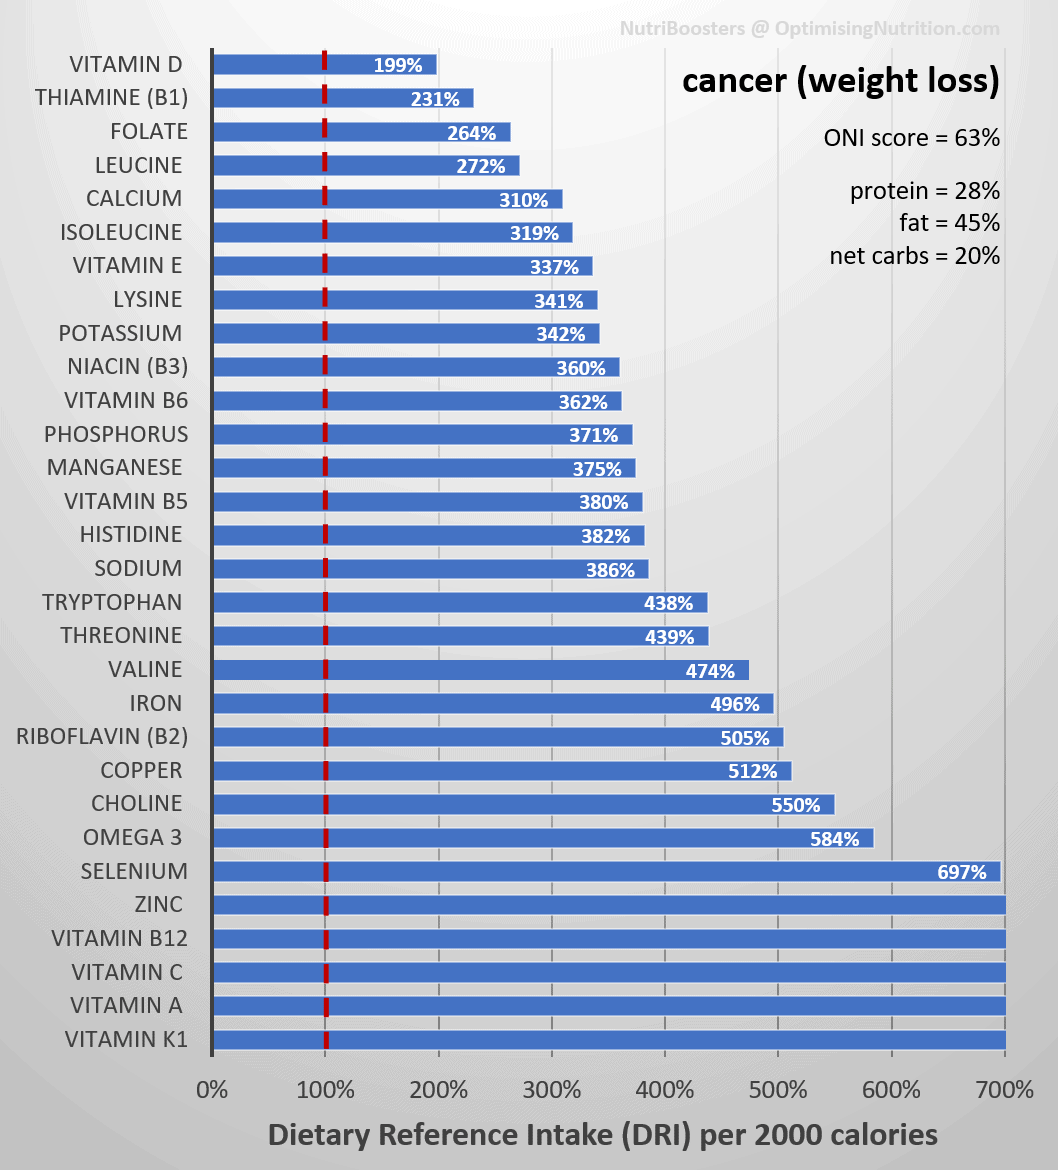
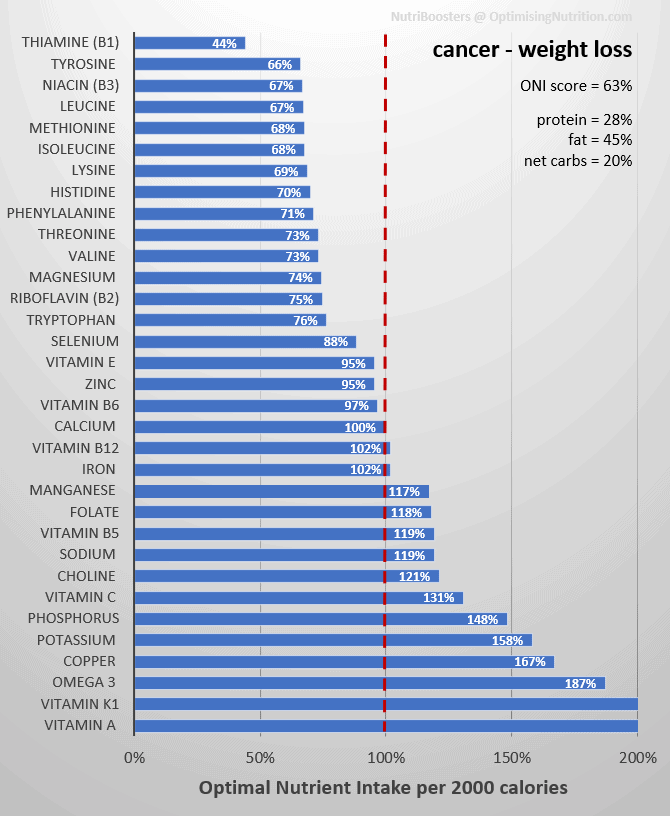
| Cancer (weight loss & nutrient density) | Designed for someone with cancer (i.e., less glutamic acid and methionine) while maximising nutrient density and satiety to promote fat loss | DRI | ONI |
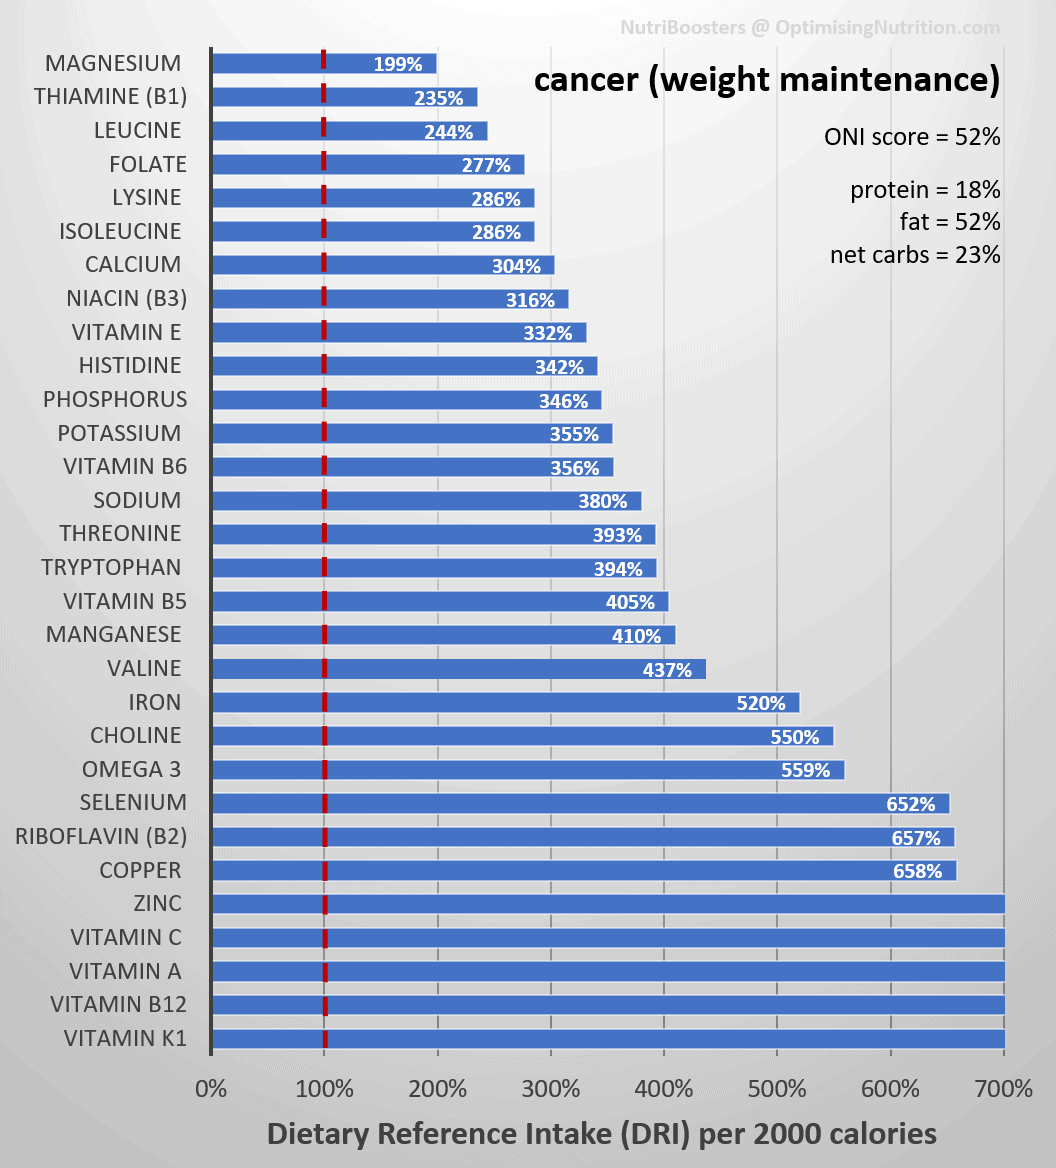
| Cancer (weight maintenance) | Designed for someone with cancer (i.e., less glutamic acid and methionine) while providing enough energy to maintain a healthy weight | DRI | ONI |
| Cancer (weight gain) | Designed for someone with cancer (i.e., less glutamic acid and methionine) while providing plenty of energy to support weight gain after cancer treatment | DRI | ONI |
NutriBoosters Recipe Group
We have been working hard to grow a Nutritional Optimisation Movement comprised of people who are passionate about optimising the quality of the food they eat to give their body what it needs. The NutriBooster Recipes Facebook Group has more than seven thousand people participating in the journey.
We love sharing NutriBoosters from the books and those created by members every day. We’d love you to join us to get a preview of the recipes and learn more about how and why we went to all the effort to create this unique series of books[LF5] !
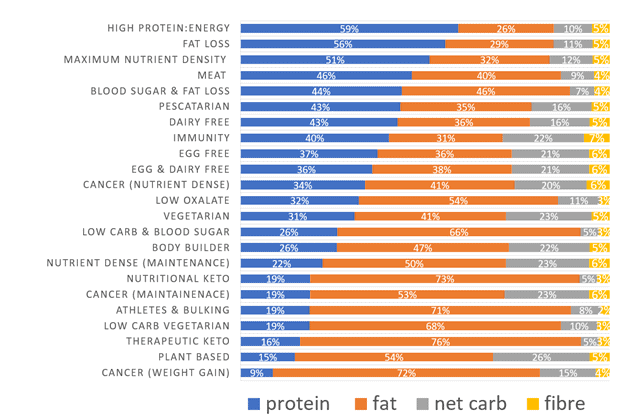
Macronutrient Comparison
The chart below shows the macronutrient breakdown of each nutrient-dense recipe book, sorted from highest to lowest protein content. At the top is High Protein:Energy NutriBoosters at 59% protein, and on the bottom, Cancer (Weight Gain) NutriBoosters, with 9% protein.
Protein vs. ONI Score
The following charts show the macros for each of the books vs. the ONI score. Fat Loss and Maximum Nutrient Density have a very high nutrient density score and protein content.
Fat vs. ONI Score
Again, we see that less fat corresponds to higher nutrient density, which is excellent if you’re trying to lose body fat! However, if you are trying to grow or fuel a lot of activity, level up on added fat for energy.
Carbohydrates vs. ONI Score
All of our nutrient-dense recipes tend to be lower in carbohydrates, including the plant-based and vegetarian books. As a general rule, some carbs are more nutritious than fewer carbs. Our analysis shows that about 15%-20% energy from non-fibre carbs are optimal, but there is no strong correlation between intake of non-starchy carb sources and nutrient density.

How Can I Calculate My Nutrient Intake?
If you’re interested in checking if you’re getting just enough dietary phosphorus, you can check your nutrient profile using our Free 7-Day Nutrient Clarity Challenge.
After a week of tracking your current diet in Cronometer, Nutrient Optimiser will give you a prioritised list of foods and NutriBooster recipes that will help you plug your current nutritional gaps.
Level Up Your Nutrient Density
To help you level up your nutrient density, we’ve prepared a Nutritional Optimisation Starter Pack to ensure you are getting plenty of all the essential nutrients from the food you eat every day.
The free starter pack includes:
- Maximum Nutrient Density Food List
- Sample Maximum Nutrient Density Recipe Book
- Sample Maximum Nutrient Density Meal Plan.
To get started today, all you have to do is join our new Optimising Nutrition Group here.
Once you join, you will find the Nutritional Optimisation starter pack in the discovery section here.
Have you noticed the carbs vs. the ONI score graph looks like it is frowning? Maybe that’s a hint…
LOL! it’s a sign!