
Eager to step beyond the conventional Glycemic Index (GI) in managing your blood sugar levels?
Enter the Glucose Score—a remarkable tool that unlocks a more precise understanding of how different foods impact your glucose levels.
This article delves into the Glucose Score, comparing it with the GI and illustrating how to utilize both tools for optimum blood sugar management. Through a clear understanding of these tools, managing your blood sugar levels becomes a less daunting task. Ready to redefine how you manage your blood sugar?
Dive into the intricacies of the Glycemic Index and the Glucose Score and step closer to mastering your blood sugar levels.
BONUS: FREE Video Lecture “Making sense of the food insulin index”
- Why Stable Blood Glucose Is Important
- What is the Glycemic Index?
- What Is the Glycemic Load?
- Who Developed the Glycemic Index?
- How Is the Glycemic Index Calculated?
- What Is a Good Glycemic Index Score?
- What is the Glucose Score?
- Glucose Score Data
- How Do Carbs, Protein, Fat, and Fibre Impact Your Glucose?
- Net Carbohydrate vs Glycemic Index vs Glucose Score
- Protein vs. Glucose Score vs. Satiety Index
- Low Glycemic Index Meals and Recipes
- Low Glucose Score Meals
- Glucose Response to Carbohydrates vs. Fat
- Limitations of the Glycemic Index & Glucose Score
- Summary
- More
Why Stable Blood Glucose Is Important
In a world awash with diabetes and insulin resistance, optimising your blood glucose is a big deal! Elevated glucose is generally a sign of poor metabolic health and insulin resistance, often stemming from obesity.
The more your glucose rises, the more likely it is to come crashing back down. This leads to increased hunger, eating sooner, and overeating less-optimal foods at the next meal (i.e., reactive hypoglycemia).
While chronically elevated blood glucose leads to many complications over the long term, it’s the crash in glucose that you should be aware of to avoid excessive hunger and maintain consistent energy levels.

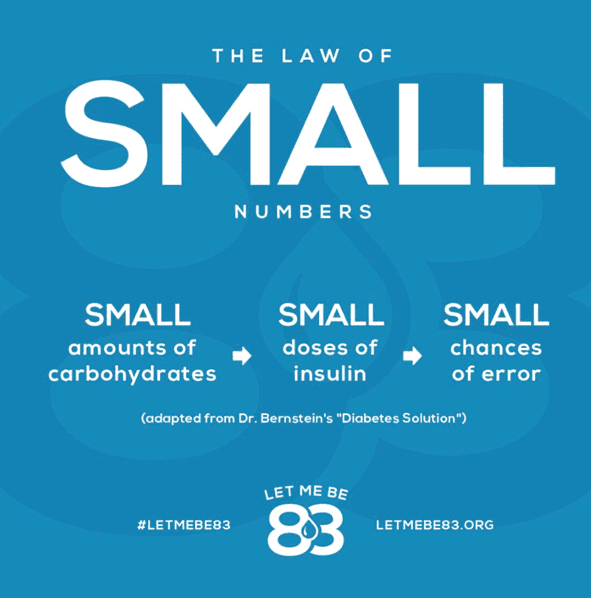
Additionally, people like my wife and son who have Type-1 Diabetes, along with the growing number of people with insulin-dependent Type-2 Diabetes, often struggle to match large doses of insulin with large intakes of fast-acting carbohydrates.
Per Dr. Bernstein’s Law of Small Numbers, meals that cause a smaller rise in glucose require less insulin and smaller errors that are easier to correct. So, understanding which foods raise glucose the most vs. the least can be helpful to optimise blood glucose control.
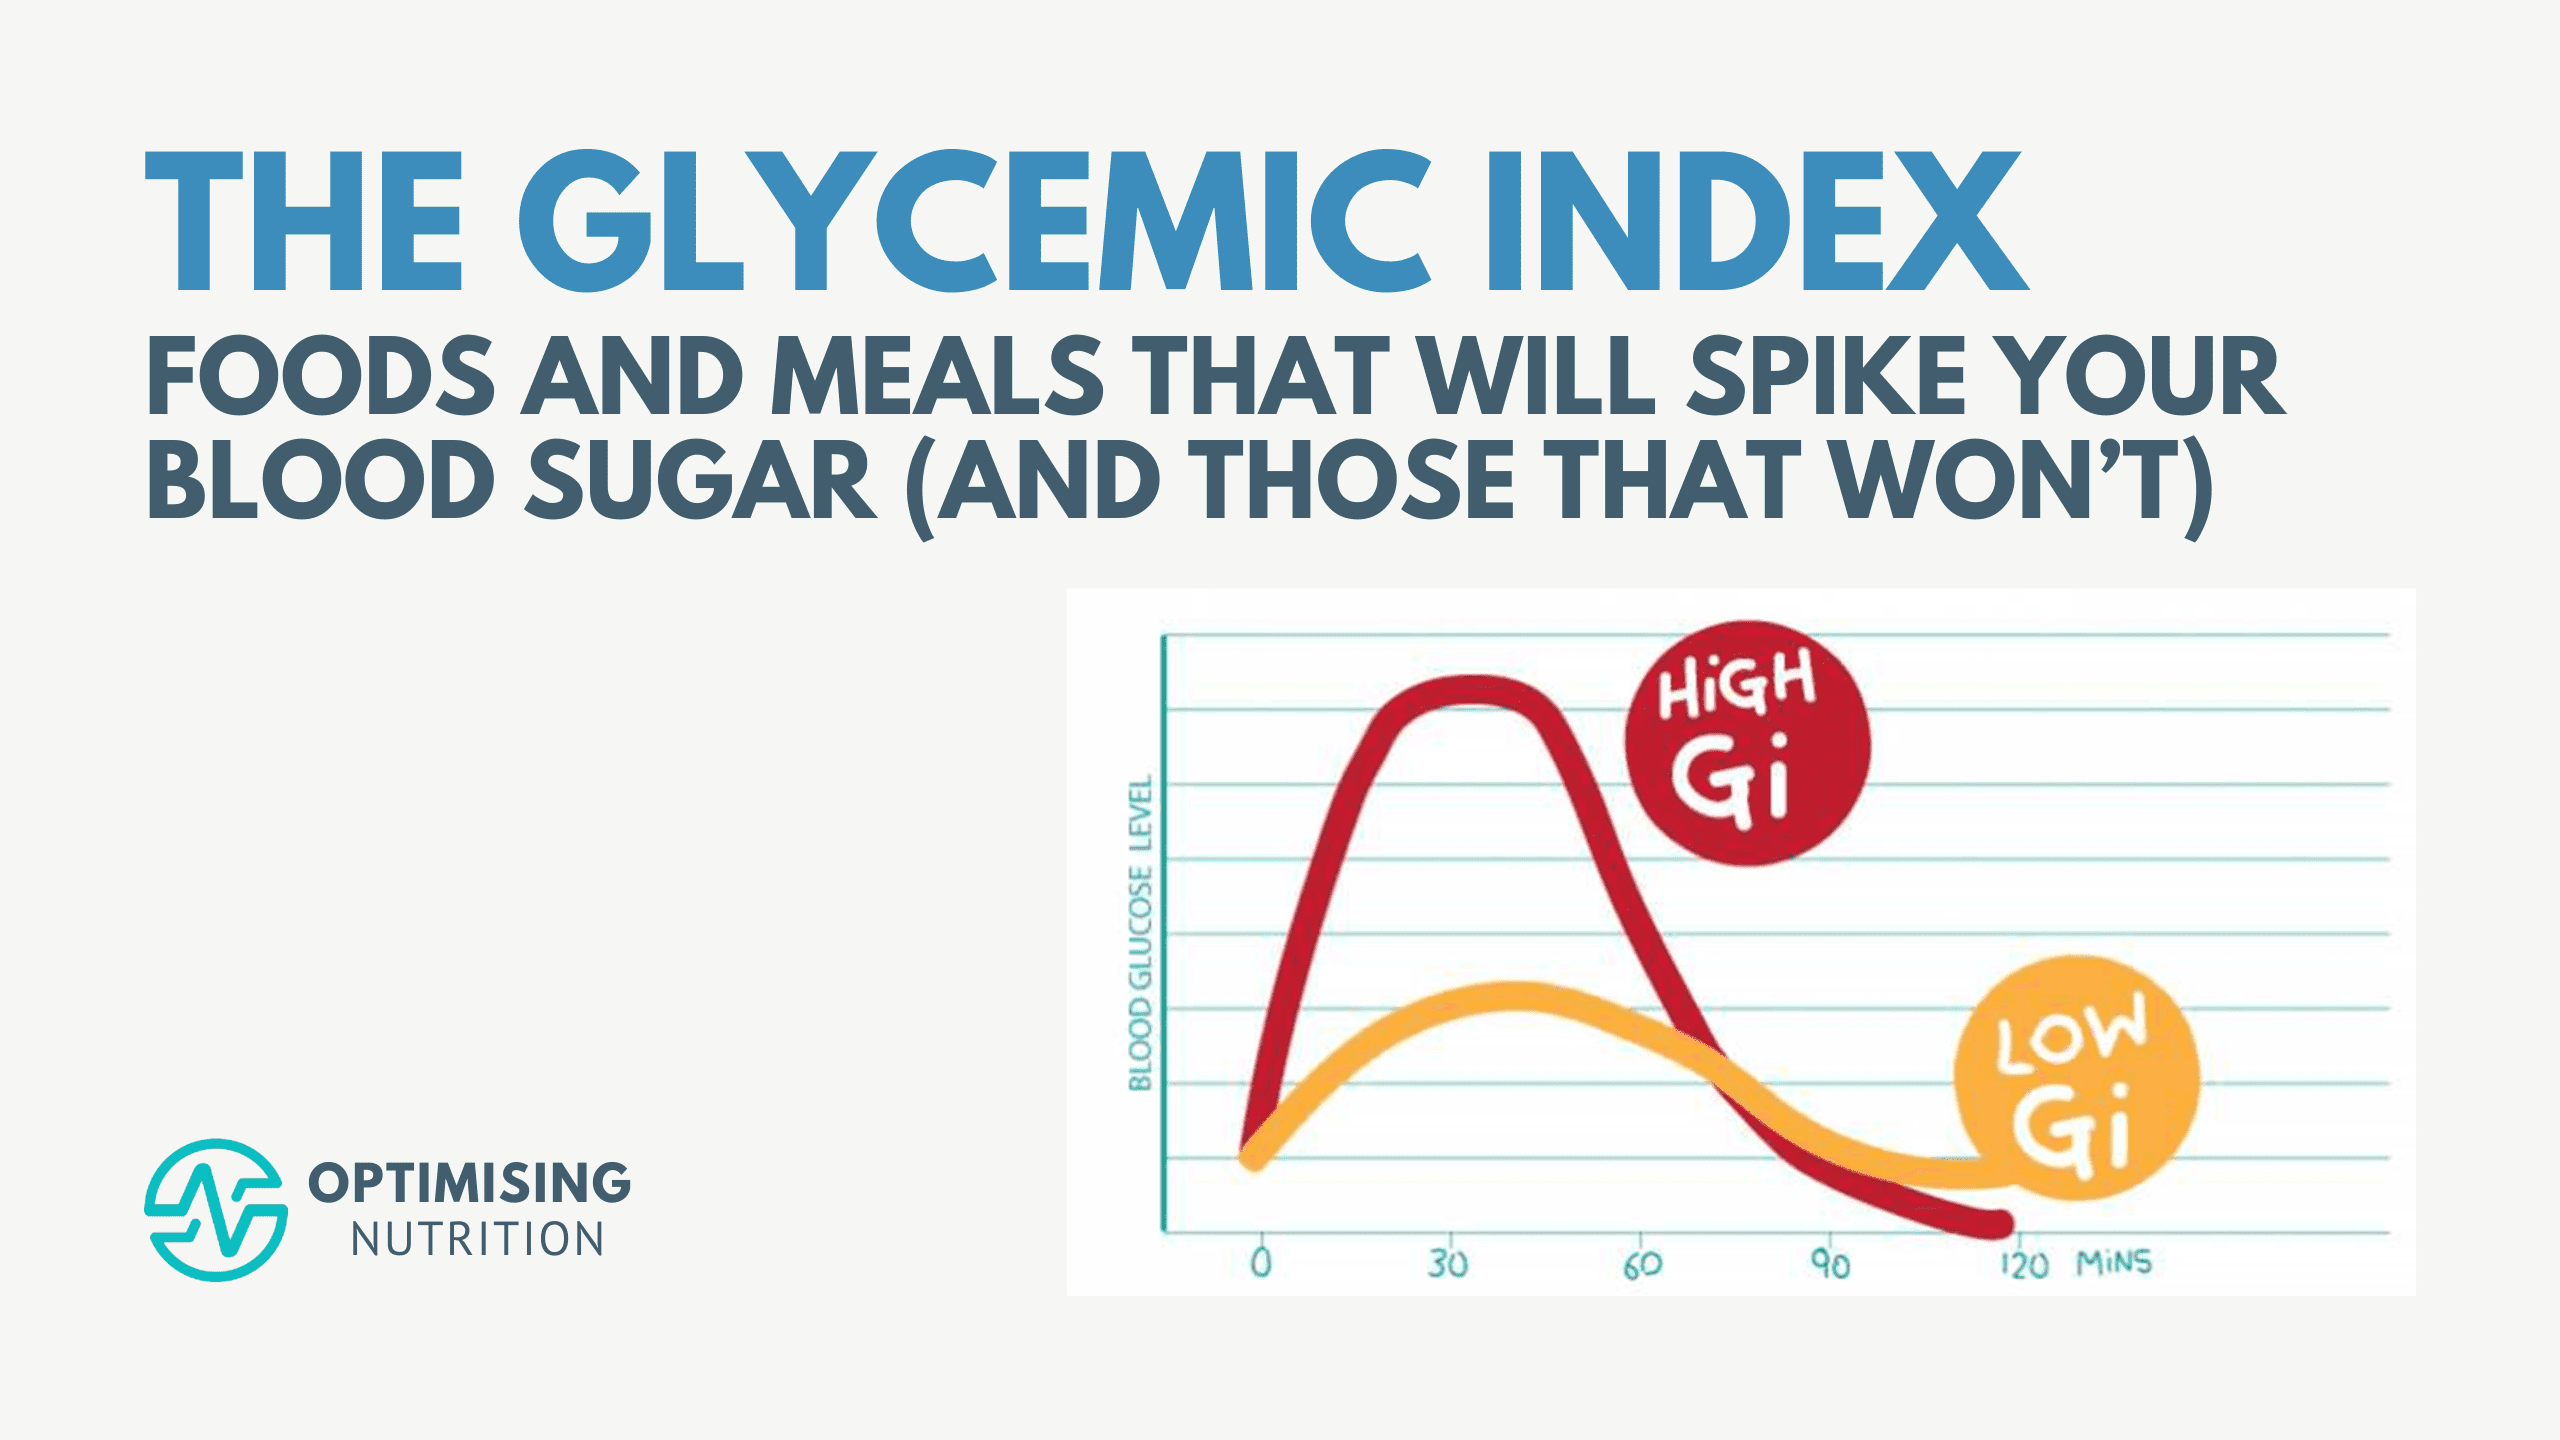
What is the Glycemic Index?
The glycemic index (GI) usually measures how much 50 g of carbohydrates in a food raises blood glucose levels relative to white bread (which has a score of 100).
- Foods with a high GI value are rapidly digested and absorbed. This causes a rapid spike in blood sugar.
- Foods with a lower GI value are absorbed more slowly and raise blood sugar levels more gradually.

What Is the Glycemic Load?
Although a food may have a high GI, it won’t raise your glucose much if you only eat a little bit of it. Portion size matters. While you might be able to eat a few bowls of cereal, it’s hard to eat a lot of spinach. Thus, it will have a lower Glycemic Load.
Glycemic Load (GL) considers the quantity of carbohydrates in a food and how quickly the body metabolises them. The formula for calculating Glycemic Load is:
- Glycemic Load = GI x net carbs
Thus, Glycemic Load is a more accurate indicator of a food’s effect on blood sugar levels than the Glycemic Index alone because it accounts for the quantity and quality of carbohydrates in a food.
Who Developed the Glycemic Index?
The Glycemic Index was developed by Dr David J. Jenkins and colleagues at the University of Toronto in the early 1980s. The GI has since become one of the most widely used tools for people with diabetes trying to manage their blood sugar levels.
How Is the Glycemic Index Calculated?
The GI is calculated by feeding ten metabolically healthy subjects a portion of food containing 50 grams of carbohydrates and measuring their blood glucose over the next two hours.
The area under the two-hour blood glucose response for the food is then calculated. The same ten subjects are later fed a high-glucose food (e.g., white bread), and the area under the curve glucose response is calculated. The ratio between the two responses is the Glycemic Index.
Unfortunately, one of the limitations of the GI data is that it is usually only tested on high-carb foods and thus excludes higher fat and higher protein foods.
What Is a Good Glycemic Index Score?
Generally, foods with a GI that’s less than 55 are considered ‘low’-Glycemic Index foods. Conversely, foods with a glycemic index greater than 70 are considered ‘high’, and those in the middle are considered ‘moderate’.
- Low-Glycemic Index foods – less than 55
- Medium-Glycemic Index foods – 55 to 69
- High-Glycemic Index foods – greater than 100
If you are someone with T2D or severe metabolic syndrome, it’s recommended to prioritise low-GI foods.
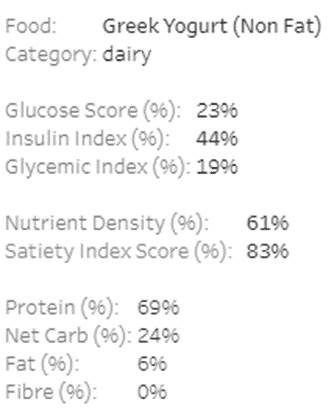
What is the Glucose Score?
Rather than simply testing the glucose response to 50 g of carbohydrates, the Glucose Score tests the two-hour glucose response to a fixed amount (1000 kJ or 239 calories) of any food.
The Glucose Score allows us to compare the glucose response to any food, not just high-carbohydrate foods!
Glucose Score Data
In our previous article, Making Sense of the Food Insulin Index, we used data from the University of Sydney to estimate the insulin response to a wide range of foods based on their macronutrient properties. Our analysis showed that carbohydrates elicit the most significant insulin response, but protein and fat impact insulin to a lesser degree.
The same group that developed the original Food Insulin Index and Satiety Index were also involved in the ongoing expansion and testing of the Glycemic Index, with GI testing undertaken alongside the Food Insulin Index testing as well as testing the Glucose Score.
Dr. Kirstine Bell’s 2014 thesis, Clinical Application of the Food Insulin Index to Diabetes Mellitus, included the expansion of the Food Insulin Index and Glucose score to include 147 foods. The testing also included the Glycemic Index for these foods as well.
How Do Carbs, Protein, Fat, and Fibre Impact Your Glucose?
To understand how each macronutrient influences GI and GS, I ran a multivariate regression analysis on the data to understand the most statistically significant parameters impacting the average rise in glucose after eating.
For the Glycemic Index data, I found:
- Non-fibre carbohydrates raise glucose the most, while
- Fibre reduces the impact of carbohydrates (by 19%), and
- Fat has 20% of the impact of non-fibre carbohydrates.
For the Glucose Score data, I found:
- Non-fibre carbohydrates raise glucose the most, while
- Fat has a small positive impact (7% of non-fibre carbohydrates); and
- Fibre has a negative effect on GI (-6% of non-fibre carbohydrates).
While protein does raise insulin, it doesn’t raise glucose. Instead, protein has a slight negative impact on glucose. However, it was not statistically significant in the analysis, so it was not included.
For more on the impact of protein on glucose and insulin, see:
- Does Protein Spike Insulin (and Does It Matter)? and
- Why Does My Blood Sugar Drop (or Rise) After Eating Protein?
Net Carbohydrate vs Glycemic Index vs Glucose Score
The regression coefficients from the multivariate analysis allow us to calculate the Glucose Score of any food.
To illustrate, the chart below shows net carbs vs Glucose Scores for six-hundred popular foods with our Optimisers.
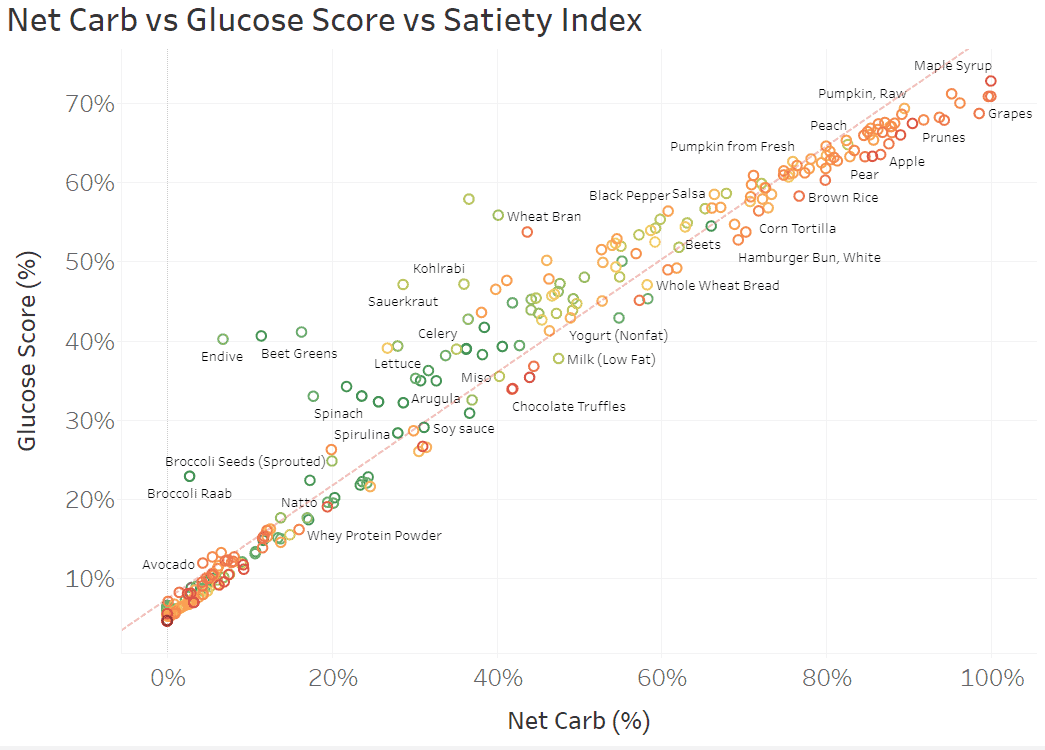
The colouring is based on our Satiety Index Score. Foods in green (like bok choy, cabbage and tuna) are hard to overeat, whereas foods shown in red (like cream, oil, and chocolate brownies) are much easier to overconsume.
To dive into the details, you can view the interactive Tabluea version here on your computer. If you mouse over each point, you’ll see more details on each food, like the macros, nutrient density, satiety score and food insulin index.
So what does all this mean?
As you might expect, high-carb foods like watermelon, rice, and raisins shown towards the right have a higher Glucose Score and will raise glucose quickly.
The middle of the chart shows that high-satiety, high-fibre, non-starchy veggies have a high glycemic index. However, consuming a substantial portion of these foods is challenging, so they may not cause a significant rise. Nutritious, higher-satiety foods will have a lower glycemic load because we won’t be able to eat as much of them.
Meanwhile, we see both high-protein, high-satiety foods shown in green towards the far left and high-fat, low-satiety foods in red towards the left. Both of these types of foods have minimal GI scores.
Overall, this data demonstrates that lower-carb foods will help to stabilise your blood glucose. However, although either fat or protein will keep your glucose stable, it’d be best to prioritise protein over fat for greater satiety, particularly if weight loss is a goal.
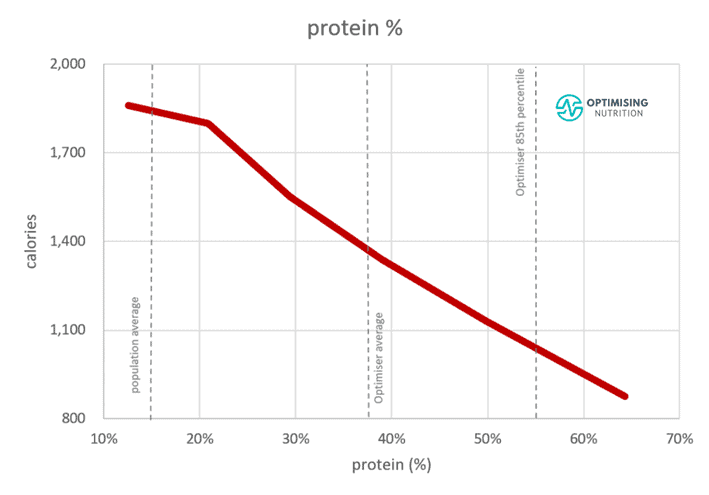
Protein vs. Glucose Score vs. Satiety Index
Things get more interesting when we look at protein % vs the Glucose Score in the following chart.
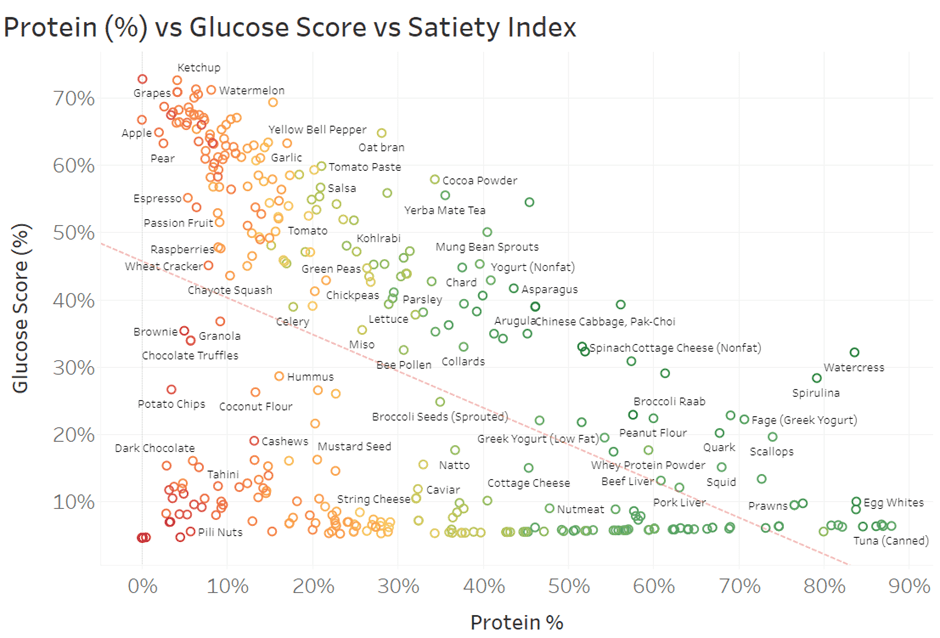
We see towards the right that higher-protein foods tend to have a lower GS. Generally speaking, lower-protein foods towards the left tend to provide less satiety. In comparison, higher-protein foods towards the right provide greater satiety and help keep your glucose stable.
Again, you can dive into the details of this chart in the interactive Tableau version here and mouse over the foods to see more info.
In addition to these charts, we have prepared a range of simple printable food lists tailored to a range of goals that you can access in our Optimising Nutrition Community here.

Low Glycemic Index Meals and Recipes
While looking at individual foods is interesting, we combine them into meals.
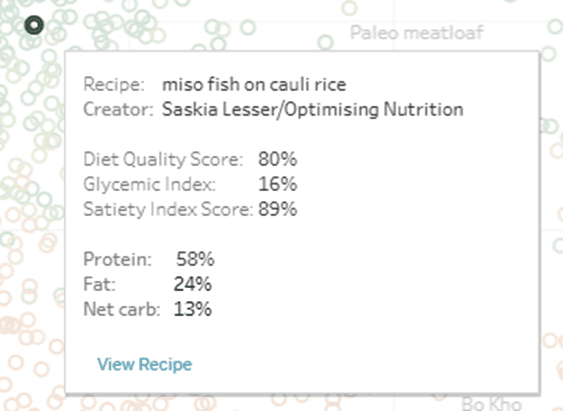
The following chart shows the 1000+ recipes we have prepared for our suite of NutriBooster recipe books in terms of Glycemic Index vs. Diet Quality Score. Again, the colouring is based on our Satiety Index Score.

Notice the cluster of high-satiety meals (green) towards the top left; here, we see a ton of nutrient-dense, lower-glycemic recipes. Diet quality and satiety tend to align, too. The most nutritious and high-satiety recipes tend to have a substantial protein % and lower GI scores.
You can dive into the details of these charts using the Tableau link here. If you click on a recipe, you will see a popup box with more information that includes a link at the bottom to view an image of the recipe.
Many Optimisers in our Macros Masterclass get lost for hours in this chart, finding all the recipes they want to try.
Low Glucose Score Meals
For completeness, the chart below shows the glucose score vs diet quality score, showing a similar trend to the Glycemic Index chart above.

You can dive into all the data in the interactive Tableau chart here and view photos of each recipe.
If you’re interested, you can learn more about our suite of NutriBooster recipe books here. If you’re already part of our Optimising Nutrition community, you can download samples of each NutriBooster recipe book here.

Glucose Response to Carbohydrates vs. Fat
Overall, this data analysis shows that a lower-carb diet aligns with more stable blood glucose, which, to many, is self-evident. But before we wrap up, it’s worth mentioning a few caveats around the risks of merely optimising your diet for stable blood glucose.
The chart below was taken from an NIH study. It shows the glucose response to high-fat (red line) vs. high-carb (green line) meals. Notice how glucose peaks 45 to 60 minutes after a high-carb meal, whereas there is a lower response to high-fat meals.
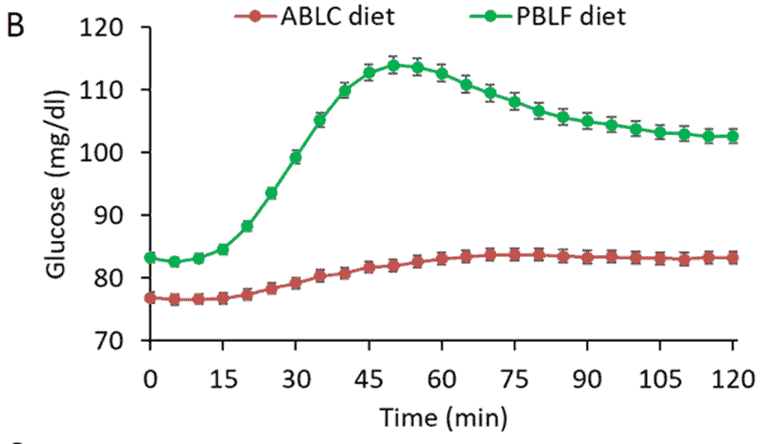
In our Macros Masterclass and Data-Driven Fasting Challenges, we guide Optimisers to reduce their intake of refined carbohydrates if their glucose rises more than 30 mg/dL (1.6 mmol/L) after eating.
In addition to stabilising blood glucose, a lower-carb diet tends to improve greater satiety. This is in part from its greater protein % content and in part because it does not raise and crash blood sugar to the extent of high-carb meals.
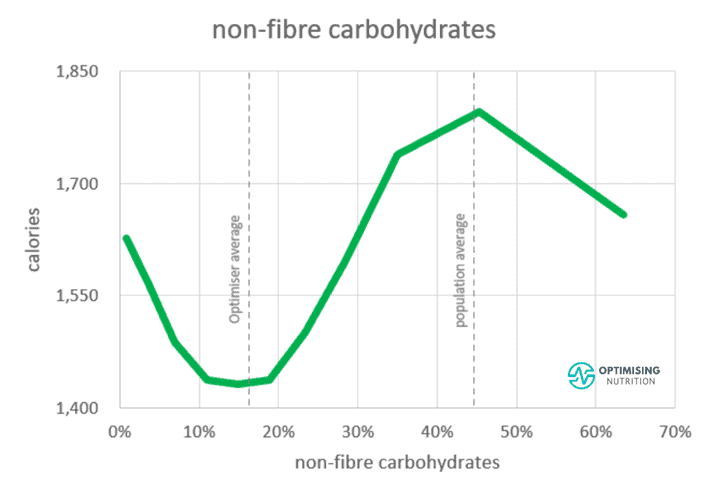
As the chart below from our satiety analysis shows, moving from the typical carb-and-fat combo blend to a diet with 10-20% carbs aligns with a 25% reduction in energy intake.
If your only goal is stabilising your blood glucose, swapping carbs for fat is OK. However, if your goal is also to stabilise blood glucose, lose weight, and improve your metabolic health, it’s ideal to prioritise protein and other nutrients to increase satiety rather than doubling down on dietary fat.
As shown in the final chart below, prioritising foods with a higher protein % (i.e. less energy from fat and carbs) aligns with eating fewer calories.
Limitations of the Glycemic Index & Glucose Score
Finally, it’s important to highlight one of the most significant pitfalls of the Glycemic Index and the Glucose Score data: they only measure the rise in glucose two hours after eating.
While a significant spike in glucose is not ideal, it’s more important to watch out for foods that raise your blood glucose and keep it elevated for a long time. Hyper-palatable, ultra-processed foods contain an ‘addictive’ blend of carbohydrates and fat, with minimal fibre, protein, minerals and vitamins.
These are the low-satiety foods that we find are the easiest to overeat. While they may not ‘spike’ your blood glucose as much, they will elevate your glucose and insulin the longest, leading to fat gain.
In our Macros Masterclass, we guide our Optimisers to reduce their carbohydrates if their glucose rises above the healthy range. Then, once they’ve got their carbohydrates dialled in, we advise them to find foods and recipes they enjoy eating that allow them to dial back dietary fat to lose body fat and improve their metabolic health.
Summary
- The Glycemic Index measures how much a food raises blood glucose two hours after eating. However, the Glycemic Index data tends to be limited to higher-carbohydrate foods.
- Using multivariate regression analysis, we found that carbohydrates have the most significant impact on glucose, fat plays a minor role, and fibre reduces the effects of carbohydrates.
- The coefficients from the regression analysis allow us to estimate the Glycemic Index and Glucose Score of any food or meal.
- Foods and meals with a lower Glycemic Index and Glucose Score that contain more protein also tend to provide more nutrients per calorie (i.e., nutrient density) and, thus, greater satiety. Therefore, these nutritious foods and meals would be more optimal for weight loss than higher-fat options.
More
- Making Sense of the Food Insulin Index
- The Most Satiating Foods to Crush Your Hunger
- Does Protein Spike Insulin (and Does It Matter)?
- How to Optimise Type-1 Diabetes Management (Without Losing Your Mind)
- What Is the Optimal Blood Sugar Level for Weight Loss and Fat Burning?
- NutriBooster Recipes
- Macros Masterclass
Thank you for summarizing great info
thanks for checking it out Hakan. glad you enjoyed it!
The information is compelling, and helpful and easy to understand.
so glad to hear you found it helpful.
Very good article.
thank you!
WOW.. So interesting. I’m determined not to take chronic meds for diabetes. I believe in a healthy eating to maintain my sugar levels.
Thank you
Rene
thanks Rene. glad you found it useful.
I would like to say blood sugar index I;e should be taken care of region wise,hight,weight,age,and there style of living in that particular part of area.It needs more systematic analysis.Thanks for your above article which gave some in-depth knowledge about food quality.Still the question remains unanswered of your wife.What should be blood sugar range of FBS,PPBS,and RBS.Thank you very much for sharing this article.Every doctor should read this article,and accordingly prescribe there medicine with a diet chart.
how would you consider it based on region (i.e. based on different foods available)? this data only really gives us an insight into post-meal blood sugars. fasting blood sugar and insulin levels is largely related to the amount of body fat you are holding onto.
Thanks for this, it’s a good information, and instruction for help. God bless you
thank you!
Sir. I appreciate you good medical statement and address regarding blood sugar and Insulin. Many thanks Sir.
thanks Rosendo!
Great insight and in a simple language to understand complex subject.
trying my best to unpack it all in a way that I can understand.
I disagree that adding fat to a carbohydrate meal will rise glucose further than carbohydrates alone. The fat will actually prevent a higher spike but will keep sugar elevated for longer time.
combining fat and carbs has been advocated to help people stabilise blood sugar. sadly, it actually tends to lead to lower satiety and greater energy intake and thus higher insulin levels. fat has a smaller impact on blood sugar and insulin in the short term, but appears to keep blood sugars and insulin elevated for longer before the body needs to draw down on your stored energy again.
very informative ,it will help to educate my obese diabetic patients.
awesome. exciting to hear!
I just finished reading the whole article.
I’ve been a diabetic for over 15years and I couldn’t make any sense out of what I just read.
Why don’t we have a simple way to explain what foods cause high sugar levels and what foods to keep it level.
I’m 62 a woman with out of control Diabetes.
All doctors,want to do is give me more tablets more Insulin Im just about ready to chuck all medication in the bin as I’m more sick now with taking all these drugs then when I started them.
if you look at the charts in the article, you want to stick towards the foods towards the bottom right that will stabilise your blood sugars and insulin while also providing the nutrients you need. if you’re still confused, the recipe books may be helpful. we created them as the basic starting place for everyone to keep it really simple.
Live with diabetes for,50 years then you can say what to eat and what not to eat p
there will definitely be an element of individuality based on a whole range of factors such as insulin resistance and your ability to produce insulin. this data gives us a starting place to understand what works for most people most of the time. from there, it’s definitely good to test and see how your body responds to different foods.
Good information. But I believe that leafly vegetables and green beans are good with GI and absolutely no starchy vegetables. Need more information on veggies that can be taken.
This article didn’t really cover the GI data. You should test your blood sugars before and after a meal of beans vs other foods. I’m a big fan of leafy greens as they are nutrient dense and most people can’t eat enough of them to raise their BGs significantly.
Excellent please keep posting updated research findings….
Thanks so much!
Very educative
thanks Daniel!
Nice article it helps to maintain my blood sugar levels after food
Cheers. Glad you found it useful!
Wow! Great! Need more information presented this way, very well thought out. But what’s up with celery? Boo-hiss!
thanks. sorry about celery. the key thing to keep in mind here is that this is based on glucose and insulin response per calorie. you will need to eat a massive quantity of celery to get much of a response.
I need some suggestions. I am 60 lbs overweight. When I wake up in am, I have a cup of coffee with cream and sugar. I feel fine. I have no appetite in the am, so I don’t eat anything until 4-5 hours later. However, during this 4-5 hour period, since I’m in Texas and this summer has been very hot (100+), I will consume a lot of lemonade and sweet iced tea. When I start to feel hungry, I will eat typically eat half a sandwich, either ham and cheese or peanut butter and jelly. Within about 30 minutes, I am absolutely exhausted with brain fog. I feel the need to sleep. Yesterday when this happened I laid in bed and ate a banana. After an hour I felt better. After two hours I felt even better and after three hours I felt normal. Sometimes a similar thing happens after dinner. I sometimes will push through exhaustion just to clean up the dishes, but by the time I do go to bed, I feel much better. What the heck is going on? High blood sugar or low blood sugar? I do have the Hashimoto thyroid problem and I take a 2-grain (130mg) Nature-throid each day. I have experimented taking this in the am and at bedtime, but cannot tell a difference.
your symptoms sound like you may have elevated blood sugars. suggest you pick up a simple blood sugar meter and check your sugars. if your blood sugars are rising more than 30 mg/dL after meals then the lower insulin load foods and recipes in this article will help stabilise your blood sugars. once your blood sugars start to stabilise you can use the meter to guide your meal timing, delaying your meal until after your blood sugars return to below your baseline. check https://www.datadrivenfasting.com for more details on our Data-Driven Fasting system.
Hi Marty,
Thanks for the valuable info.
Just wanted to know if we could get similar values of Food Insulin Index and Nutrient Density for food items like Wheat, Pulses and Grains.
Thanks
the tables in this article based on the most popular foods used by Optimisers which often don’t include those foods. you could calculate it using the formula at the bottom of the table, but it’s likely to be fairly high because the starch content is high. definitely worth testing your blood sugars before and after to see how you respond to those foods vs other foods. you can also check out our food search function here https://nutrientoptimiser.com/search/ which includes the % insulinogenic calories. for example:
https://nutrientoptimiser.com/nutritional-value-wheat-sprouted
https://nutrientoptimiser.com/nutritional-value-soybeans-mature-seeds-sprouted-raw
Excellent research and analysis. By measuring my sugar levels twice daily, I have learned what foods and their quantity I can consume to obtain my sugar levels. This, of course, includes the effect of daily exercise and drinking lots of water.
My goal as a type 2 diabetic is to someday eliminate my daily consumption of acarbose and glipizide, of course with my doctor’s approval. I plan to ask him about intermittent fasting. What are your thoughts on fasting?
Thanks again. I’m sure your research will help many people learn to maintain a healthier food consumption life style.
thanks Tony! I have some reservations about popular fasting. However, I’m a fan of intermittent fasting. you can use your blood sugar before you eat as a nice little fuel gauge to guide meal timing. you may be interested in our Data Driven Fasting system here https://optimisingnutrition.com/data-driven-fasting/
Tony, it is my experience that decreasing oral type2 medications is a fairly long and complicated process. I could not have succeeded in doing that without a continuous blood glucose monitor (Abbott FreeStyle Libre II) You will probably have to pay for it yourself, as the monitors are generally only prescribed for type 1 diabetics at this time. Additionally, I was also dealing with moderate non-alcoholic fatty liver. Doctors do not have a great metric for monitoring fatty liver improvement. I was also dealing with severe insulin resistance. There was no practical for getting at insulin levels. C-Peptide test seems to be coming into it’s own for judging insulin resistance. Lastly, check out these YouTube presenters. Dr. Ken Berry and Dr. Jason Fung Based on my experience it will take 50 hours of viewing such videos to get a handle on the complicated mess of Type2 diabetes, insulin resistance, and fatty liver. I feel intermittent fasting in combo with constant blood glucose monitoring were the keys to me getting ahead of my problems.
How much does low Hemoglobin levels distort these results? Or in other words what is the correlation of Hemoglobin levels to Blood sugar levels?
Do you mean your HbA1c? It’s a measure of the average of your blood sugar over the last three months. Your blood sugar after meals is related to what you eat while your blood sugar across the rest of the day will depend on how often and how much you eat.
here’s a tool to convert average blood sugar to HbA1c.
I appreciate your information thank you
I appreciate your feedback. Thank you.
Why do you make no distinction between the types of diabetes? Is it somehow your belief that every person with type 2 with partial responses from partial functioning pancreas (or possibly other insulin resistance based issues) reacts ‘like your wife’ making her the yardstick?
And type 2 who have no response, no pancreatic function…with essentially a totally different disease…we react the same as well?
You have a lot to say…a lot of opinions…and seemingly a lot of assumptions…but lumping diabetics all together is a mistake… maybe one you are aware of…maybe you are dumbing down your explanations… I’ll give you the benefit of doubt here. However many with diabetes don’t even understand differences…it’s a huge disservice when general topic discussions and articles treat type 1 and type 2 as the same disease. There are multiple types of type 2… and TOTALLY different issues for type 1… they are only grouped together due to similar outcomes…similar ways they present… but differences between diabetic types are great. Not to be swept aside by calling everyone a diabetic… not when talking about what food (as an input to the system) does to the body!
This article really just focuses on the food, not the mechanism.
Both T1D and T2D is a condition of relative insulin insufficiency.
People with T1D can’t produce as much insulin as everyone else. People with T2D often produce much more insulin than everyone else, but because they are trying to hold more energy in storage than their body can comfortably handle, they see the stored energy overflow into their bloodstream.
The blood sugar response to protein for both T1D and T2D is actually quite similar, with a rise in blood sugars after eating.
For both T1 and T2 it makes sense to reduce refined carbohydrates to the point that blood sugars stabilise to healthy non-diabetic levels.
Adequate dietary protein is important for both conditions but especially T2D to improve satiety and help reduce body fat until they return below their Personal Fat Threshold.
You may also be interested in these articles.
https://optimisingnutrition.com/ted-naimans-dam-fat-storage-insulinographic-explained/
https://optimisingnutrition.com/how-to-reverse-type-2-diabetes/
I believe that your response does not give proper weight to sever insulin resistance, something that can develop over 10 years or more, even while fasting blood glucose levels are normal. I believe in the next 10 years insulin resistance will be re named to insulin toxicity.
I’m hoping we skip ‘insulin toxicity’ and move straight to ‘energy toxicity’, which is a much better description of the root cause.
I think what you are describing is often termed ‘double diabetes’ where people with T2D can find their pancreas effectively burns out and can no longer produce insulin. Conversely, people with T1D can become obese and insulin resistant.
sorry…my paragraph started with “And type 2 who have no response…”
Should read…
And Type1 who have no response, no pancreatic function…with essentially a totally different disease…we react the same as well?
If you have a relative insulin insufficiency, you will see a similar blood sugar response, regardless of whether you are T1D or T2D. But the good news is you can reverse T2D with intelligent dietary choices.
Thought provoking, again, thank you.
I am getting interested in this basal long term insulin, and also the development in insulin after 2h aka 120m. Late Dr. Kraft did not only measure insulin reactions, he studied them until 5 h. We know the different patterns representing unbalanced insulin reaction, which still hammeres down glucose (and lipids, I presume). All “broken” patterns are longer in duration with higher peak, but not necessarily the first rise gradient is still strong.
This hints that they have “natural” overdosing problen, similar to your description of bolus amount vs. junk food. There is too much insulin, for too long, all day long if you follow the “healthy” snacking advice. Since visceral fat has more insulin reseptors (3-4 fold) than skin fat, sounds like packing energy into stomach even if there is no treshold difference inbetween these differerent adipose depots. Winding back, the fat moves very quickly away from the liver and viscera, if you totally fast, cut the carbs, or take those liquid diets of 800 kcal (with 50% carbs). In this order, speed directly proportional to reduced carbs.
Is this a question? More like deduced statement, feel anybody free to guide me to correct path…
JR
Kraft is interesting. But I think wasit:height will give you a lot of the same information with a lot less hassle. Data Driven FAsting uses premeal blood sugars to guide you to wait to ensure an energy defiit until you achieve more optimal waking blood sugars.
The problem most medical providers still use BMI as their metric.
yes. waist:height or body fat is much more useful as it doesn’t penalise you for gaining lean muscle (which is just as important as having less body fat).
Hi Marty,
Thank you for a prodigious effort and analysis!
My query is about the graph B GC vs LF and HF meals – was the amount of protein in these diets equivalent in terms of bioavailability to ensure that protein did not influence the difference between the bsl graphs?
Bioavailability may have a small impact but protein only has a negligible impact on blood glucose. So the overall impact of protein on glucose for LC vs LF food sources will be pretty much zero.
Black tea and espresso being high up the chart is a bit confusing, if you would consume 239 kcals of those it means you drank lethal amounts right? Shouldn’t there be some minimal kcal-from-carbs-per-100ml threshold to weed them out?
Agree. Good point. I’ve removed the lower calorie beverages from the chart.