
Dive into the intricacies of the Acceptable Macronutrient Distribution Range (AMDR) for protein, established by health authorities, and its relevance in today’s dietary landscape.
This data-driven review sheds light on current protein recommendations against the backdrop of emerging dietary trends, aiming to equip you with the knowledge to tailor your protein intake to your individual health goals.
Explore the AMDR for protein and discover how it contrasts with personal dietary goals, with a particular focus on the relationship between satiety and nutrient density.
- Background
- What Are the Acceptable Macronutrient Distribution Ranges (AMDR)?
- What Is the AMDR for Protein?
- How Was the AMDR for Protein Determined?
- AMDR Shortcomings
- What Is the Optimal Protein Intake?
- Nutrient Density of High vs Low Protein % Diets
- The Optimal and Ideal Protein Intake
- Can You Overeat Protein?
- Will I Gain More Muscle if I Eat More Protein?
- What Happens to the Excess Protein You Eat?
- What About Rabbit Starvation?
- How Has Protein Changed Over the Years?
- How Much Protein Do You Need to Lose Weight?
- Should I Eat More or Less Protein If I Have Diabetes?
- How Does Protein Need Change as We Age?
- What Factors Influence Protein Intake?
- Summary
Background
In the early 2000s, the Food and Nutrition Board of the Institute of Medicine (IOM) set the ‘Acceptable Macronutrient Distribution Ranges’ (AMDRs) based on ‘the assessment of diets eaten by healthy people’.
Considering a growing majority of people are overweight and not metabolically healthy, there’s been plenty of disagreement and discussion as to whether these targets are suitable.
The Acceptable Macronutrient Distribution Range for protein is 10 to 35% of calories. This is accompanied by a recommended minimum daily protein intake (RDA) of 46 g of protein per day for women and 56 g for men.
Many people have been successful with diets such as the Protein Sparing Modified Fast, which cranks up protein to 50% or more of total calories. So, what gives?
To clarify, this article compares the official AMDR for protein vs the protein intakes that align with maximum satiety and nutrient density and explains some of the discrepancies.
The understanding you will gain will empower you to cut through the confusion and identify the ideal protein intake that aligns with your goals, context, and preferences.
What Are the Acceptable Macronutrient Distribution Ranges (AMDR)?
According to the Food and Nutrition Board: Institute of Medicine, an Acceptable Macronutrient Range or AMDR is defined as ‘a range of intakes for a particular energy source that is associated with reduced risk of chronic diseases while providing adequate intakes of essential nutrients.’ Keep those bolded phrases in mind for later.
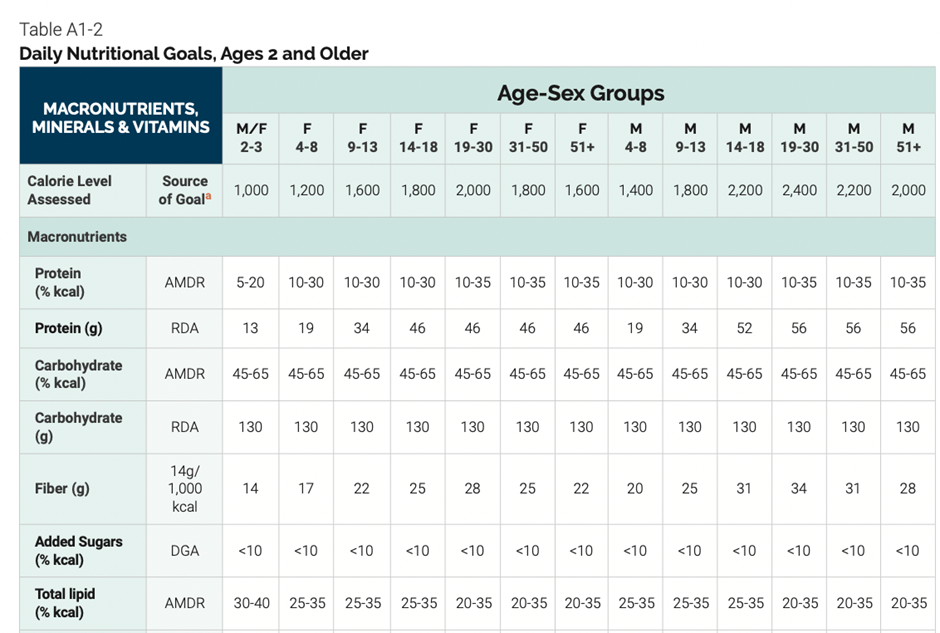
The chart below shows the recommended protein, fat, and carbohydrate intakes based on age for men and women from the 2020-2025 Dietary Guidelines for Americans.
What Is the AMDR for Protein?
The following table summarises the macronutrient target ranges, or the Acceptable Macronutrient Distribution Ranges, recommended in the guidelines.
| Macro | Min | Max | RDA |
| Protein | 10% | 35% | F – 46 g M – 56 g |
| Fat | 20% | 35% | – |
| Carb | 45% | 65% | 130 g |
These AMDRs are the amounts of protein, fats, and carbs deemed appropriate for healthy populations. However, it’s worth noting that a recent study from Tufts University found that only 7% of the US adult population is metabolically healthy, with many suffering from diabetes and obesity.
Interestingly, modern diseases like diabetes, cancer, metabolic syndrome, autoimmunity, and dementia all stem from poor metabolic health and obesity. With that said, our discussion of the AMDR for protein considers satiety and blood glucose control. We will also use our nutrient density analysis to drill more deeply into nutrient adequacy at varying protein intakes.
How Was the AMDR for Protein Determined?
The Food and Nutrition Board of the Institute of Medicine determined the AMDR for protein based on various considerations, which we’ve summarised below.
The lowest protein intake (10% of total calories) was set to avoid deficiency-related diseases. A low protein intake is known to impair immune function, stunt growth, and lead to low birth weight.
While protein malnutrition is uncommon in developed nations, protein insufficiency and energy deficiency are responsible for more than half the deaths of young children worldwide.
While 10% protein has been set as an absolute minimum to avoid disease, it is by no means optimal. Additionally, dietary modelling has shown that it is difficult to obtain adequate micronutrients without overconsuming excess energy on such a low-protein diet.
‘High’ protein intakes exceeding the AMDR for protein have been investigated to establish whether they correlate with chronic diseases, including cancer, renal disease, obesity, coronary artery disease, and osteoporosis. However, the evidence is not convincing.
There is no published evidence that a diet containing as much as 2.8 g protein/kg/day produces any adverse effects on the kidneys in athletes. In addition, while a common concern and question, there is no known association between protein intake and progressive renal insufficiency to date. Any health implication stemming from ‘excess protein’ has been shown to be a pre-existing condition.
In Western populations, the average protein intake doesn’t typically exceed 25% of total calories. Higher protein intakes are limited to populations in the Arctic regions, pastoralists, and hunter-gatherer groups—subsets of humans left to eat at the will of nature and how we evolved.
In light of the lack of consistent data on the effects protein has on chronic disease, the upper-level AMDR for protein was set ‘to complement the AMDR for fat and carbohydrate’. Hence, we ended up with an upper limit of 35% energy from protein.
These reference ranges have not been used in controlled and monitored studies to see if they improved people’s health.
Instead, the AMDR for protein was established based on the protein intakes healthier people were seen to be consuming and which intakes would, for sure, cause diseases of deficiency. It did nothing to investigate the optimal amounts of protein that improved health in varying populations (i.e., athletes, people with obesity or the elderly) or even people in general.
From diabetes to cancer, obesity, and neurodegeneration, many modern diseases stem from poor metabolic health and obesity. Hence, our discussion of the AMDR for protein will consider quantities of this macronutrient that improve satiety and blood glucose control.
We know from our in-depth satiety analysis that a greater nutrient density is associated with a higher degree of satiety. When someone feels more satiated, they are not only less prone to overeating energy-dense foods but can keep their appetite under control.
Keeping our goal of nutrient adequacy front and centre, we will use our nutrient density analysis to drill into what protein percentage optimises nutrient intake and aligns with the greatest nutrient density and satiety.
AMDR Shortcomings
While the AMDRs are intended to guide us to eat like healthier people, they have quite a few shortcomings worth noting.
The AMDRs were based on associations between clinical endpoints like coronary heart disease, diabetes, cancer, and obesity that appeared to point to trends rather than distinct endpoints.
Because factors other than diet contribute to chronic illness, it is impossible to determine a defined intake level at which chronic disease may develop or be prevented. The mainstream mantra of ‘correlation does not equal causation’ holds true here.
Additionally, while the institution developing the AMDRs simply looked at the association between populations currently free of chronic disease and what they eat, it neglected to examine which ways of eating contribute to these illnesses. In other words, it would make sense to determine dietary habits that led to disease and avoid them, right?
Despite looking at associations between disease and diet, the AMDRs don’t seem to have considered the relationship between macronutrient trends that coincide with obesity and metabolic disorders.
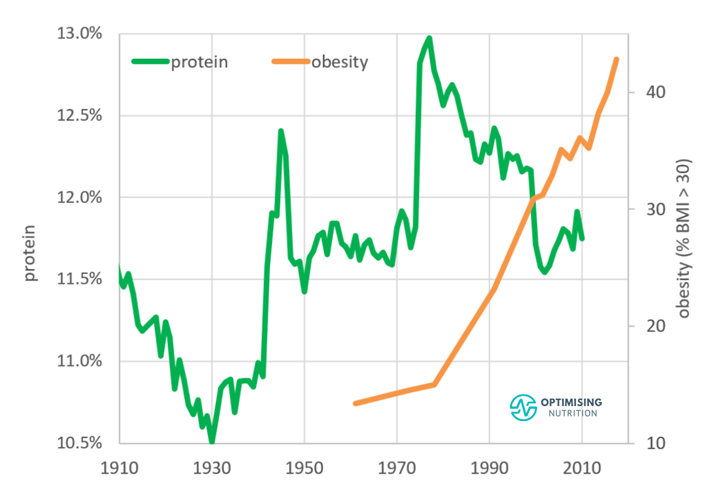
Based on data released by the United States Department of Agriculture (USDA) Economic Research Service, increasing obesity rates have more than coincided with our decreased protein intake since around the time that the first Dietary Guidelines for Americans was published in 1977.
Unfortunately, the guidelines were not based on how humans ate in their natural environment before we created ultra-processed foods. Instead, these guidelines were developed using processed foods abundant in our modern, high-calorie, high-carb food environment.
Many people argue that the guidelines are biased towards the interests of Big Food, as there is a greater focus on more carbs and seed oils and less protein and animal fat.
Unfortunately, the AMDRs recommend a range of total calories from protein that is fairly wide, at 10-35%. But there isn’t much detail on where we should aim for within that range, depending on our context and goals. Do we need more if we’re healing? Sick? Elderly? Going for performance? Overweight? Underweight? There is no direction.
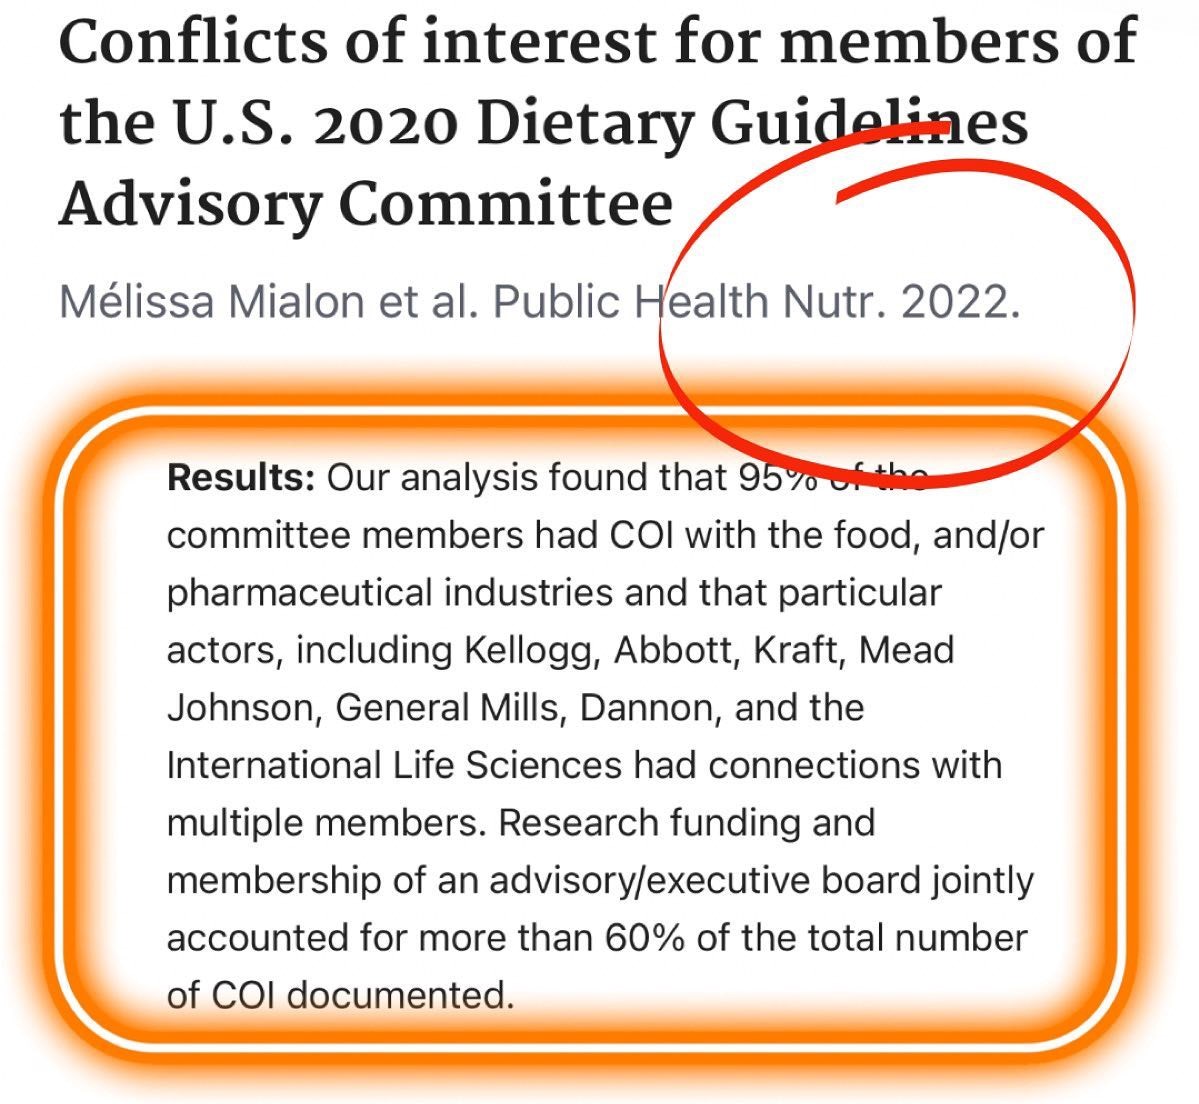
Finally, and perhaps most concerningly, a recently published review found that 95% of the US Dept of Agriculture Dietary Guidelines Advisory Committee members had conflicts of interest.
All in all, the AMDRs seem to have a lot of flaws. After nearly twenty years of use, it might be time to update or retire these guidelines!
What Is the Optimal Protein Intake?
With such a lengthy explanation as to why these guidelines aren’t so optimal, you might be wondering if there’s an optimal protein intake with any research behind it.
To provide some clarity, our optimal protein intake was derived from our analysis of 125,761 days of food intake data collected from 34,519 Nutrient Optimiser users over the past four years.
Many people have used Nutrient Optimiser to analyse the nutrient profile of their diet for just a few days, and we have three years’ worth of data from nearly three thousand Optimisers who have participated in our four-week Macros Masterclass and Micros Masterclass.
On average, we have eighteen days of food logging data per person, giving us a sizable dataset that represents a wide range of macronutrient intakes and diet styles from all over the world.
Satiety
As the following protein % vs calorie intake chart shows, people consuming a higher percentage of their total calories from protein (protein %) tend to consume fewer calories. Those with the highest protein % consume 55% fewer calories than those with the lowest protein %.
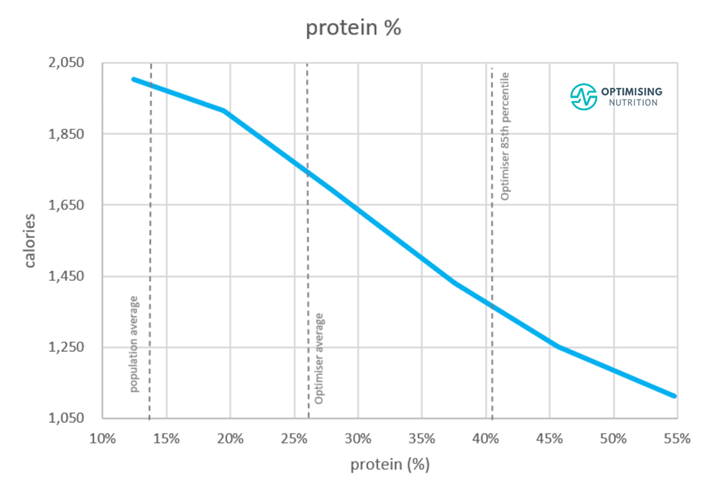
We can see that the lower end of the AMDR (10%) for protein aligns with the highest calorie intake. To put things into perspective, the average population protein intake is 11.7%.
In contrast, the upper end of the AMDR for protein (35%) aligns with greater satiety. However, an even greater protein % aligns with an even lower calorie intake. If someone felt fuller eating fewer calories, this might allow them to restrict their food intake so they could lose weight and reverse or minimise their disease.
The chart below shows the Optimiser data plotted across the net-carb vs fat landscape for completeness. The red areas represent the days with the highest calorie intake, while the blue areas represent the lowest.

We can see that the highest calorie intake generally lies along the diagonal edge, representing a low-protein diet with a generous mixture of carbs and fat (i.e., ultra-processed foods with a low protein %). Conversely, the lowest calorie intake generally lies in the bottom left corner, where fat and net fibre carbs are low, and the protein % is high.
The following chart shows the protein % distribution amongst our Optimiser data. Our Optimisers consume 30% of their total calories from protein on average. However, there is a wide range of protein intakes.

To the left of the chart, we see very few Optimisers consuming less than 10% protein. In contrast, a diet with a higher protein % shown towards the right is also hard to maintain.
Once we obtain adequate protein, our protein cravings quickly decrease, and our cravings for extra energy from carbohydrates and fat promptly increase.
We have a strong appetite for protein. Thus, most people eat until they get the protein their bodies require, and they gravitate to the best protein intake.
The increased satiety response from diets with a higher protein percentage aligns with the Protein Leverage Hypothesis, which isn’t unique to humans. From slime to apes to humans, our satiety is dictated by our bodies’ protein demands.
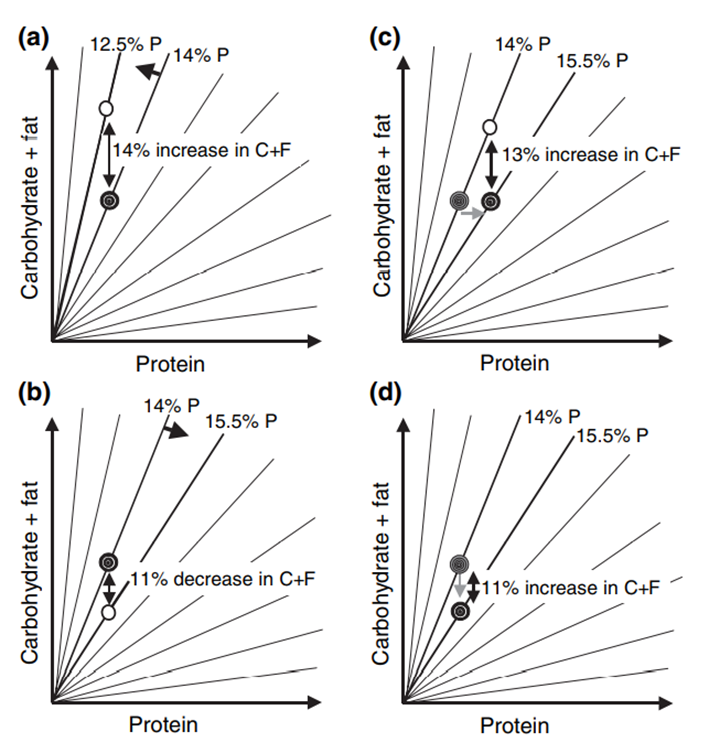
The chart below shows the results of human experiments compiled by Professors Raubenheimer and Simpson.
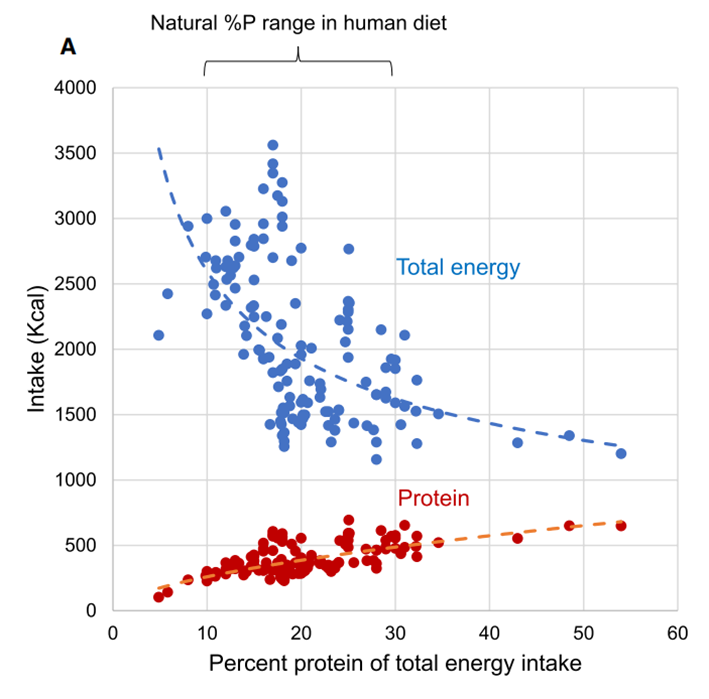
We see that a higher protein % aligns with a marginal increase in absolute protein intake and a substantial reduction in overall calorie intake.
Before we continue, it’s important to acknowledge that greater satiety aligns with a higher percentage of protein—not simply eating more protein. In other words, a more significant percentage of your total calories must come from protein.
Hence, prioritising protein while progressively reducing energy from fat and non-fibre carbohydrates is the key to increasing satiety.
Diet Quality
As noted above, ensuring you’re consuming adequate amounts of every essential micronutrient is (supposedly) a critical target of the AMDRs. To understand the relationship between protein % and nutrient density, the following chart shows protein vs diet quality.

Nutrient Density of High vs Low Protein % Diets
Diet quality tends to increase until around 50% of our total calories come from protein. A diet with more than 50% protein tends to exclude non-starchy vegetables, which provide many essential vitamins and minerals. It also provides less fat, so omega-3 also drops.
Although increasing protein above 50% protein may provide greater satiety per calorie, obtaining all the essential nutrients becomes even more challenging.
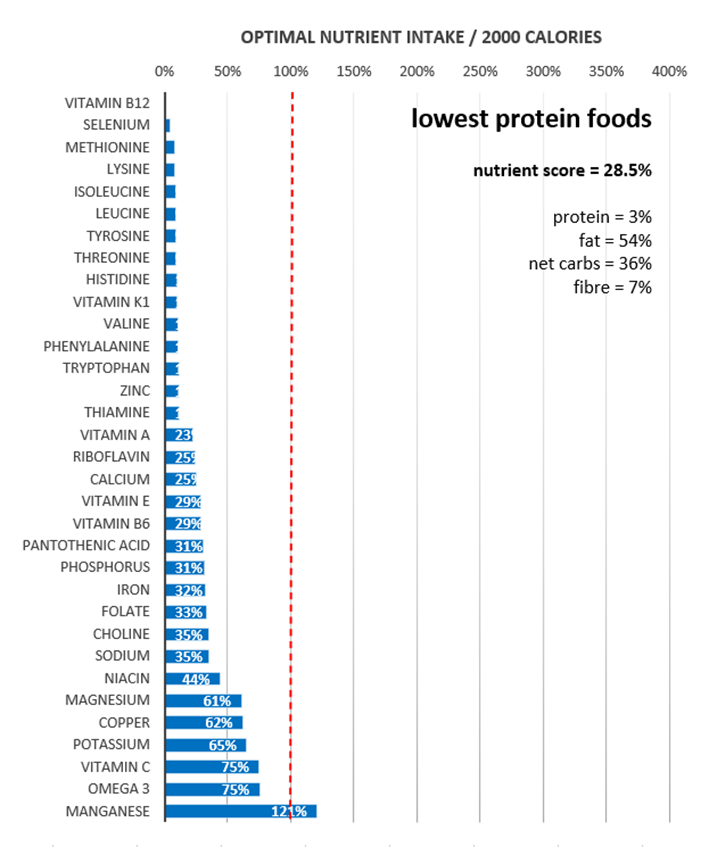
The micronutrient fingerprint chart below shows the nutrient profile of the lowest-protein foods. At the top of the chart, we see that it’s tough to obtain vitamin B12, selenium, and all the amino acids.
The highest-protein foods shown in the following chart provide a more robust micronutrient profile. However, consuming nutrients like vitamin E, omega-3 fatty acids, vitamin C, magnesium, calcium, and vitamin A can still be challenging. This is because focusing purely on high-protein foods tends to squeeze our non-starchy vegetables, which can provide complementary micronutrients.
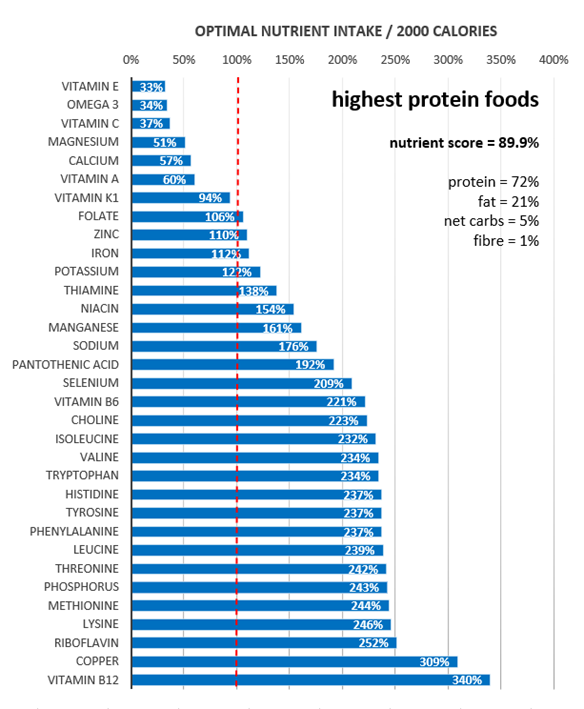
But when we prioritise maximum nutrient density, we not only get plenty of protein, but we also see a much better micronutrient profile all around.

The chart below shows non-fibre carbohydrates vs fat vs diet quality for completeness. The blue areas along the diagonal edge correspond with low protein ultra-processed foods with the lowest nutrient density.
But, as we saw above, this dangerous diagonal edge also corresponds to the highest calorie intake. The red areas towards the bottom left corner represent the highest nutrient density, corresponding to the lowest calorie intake.

The Optimal and Ideal Protein Intake
Our analysis shows that the optimal protein intake is approximately 50%. This percentage optimises satiety per calorie and nutrient density.
Although a higher protein % may be optimal, it may not be ideal for several reasons. First and foremost, it is more challenging to consume all micronutrients, as we explained above.
Secondly, moving from the average 12% protein intake to the optimal 50% protein intake overnight isn’t sustainable—let alone doable—for most people. Thus, it’s critical to consider your context and goals.
- Most people consume a diet with adequate protein (in grams), but someone lean and (or) very active may require more energy from fat and carbs. This decreases protein %.
- Someone who is obese and wants to lose weight quickly may be tempted to jump from a low protein % to a very high protein %. However, it’s always better to progressively dial back fat and non-fibre carbohydrates while prioritising protein to avoid shocking the body. Rebound binges from going ‘too hard too fast’ are not unlikely, and they can be discouraging for many.
In our Macros Masterclass, we guide Optimisers through identifying their current macro intake and progressively dialling in their macros to more optimal ratios that align with their goals more ideally.
People experience better long-term success when they progressively tweak their diet rather than jumping to unsustainable extremes. Acclimation is key; otherwise, you’ll go into shock!
Sustainable, long-term success is always better than rapid weight loss that’s followed by a quick rebound once the diet is over. The tortoise and the hare analogy holds true! If you’re losing weight at between 0.5 and 1.0% per week, this is a sustainable rate of weight loss, and there is no need to change your macro targets.
If you lose weight quicker than 1.0% per week during our Macros Masterclass or while using Nutrient Optimiser, our software will increase your energy target to prevent rebounds. However, if you aren’t losing at least 0.5% per week, the Smart Macros algorithm will reduce energy from carbs and fat, so your protein % will increase.
Over time, protein % will gradually increase to ensure you continue losing weight. Later, once you achieve your goal or just want to take a break to practice maintaining your weight, you can increase energy from extra energy (fat and carbs) while maintaining adequate protein.
If you’re interested in digging deeper, the following sections review the AMDR for protein further.
Can You Overeat Protein?
Overconsuming any macronutrient to where you exceed your energy requirements will lead to undesirable growth, elevated insulin levels, obesity, metabolic syndrome, diabetes, and any related condition over time. Therefore, it’s crucial to differentiate between absolute protein intake (in grams) and protein %, or the percentage of total calories from protein.
With that said, a study in athletes consuming 4.4g/kg BW/day of protein—which is 5.5 times the RDA—showed no adverse effects in terms of weight gain. Despite consuming 307 grams of protein powder per day (1228 calories!), mainly from protein powders, which amounted to an extra eight hundred calories per day, participants did not gain weight. Instead, they lost body fat and gained lean mass!
The main issues observed in the study were the high drop-out rates (because it’s incredibly hard to overeat protein) and the increased body temperature due to the higher dietary-induced thermogenesis of protein compared to fat and carbs.
Although they used protein powders in this extreme example, you should prioritise protein from whole-food sources as they will provide more nutrients and greater satiety if your goal is to lose weight. This is because protein powders are effectively pre-digested, which means they are metabolised more quickly in your body. They also do not contain as many vitamins, minerals, or fatty acids, which also play a role in satiety.
Protein typically comes packaged with fat, so it’s vital to ensure you’re not simply increasing the intake of mainstream high-protein foods if your goal is weight loss.
The chart below shows that a greater protein intake (in grams) aligns with a higher calorie intake.
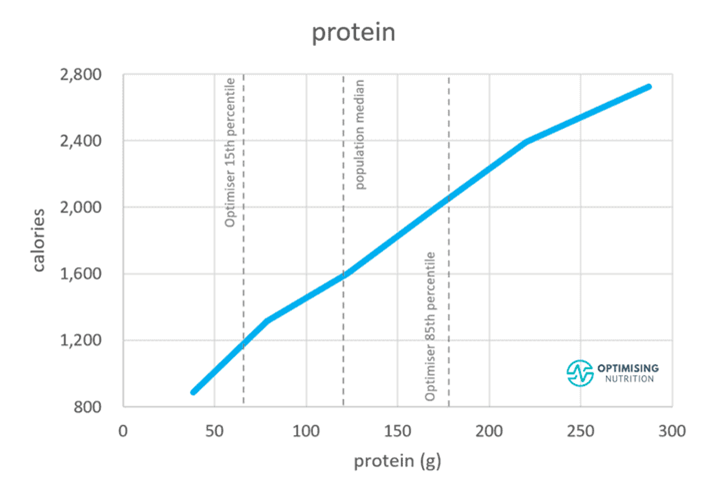
Increasing your consumption of butter, bacon, and nuts beyond your energy requirement will not lead to a higher protein %, greater satiety, or weight loss; it will just make you fatter!
The following chart shows that an increased protein % aligns with only a moderate increase in absolute protein intake (in grams). However, it coincides with a much more significant reduction in energy from fat and (or) carbohydrates.
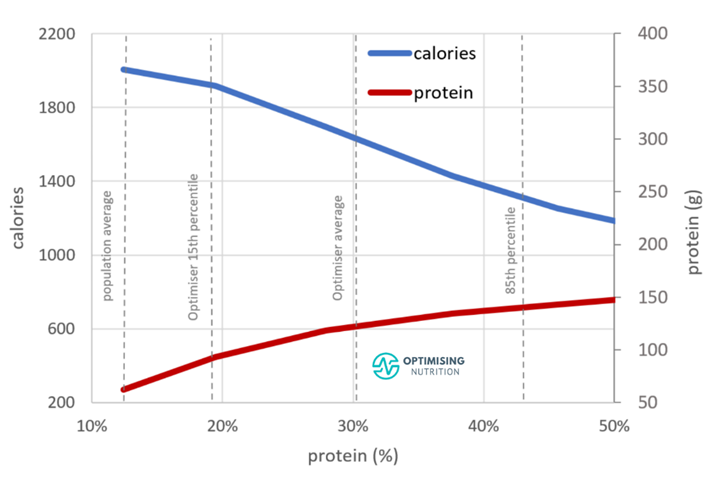
If your goal is fat loss, you should identify where you’re currently and progressively move to the right on this chart.
It doesn’t take a large shift in protein % to drive a significant calorie reduction! This is what we walk our Optimisers through in our four-week Macros Masterclass.
Will I Gain More Muscle if I Eat More Protein?
Eating enough protein facilitates muscle growth when combined with resistance training. But it won’t necessarily make your muscles grow. Less active people crave less protein because their bodies aren’t using it. A recent meta-analysis found that 1.5 g/kg body weight per day was adequate to maximise muscle growth with resistance training.
But if your goal is to lose weight, the benefit comes from the increased protein %. This involves dialling back energy from fat and carbs while prioritising protein. This tends to increase satiety, meaning you will be less hungry with fewer calories, preserve your lean mass (muscle) and maximise the amount of fat loss.
In our Macros Masterclass, Optimisers achieve the most sustainable results when they work up to 40% of their total calories from protein. Pushing much higher than this can lead to cravings for energy and rebound binging.
What Happens to the Excess Protein You Eat?
Excess protein not used for muscle protein synthesis, neurotransmitter and hormone production, or all the other beneficial functions in your body is oxidised.
While it’s possible for protein to be stored as fat, it’s unlikely because it’s difficult for your body to do. Amino acids must first be converted to glucose (via gluconeogenesis) and then to fat (via de novo lipogenesis), both of which are energetically expensive processes.
Because fat is last in line to be used for energy and we have plenty of room to store it, it’s often the excess fat that is easily stored on your body if you’re eating more than you need to. For more on this, check out Oxidative Priority: The Key to Unlocking Your Fat Stores.
Because protein has much higher dietary-induced thermogenesis than fat and carbs, more energy is ‘lost’, converting it into usable energy (ATP), which will keep your body temperature and metabolic rate higher. It will also reduce the amount of energy you’re left with, as 10-35% of the energy you consume from protein is lost in this conversion.
People who intentionally try to overeat protein often find themselves with ‘the meat sweats’ – they get physically hot because their body is working so hard to metabolise the protein. Conversely, people who try to restrict calories with a lower protein % diet often feel cold, lethargic and depressed.
For more on this, check out Oxidative Priority: The Key to Unlocking Your Fat Stores.
What About Rabbit Starvation?
Some people talk about ‘rabbit starvation’, which occurs when very lean people only have very lean protein sources—like rabbit meat, hence the name—available for extended periods.
We can’t survive forever on lean protein alone, and we need to get our energy from somewhere else, like carbs or fat.
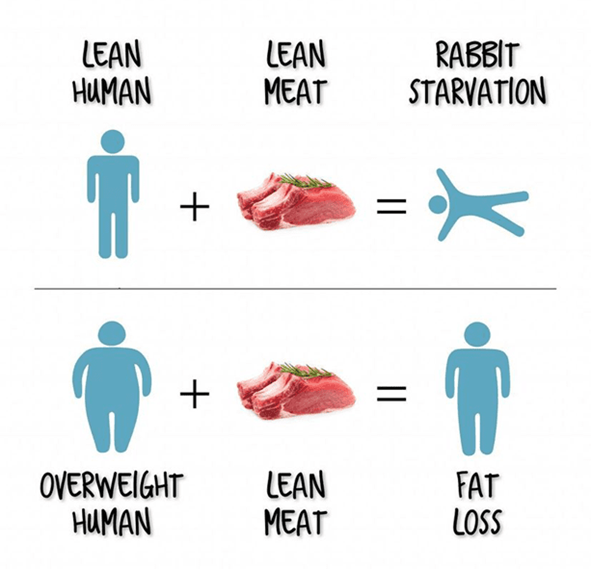
However, most of us have access to cheap foods and carry far more energy than we need as fat. Thus, there is little risk of overeating lean protein and starving to death in our modern environment!
Although a diet with a very high protein % is more satiating on a calorie-for-calorie basis, it can still lead to excessive hunger that’s hard to maintain.
So, to reiterate, it’s essential to incrementally dial back energy from fat and carbs and increase your protein % slowly rather than jumping in headfirst from one extreme to another overnight, as we do in our Macros Masterclass!
How Has Protein Changed Over the Years?
We created the chart below using data from the USDA Economic Research Service.

Here, we can see the average protein % of the US reached a low during the Great Depression in the 1930s and rose before decreasing again from 13% to 11.5% since the introduction of the 1977 US Dietary Goals for Americans.
While this change may not seem significant, Raubenheimer and Simpson explain in their initial paper, Obesity: The Protein Leverage Hypothesis, that small decreases in protein % lead to sizable increases in fat or carbohydrate intake to maintain adequate protein.
How Much Protein Do You Need to Lose Weight?
So far, we’ve mainly talked about protein %. But as with all nutrients, we need a minimum amount to survive. Thus, it’s often helpful to consider protein in grams per kilo of body weight or per kilo of lean body mass.
While the Dietary Guidelines have identified a minimum protein intake of 0.8 g/kg body weight to prevent diseases of protein malnutrition, more protein above this minimum intake is often beneficial.
As the chart below shows, we see a wide range of protein intakes in our Optimiser data, with a median intake of 2.4 g/kg lean body mass (LBM).
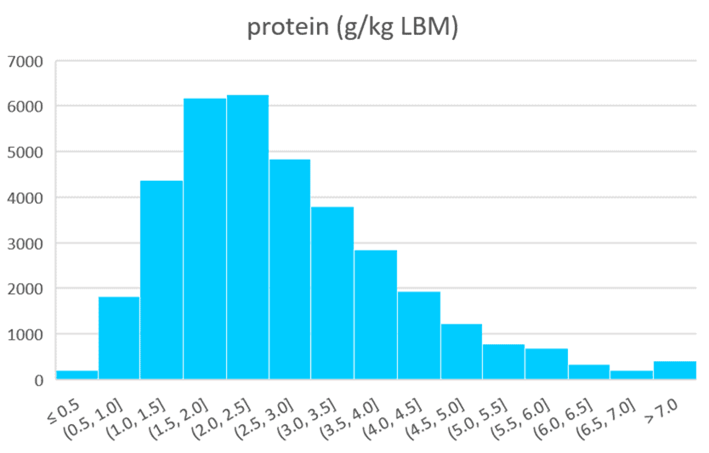
It can be challenging to consume this much protein while still achieving a consistent calorie deficit if your goal is weight loss. Although it’s desirable to get at least 1.8 g/kg LBM, we usually suggest working up to 1.4 g/kg LBM before you start trying to lose weight.
The table below shows what this protein looks like for men and women, depending on your height. Once you consistently get at least this much protein, you can start dialling back energy from fat and carbs in your diet.
| height (cm) | height (inches) | female protein (g) | male protein (g) |
| 150 | 59 | 56 | 76 |
| 155 | 61 | 60 | 81 |
| 160 | 63 | 64 | 86 |
| 165 | 65 | 68 | 92 |
| 170 | 67 | 72 | 98 |
| 175 | 69 | 77 | 103 |
| 180 | 71 | 81 | 109 |
| 185 | 73 | 86 | 116 |
| 190 | 75 | 90 | 122 |
| 195 | 77 | 95 | 128 |
| 200 | 79 | 100 | 135 |
| 205 | 81 | 105 | 142 |
| 210 | 83 | 110 | 149 |
If you want to see what different protein intakes would look like for your preferences and goals, you can play with our free macro calculator here.
You can also check our Macros Masterclass, which walks Optimisers through the process of finding the macronutrient ratios that get them to lose weight at a sustainable rate.
Should I Eat More or Less Protein If I Have Diabetes?
One of insulin’s primary functions is to keep the extra energy you’ve accumulated on your bums, belly, hips, and thighs locked away. This includes your body fat, glycogen (stored glucose) in your liver, and muscle.
If you are insulin resistant or have Type-2 Diabetes, your muscle is not as responsive to insulin’s signalling. Thus, more of your muscle and dietary protein will convert into glucose via gluconeogenesis in your liver. Professors Raubenheimer and Simpson point to this as the main reason absolute protein intake has slightly increased while obesity and diabetes have increased.
Our analysis of the Food Insulin Index data also shows that prioritising protein tends to displace carbohydrates and thus leads to better blood glucose control. Many people in our Data-Driven Fasting challenges find their blood sugar falls after a high-protein meal.
So, if you’re insulin resistant, the solution to achieving healthy blood glucose is not to avoid protein! Instead, it’s to prioritise protein to improve satiety and retain muscle while decreasing energy from fat and carbs.
Reducing non-fibre carbohydrates stabilises blood glucose levels, improves appetite control, and reduces the need for medications like exogenous insulin.
Although dietary fat has the lowest insulin index, reducing this calorie-dense macronutrient allows for a reduction in body fat, improved insulin sensitivity, and better metabolic health.
For more on what the insulin index is, check out Making Sense of the Food Insulin Index.
How Does Protein Need Change as We Age?
Official dietary guidelines typically recommend a higher protein intake for people over 70 despite a tendency for their energy intake, activity output, and appetite to decrease.
Sarcopenia, or muscle wasting, is a significant concern for the elderly. Most people start losing strength from their 30s onwards. As a result, many older people become frail and experience falls that contribute to other complications and, often, eventually, death.
There are many factors at play here, including changing hormones. However, insulin resistance and diabetes (as noted above) are likely also significant factors.
As we age, we tend to be less active and lose muscle mass. Subsequently, our appetite decreases, which makes it even harder to get adequate protein. Hence, prioritising a higher protein % becomes even more critical for older adults.
What Factors Influence Protein Intake?
Most of the time, our appetite does an excellent job of regulating our protein intake.
If you are a growing child, an active athlete, or a bodybuilder, you will naturally crave more protein to support your body’s growth and repair. Meanwhile, more sedentary people carrying less muscle will crave less protein.
Counterintuitively, because their energy requirements are typically low, we often see older, post-menopausal women in our challenges thrive on a higher protein percentage, which is required to obtain adequate protein.
Rather than trying to eat more protein, the key to increasing satiety and weight loss is to up your per cent of total calories from protein—or your protein percentage (protein %)—while moderating carbohydrates to stabilise blood glucose levels and eating less fat so your body can use its own body fat.
Summary
- The lower limit AMDR for protein (10%) has been set based on the intake shown to impair immune function.
- Protein malnutrition is a significant cause of death in children worldwide and results in life-threatening conditions like marasmus and kwashiorkor. Similarly, our analysis supports the understanding that obtaining adequate micronutrients on a very low-protein % diet is challenging.
- The upper limit AMDR for protein has been set based on typical Western population intakes and was set to match the AMDR limits for fat (20%) and carbs (45%).
- While a protein intake lower than the AMDR minimum would likely come with consequences, there is a lack of evidence showing that a higher protein % has adverse effects.
- Our analysis of Optimiser data shows that dialling back your fat and carbs and increasing your protein % aligns with greater satiety and nutrient density.
- Most people are likely already consuming enough protein due to cravings for it; we might just be overconsuming calories to get it!
- The key to weight loss and improving nutrient density is not to jump from a low protein intake to an extremely high protein intake but rather to dial back energy from fat and non-fibre carbohydrates while prioritising protein.
AMDR series
- Carbohydrates – The Optimal vs Acceptable Macronutrient Distribution Range (AMDR)
- Fat – Optimal vs Acceptable Macronutrient Distribution Range (AMDR)
- The “Acceptable” Macronutrient Ranges (AMDRs) for Protein, Fat and Carbs: A Data-Driven Review
- Dietary Fibre: How Much Do You Need?
- Low Carb vs LowFat: What’s Best for Weight Loss, Satiety, Nutrient Density, and Long-Term Adherence?
- High Protein vs High Fat: What’s Ideal for YOU?
Hello Marty. This is a very interesting and informative article. However, there is one part I don’t understand. When you say:
“which is 800 extra calories per day”, do you mean that the protein powder should be counted as more than 4kcal per gram because it is metabolized faster?
Where do you get the extra 800 calories from?
-> That said, a study of athletes consuming 4.4g/kg body weight per day of protein, or 5.5 times the RDA, showed no negative effects in terms of weight gain. Although they consumed 307 grams of protein per day (1228 calories!), mainly from protein powders “which is an extra eight hundred calories per day”, the participants did not gain weight. On the contrary, they lost body fat and gained lean body mass!
Thanks a lot for your sharing 🙂
From the discussion section of the linked paper, which notes “The current investigation found no changes in body weight, fat mass, or fat free mass in the high protein diet group. This occurred in spite of the fact that they consumed over 800 calories more per day for eight weeks.”