
This final section of the Micros Masterclass FAQs details micronutrient trends in various dietary trends.
- Will a Higher Diet Quality Score Help Me Eat Less and Lose Weight?
- Does It Matter If I Prefer Low-Carb, Low-Fat, High-Carb or High-Fat?
- What Are the Most Common Nutrient Deficiencies?
- What are Common Nutrient Deficiencies in Popular Diet Trends?
- Which Nutrients Align with Eating More?
- Which Fats Make You Skinny?
- Which Nutrients Align with Eating Less?
- More
Will a Higher Diet Quality Score Help Me Eat Less and Lose Weight?
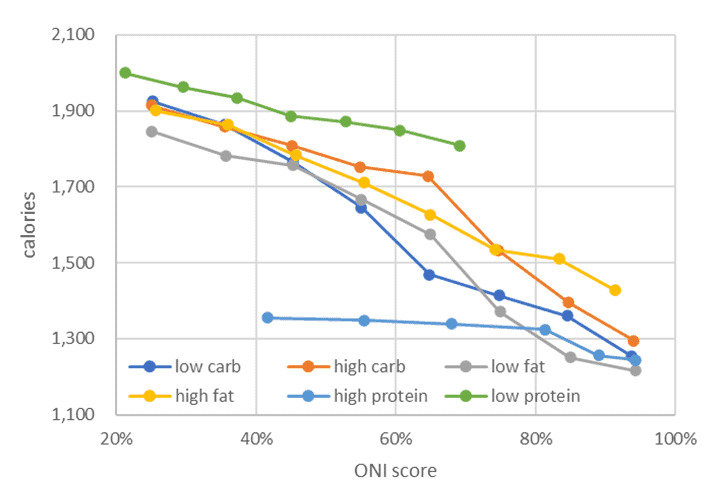
Nutrient-dense foods will crush your cravings and are also really hard to overeat. The chart below shows that Diet Quality Score in Nutrient Optimiser consistently corresponded to a whopping 40% reduction in calorie intake!

Does It Matter If I Prefer Low-Carb, Low-Fat, High-Carb or High-Fat?
The relationship between diet quality and calories still holds, regardless of whether you prefer a high-fat, low-fat, low-carb or high-carb diet. The one scenario nutrition optimisation doesn’t necessarily work well with is a low-protein diet, shown as the green line in the chart below. This is because foods without protein your food doesn’t provide the same benefit in terms of satiety or nutrient density.
What Are the Most Common Nutrient Deficiencies?
The nutrient fingerprint chart below shows each nutrient as a proportion of the ONI stretch targets for the data from all Optimisers. At the top of the chart, we can see that the nutrients people typically find most challenging to get in optimal quantities are:

Before putting in an Amazon order for these supplements, remember that everyone’s nutritional fingerprint is different. In other words, these nutrients are not necessarily the nutrients that you struggle to get. The only way to see what you need more of is to track your typical diet for a few days.
If you’re not part of the Micros Masterclass, you can check your micronutrient fingerprint using our Free 7-Day Nutrient Clarity Challenge.
What are Common Nutrient Deficiencies in Popular Diet Trends?
As you may have guessed, different diet approaches have different nutritional challenges.
Carnivore vs Plant-Based
People following a strict plant-only diet may get heaps of vitamin K1, potassium, and magnesium. However, they may struggle to get adequate amounts of amino acids, B12, zinc, and omega-3 fatty acids.
Meanwhile, people on the opposite end of the spectrum following a carnivorous diet likely get plenty of bioavailable protein. However, they may struggle to get enough potassium, magnesium, manganese, molybdenum, and vitamin C.
Low-Carb vs High-Carb
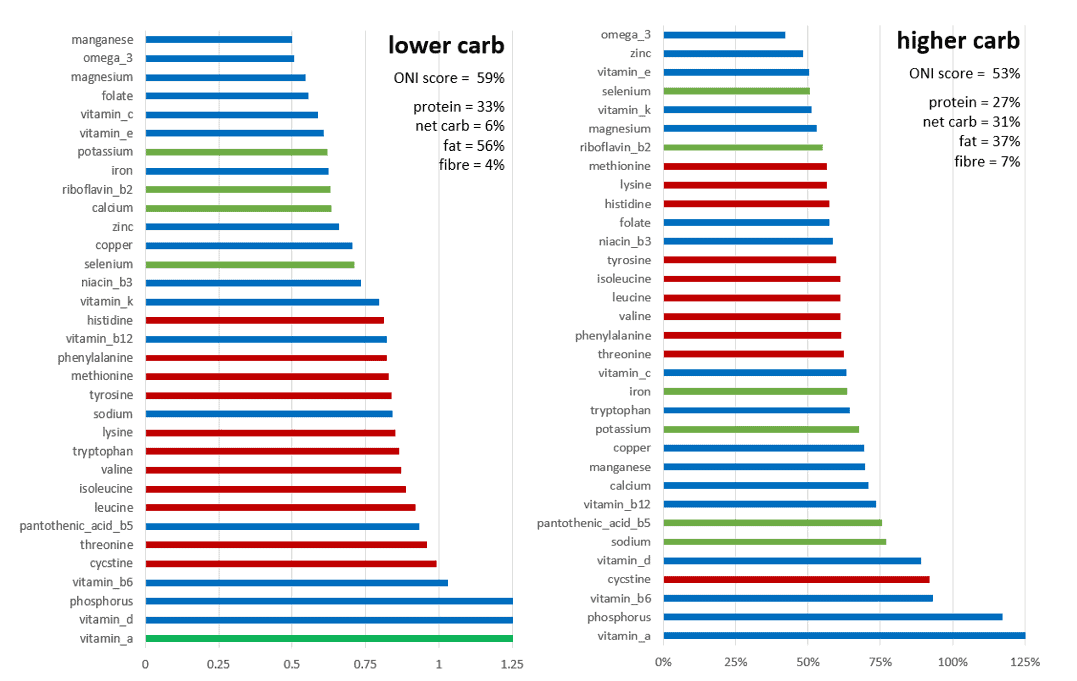
The charts below compare the average of Optimisers following a lower-carb diet vs a high-carb diet.
- The overall diet quality is similar, although it appears to be easier to get adequate amino acids on a lower-carb diet.
- Omega-3s tend to be a challenge for both approaches.
- In contrast, the lower-carb approach (average net carbs = 6%) tends to have a hard time getting enough magnesium, folate, vitamin C, and potassium (i.e. micronutrients found readily in green vegetables).
- The higher-carb optimisers struggle to get zinc, selenium, and vitamin B2 (i.e. micronutrients typically present in meat and seafood).
High-Protein vs Low-Protein
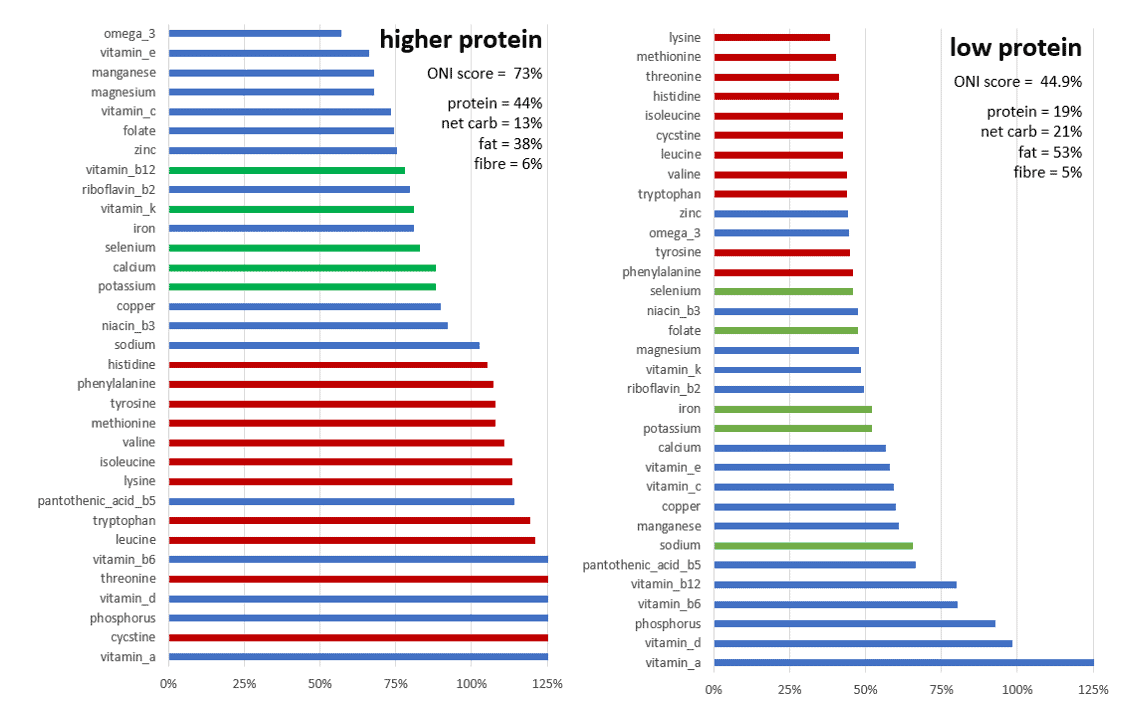
The one comparison where significant differences are extremely apparent is when we look at a lower-protein (Diet Quality Score = 45) vs a higher-protein diet (Diet Quality Score = 73).
Not only do people who try to minimise their protein struggle to get enough amino acids, but they also lack critical nutrients like zinc, omega-3s, selenium, niacin (B3), and folate (B9).
If you focus on getting adequate vitamins, minerals, and omega-3 fatty acids, you will inherently get plenty of amino acids. Foods that naturally contain these nutrients’ bioavailable forms are also protein-rich.
Which Nutrients Align with Eating More?
The table below shows the relative satiety benefit of nutrients that consistently align with consuming more calories. For example:
- Moving from a high proportion of energy from fat and carbs to the lowest aligns with the most significant reduction in calories,
- Reducing fat or non-fibre carbohydrates tends to align with a similar calorie reduction, and
- Decreasing energy from starch, omega-6 fatty acids, saturated fat, monounsaturated fat, sugar, total carbs, and polyunsaturated fats all align with a lowered calorie intake, but to a lesser extent.
| nutrient | satiety benefit |
| fat+net carbs (%) | -44% |
| net carb (%) | -28% |
| fat (%) | -26% |
| starch (%) | -19% |
| omega 6 (%) | -15% |
| saturated fat (%) | -14% |
| monounsaturated fat (%) | -13% |
| sugar (%) | -9% |
| total carb (%) | -7% |
| polyunsaturated fat (%) | -4% |
Although all of these food properties are demonised by different groups, it’s much more effective to focus on dialling back energy from fat and non-fibre carbohydrates while prioritising foods containing the nutrients your body needs to thrive.
Which Fats Make You Skinny?
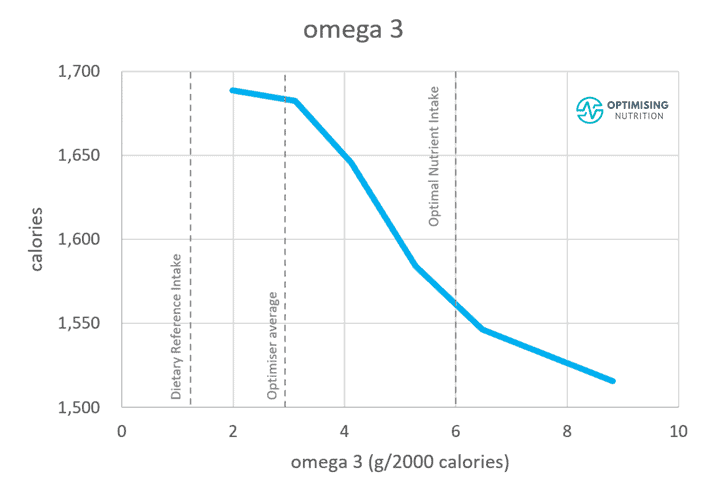
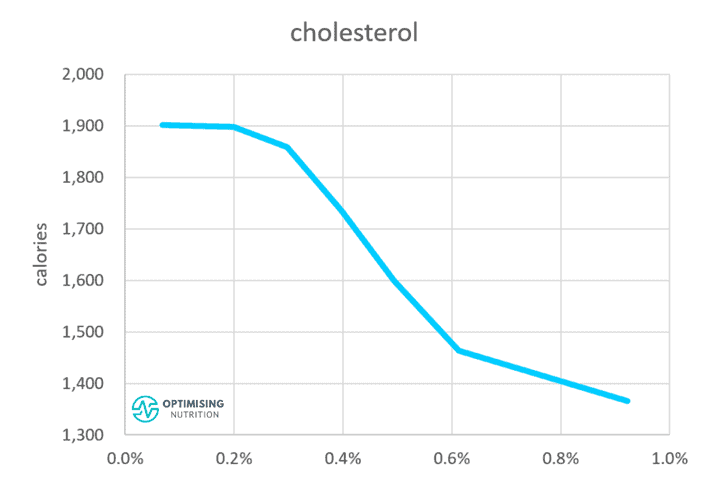
Our analysis indicates that foods with more omega-3s and cholesterol per calorie align with a lower energy intake.
You will find plenty of divergent options on cholesterol. The fact that foods containing more cholesterol per calorie tend to align with eating less does not mean you should go out of your way to eat more cholesterol. Still, there is no need to avoid nutrient-dense, high-satiety foods that contain cholesterol (e.g. eggs, liver etc.).
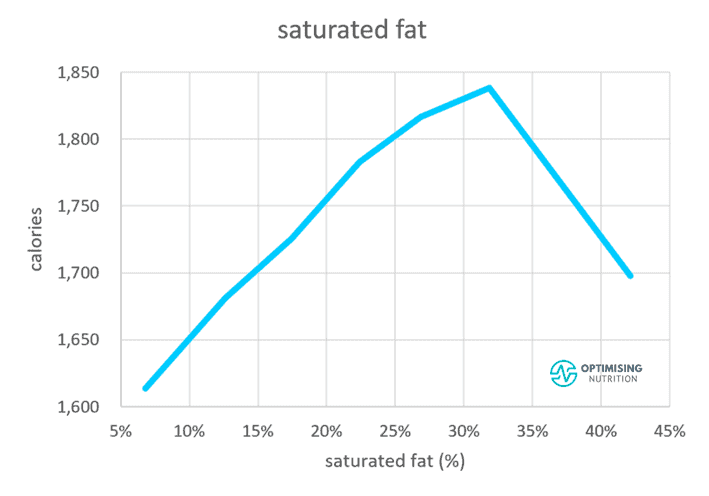
Interestingly, a diet of about 30% of calories from saturated fat tends to align with a higher calorie intake but decreases from there. This may be because saturated fat, an added ingredient in something like burgers and fries, makes a hyper-palatable meal. In contrast, single-ingredient foods that naturally contain saturated fat and plenty of protein, like fatty steak, are harder to overconsume.
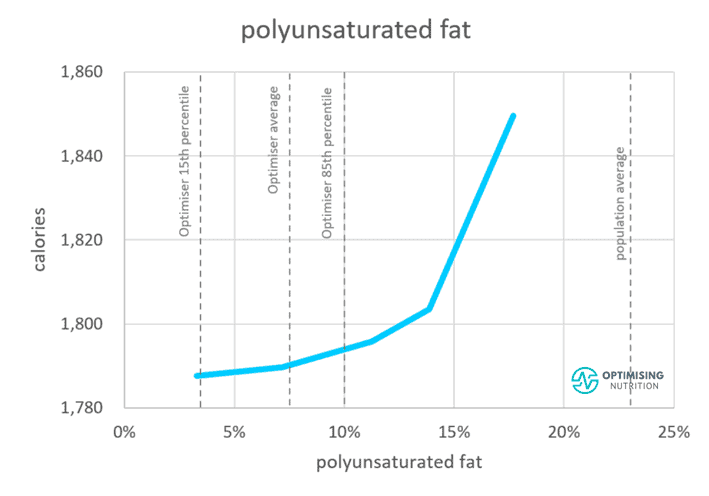
Meanwhile, consuming larger quantities of polyunsaturated fat and monounsaturated fat tends to align with consuming more energy.

Which Nutrients Align with Eating Less?
The table below shows the ranking of nutrients that aligns with a reduced energy intake. Again, a higher protein % has the largest effect, closely followed by potassium and varying amino acids. It’s important to note that the satiety effects of each of these nutrients are not independent of each other.
| nutrient | satiety benefit |
| protein (%) | 55% |
| potassium (g/cal) | 49% |
| cholesterol (%) | 33% |
| folate (mg/cal) | 33% |
| calcium (g/cal) | 33% |
| niacin (B3) (g/cal) | 32% |
| vitamin B5 (g/cal) | 28% |
| riboflavin (B2) (g/cal) | 28% |
| iron (g/cal) | 28% |
| selenium (g/cal) | 26% |
| sodium (g/cal) | 24% |
| vitamin A (g/cal) | 23% |
| magnesium (g/cal) | 22% |
| fibre:carb ratio | 21% |
| vitamin B6 (g/cal) | 20% |
| energy density | 20% |
| vitamin K1 (g/cal) | 19% |
| thiamine B1 (g/cal) | 17% |
| vitamin E (g/cal) | 17% |
| fibre | 16% |
| manganese | 15% |
| vitamin C (g/cal) | 14% |
| zinc (g/cal) | 13% |
| omega 3 (g/cal) | 11% |
| vitamin B12 (g/cal) | 9% |
| copper (g/cal) | 8% |
To understand the combined satiety response to the various nutrients, the table below shows the results of a multivariate analysis.
| p-value | 15th | 85th | calories | % | |
| protein (%) | < 0.000005 | 20% | 43% | -435 | -27.0% |
| potassium | 2.18746E-63 | 2253 | 5748 | -116 | -7.2% |
| vitamin B2 | 2.46948E-07 | 6.4 | 18.4 | -87 | -5.4% |
| calcium | 5.58291E-09 | 511 | 1801 | -35 | -2.2% |
| sodium | 1.04402E-13 | 1507 | 4875 | -35 | -2.2% |
| fibre: carb ratio | 1.32521E-09 | 0.14 | 0.43 | -34 | -2.1% |
| vitamin A | 0.064898156 | 3431 | 35211 | -10 | -0.6% |
Protein % was shown to have the most significant effect, with a 27% independent calorie reduction when someone moves from a low to high protein %. Potassium also has a highly statistically significant impact and corresponded to a 7.2% reduction in calories. This was followed by vitamin B2, calcium and sodium, respectively.
Remember that this effect represents the overall average of thirty-four thousand Optimisers. The nutrients you crave and greater satiety will be unique to your current diet and nutritional requirements.